Investment Framework for a Rising Interest Rates Environment

Amongst the strategies to employ for the current interest rate environment is a Liability Driven Investment (LDI) approach. 

LDI provides a framework for managing retirement income outcomes in what is likely to be a rising interest rate environment over the years ahead. 

LDI places retirement planning goals at the centre of the investment approach leading to several key benefits:

  1. More stable level of income in retirement;
  2. More efficient use of capital – potentially need less retirement savings; and
  3. Better framework to make trade-off between allocation to equities and the retirement income portfolio in improving the likelihood of reaching desired standard of living in retirement.

Under LDI a more customised investment solution can be developed.

Conversely, if an investor runs with a Cash strategy, where the goal is primarily capital preservation, they will likely need additional precautionary savings to meet their income requirements over retirement.

Therefore, while an LDI strategy increases the likelihood of reaching the retirement income objectives, it also achieves this with a more efficient allocation of investment capital.

The additional capital could be used for current consumption or invested in growth assets to potentially fund a higher standard of living in retirement, or used for other investment goals e.g. endowments and legacies.

Accordingly, LDI potentially provides a better framework in which to evaluate the risk of meeting your retirement income goals in a rising interest rate environment.

Retirement Planning (mis) focus

Arguably the primary goal of retirement planning is to provide a stable and secure stream of income in retirement – income to support a desired standard of living in retirement.

However, retirement planning investment approaches often focus too heavily on accumulated wealth e.g. how much do I need to save to retire on?

This could potentially result in the wrong focus.  For example, if a New Zealander retired in 2008 with a million dollars, their annual income would have been around $80k by investing in retail term deposits.  Their income would have dramatically dropped in 2009 to approximately $35k.  That is a big drop in income!  But interest rates have fallen further, currently (Feb 2021) a million dollars invested in New Zealand Term deposits will generate around $10k.

As a result, the focus should not necessarily be on the size of the account value e.g. KiwiSaver account balance.

This reflects that volatility of capital and investment returns are not a true measure of a retiree’s investment risk.

Investment strategies that focus on capital preservation, such as holding high levels of cash and short-term fixed income strategies, are riskier and more volatile relative to the investment goal of generating a stable and secure stream of income in retirement.

Redefining the Retirement Goal

Those planning for retirement seek to secure essential (sufficient income) and aspirational goals (additional wealth accumulation) with a high probability of achieving them.

Accordingly, the goal for retirement can be split between retirement income (essential goals) and wealth accumulation (aspirational goals). 

Those saving for retirement should be focusing on more than accumulated wealth alone. Other key considerations may include a desired level of retirement spending, meeting children’s education costs, healthcare costs, and a legacy.  These can be considered as future liabilities that need to be met.

Consequently, a better measure of a retiree’s investment risk becomes uncertainty around how much spending can be sustained in retirement.

Liability Driven Investing

Liability-driven investment (LDI) strategies, otherwise known as asset-liability management (ALM), take a complete and holistic approach.

LDI explicitly includes an investor’s current and future liabilities e.g., essential and aspirational goals.

The traditional way of building portfolios focusses more on risk tolerance, return expectations, and accumulated wealth rather than achieving the investment goals outlined above.

LDI creates better portfolios, particularly when it comes to retirement needs.  A more robust portfolio is generated, and the focus is on the key investment risk; failure to meet your investment objectives.

Obviously most financial planning processes take into consideration investment and retirement goals. Nevertheless, LDI makes retirement goals the central piece of constructing a portfolio. With LDI, portfolio allocations and management of risks are relative to meeting retirement objectives.

A more customised investment solution is developed.

See here for more on LDI.

The Benefits of LDI

Dimensional Funds Advisors (DFA) undertook analysis comparing two investment strategies relative to the goal of generating a stable and secure level of income in retirement:

  1. Goals based strategy that looks to generate sufficient income in retirement to match expected spending (consumption). This is the LDI strategy.
  2. Capital preservation strategy that is invested in Cash to manage the volatility of the account balance.

The following conclusions can be drawn from the DFA analysis:

  • The LDI strategy provides a more stable stream of income in retirement;
  • The LDI strategy provides greater clarity and confidence to plan for retirement; and
  • The Cash strategy results in a high level of volatility relative to the goal of generating a stable level of income in retirement.

See here for a detailed review of the DFA Research. 

In simple terms, the LDI strategy is a long-term bond portfolio that matches the expected retirement spending/consumption goal. Effectively, the LDI strategy generates cashflows to match future expected spending.

This reduces volatility relative to retirement spending goals.

Insurance Company’s implement a similar approach in meeting (paying out) future expected liabilities (insurance claims).

DFA conclude that “any strategy that attempts to reduce volatility using short- to intermediate-term fixed income, when the goal is a long-term liability like retirement consumption, will not be as effective as the LDI strategy.”

Although cash is perceived as low risk, it is not low risk when it comes to generating a steady and secure stream of income in retirement. Likewise, short term fixed income securities, while appropriate for capital preservation, are risky if the goal is to meet future spending/consumption in retirement.

In summary a LDI strategy provides the following benefits:

  1. More stable level of income in retirement;
  2. More efficient use of capital – potentially need less retirement savings; and
  3. Better framework to make trade-off between allocation to equities and retirement income portfolio in improving the likelihood of reaching desired standard of living in retirement.

If an investor runs with a Cash strategy, where the goal is primarily capital preservation, they will likely need additional precautionary savings to meet their retirement income requirements.

Therefore, while an LDI strategy increases the likelihood of reaching the retirement income objectives, it also achieves this with a more efficient allocation of capital.

This additional capital could be used for current consumption or invested in growth assets to potentially fund a higher standard of living in retirement, or used for other investment goals e.g. endowments and legacies.

Accordingly, LDI potentially provides a better framework in which to assess the risk of meeting your retirement income goals in a rising interest rate environment.

LDI Investment Framework for Individuals

Under the LDI model there are two portfolios: the liability portfolio and a return seeking portfolio. Most investment products offered today are return seeking portfolios with some dampening down of risk (measured by volatility of returns).

LDI is used by pension funds and insurance companies where their investment objectives and portfolios are primarily reflected in the terms of their future liabilities.

“Institutional” investment approaches such as LDI, Two-portfolio separation, and being more dynamic, are finding their way into wealth management solutions.

Goals-Based Investing is the wealth management counterpart to LDI. By way of example is EDHEC Risk Institute Goal-Based Investing Approach.

EDHEC suggest investors should maintain two portfolios:

  1. Goal-hedging portfolio – this replicates future replacement income goals; and
  2. Performance-seeking portfolio – this portfolio seeks returns and is efficiently diversified across the different risk premia – disaggregation of investment returns.

And, over time the manager dynamically allocates to the hedging portfolio and performance seeking portfolio to ensure there is a high probability of meeting retirement income levels.

Nevertheless, and most importantly, the Goal Based Investment framework outlined by EDHEC focuses on the goal of generating income in retirement.

Instead of worrying about fluctuations in capital, investors investing for retirement should worry about fluctuations of income in retirement.

With regards to capital specifically, the focus should be on avoiding permanent loss of capital, rather than fluctuations in capital.

See here for more on the EDHEC Goals Based Investment approach.

Please read my Disclosure Statement

 

Global Investment Ideas from New Zealand. Building more Robust Investment Portfolios.

Competitor Analysis KiwiSaver Conservative Funds – the value of a good investment strategy

An analysis of KiwiSaver Conservative Funds identifies a variation in underlying asset allocations, despite there being a generic look at a higher level (Income / Growth split).

The area of most pronounced difference is within the Income asset class allocations: Cash, New Zealand Fixed Income, and International Bonds.  There are also nuances within each of these asset classes, particularly level of benchmark duration risk.

These differences will drive performance outcomes, having nothing to do with active management skill and very little in relation to fees paid.

Portfolio performance is primarily driven by portfolio construction and implementation decisions.  The value of a good investment strategy.

Within the Income asset classes, the decision on duration and credit quality will drive performance (absolute returns and relative to peers).  These decisions impact return outcomes over both the short and longer term.

A comparison to Australian Super Funds with similar objectives provides useful insights into asset allocation decisions being made in New Zealand.

Analysis of Balance and Growth KiwiSaver Funds has also been undertaken and will be provided at a later date.

Analysis of KiwiSaver Conservative Funds

The Table below provides average, min, and max allocations of the Strategic Asset Allocations of 12 KiwiSaver Providers’ Conservative Funds, sourced from their latest Statements of Investment Policy and Objectives (SIPO).

  Cash Fixed Income
NZ
Fixed Income
International
Income
Allocation
Average 15.6%22.7%39.1%77.4%
Min1.0%14.0%28.0%70.0%
Max30.0%36.0%50.0%82.0%
Median17.3%23.0%40.5%79.0%
 Listed Equities
New Zealand
Listed Equities
International
Listed
Property
AlternativesGrowth
Allocation
Average6.6%12.4%4.0%2.1%22.7%
Min4.0%9.0%0.0%0.0%18.0%
Max9.5%16.0%7.5%5.0%30.0%
Median6.3%12.5%4.0%1.6%21.0%

Income Assets

From a top level, by and large the managers are tightly grouped around 77% allocation to Income assets (Cash, NZ Fixed Income and International Bonds). 

There are a small group of four managers which are outliners, with income allocations closer to 70%.  

This group is materially different from the bulk of the managers.  They tend to have lower cash allocations and much higher equity allocations. Only one of these managers has a material weighting outside of the listed equity markets e.g. Alternatives.

Within Income Assets

The variation within Income asset class occurs at both the asset allocation and performance benchmark level.  Both of which drive performance outcomes.

As can be seen from the Table above the variation in the allocation to Cash is extreme. Ranging from 1.0% to 30.0%.

Maintaining high levels of cash does not make a portfolio less risky. High levels of cash can raise risks relative to certain investment objectives, particularly if the investor is seeking a stable and more predictable income stream in retirement.

High levels of cash increase the variation of income in retirement and is less effective in providing portfolio protection at the time of sharp sharemarket declines.  On both counts, longer maturing fixed income provides a better solution.  See here for why holding high levels of cash at retirement can be scandalous.

Given the current environment of very low interest rates and higher equity market valuations in the US and NZ, a higher weighting to cash could be warranted.

The key benefits of cash are that it is highly liquid, provides emergency funds without impacting longer-term investments, and can arguably be “dry powder” funds when sharemarkets decline sharply.  The key to the dry powder factor is having the investment discipline to act accordingly.

The allocations to Fixed Income (NZ Fixed Income and Global Bonds) are tighter, ranging from 50% – 76%, and averaging around 62%.

The allocation International Bonds is higher relative to domestic Bonds, on average making up 64% of the Fixed Income Allocations. International Bonds are the largest asset allocation weight within the portfolios of just under 40%.

Risk and Investment Management

From a risk management, and investment management perspective, a portfolio’s capital allocations to cash, NZ Fixed Income, and International Bonds are less relevant relative to the Portfolio’s duration and credit exposures.

A more accurate way of looking at risk, and managing a portfolio, is a Portfolio’s level of duration and credit exposure.

Duration is a key risk measure, and in general reflects a portfolios capital value sensitivity to changes in interest rates. Duration is measured in years.  For example, assuming your Portfolio’s duration is 6 years, if interest rates rise by 1% the portfolio will decline by 6%, all else being equal.

See here for an explanation of Duration and here for credit risk.

Generally, those with a higher allocation to International Bonds have a higher level of interest rate risk.  These portfolios would have benefited more from the significant decline in interest rates over the last 20 years.

From a high level, the range in total Portfolio duration is estimated to be:

Total Portfolio Duration
Average 4.06
Min 3.27
Max 5.01
Median 3.99

These are estimates, based on current index duration and portfolio asset allocations.  The key points are, this is a more accurate view of portfolio risk and there is a reasonable spread in duration risk amongst the managers.

From this perspective, investors must be careful in assessing the relative risk of a Conservative Fund based on asset allocations alone.

By way of example, some Managers manage to a lower duration international bond index.  Thus, despite having a higher international bond allocation these Portfolios may have lower interest rate risk (duration) than a portfolio with a lower international bond allocation but managing to a higher duration index. They may also have the same level of interest rate risk!

Therefore, what is important is how much duration risk a portfolio should have in meeting its investment objectives.

From an investment governance perspective, Investment Committees should not be debating the level of allocation to cash, international, or NZ fixed interest without first considering what is the most appropriate level of portfolio duration risk to target in meeting investment objectives.  This is a different conversation and focus.

There is evidence that at least one of managers takes such an approach, maintaining a very low allocation to cash and a high allocation to Fixed Income.  This portfolio is not necessarily riskier than the other Funds just because it has a low cash holding.

Lastly, it should be noted that the duration on the International Bond Index has almost doubled over the last 10 years.  Therefore, if portfolio allocations to international bonds have remained static over the last 10 years, the risk of this allocation has increased along with the total portfolio’s risk profile.  Unfortunately, with interest rates so low, the return prospects are less, yet the risks have increased.

For more on the unintended risks within fixed income see here

Growth asset

As would be expected, the Growth Allocation is reasonably tight around 23%, the flip side of the Income Allocation.

Listed equities, including New Zealand equities, international equities, and listed property and infrastructure dominate the growth allocations i.e. there is very little investment in Alternatives.

Direct Property dominates the Alternative allocations.

Of interest, on average Domestic equities (New Zealand and Australia) make up around 35% of the core equities allocations e.g. domestic and international listed equities ex listed property and infrastructure.

Overall, core equities make up 19% of portfolios, domestic equities are around 6.5% of a Conservative Portfolio.

Ratio of Domestic Equities
in Core Equities Allocation
Core Listed Equities
Portfolio Allocation
Average 34.5%19.0%
Min25.0%13.0%
Max47.4%22.5%
Median31.5%19.5%

The Growth allocations will be discussed in more depth when presenting the results of the Balance and Growth Fund’s allocations.

Australian Fund Comparison

The Table below presents the average, min, max, and medium asset allocations of the largest Super Funds in Australia.  This list is dominated by Industry Funds.

The list includes funds with Conservative in their name and/or have similar return objectives to the KiwiSaver Funds.  The return objectives are express as inflation plus a margin e.g. CPI + 1.0%.

The following quick observations can be made:

  1. The Australian Funds have lower allocations to Income Assets than the New Zealand Funds, this is consistent with the Australian Funds having higher CPI + return objectives.  A return objective is necessary to undertake portfolio modelling. Also, don’t always choose a Fund my its name!
  2. At the same time, the Aussie Funds have much higher Cash allocations relative to the NZ Funds.
  3. The above means the Australian Funds have much lower Fixed Income allocations.  They also only show Fixed Income, not domestic and international bonds breakdown, which is consistent with the discussion above.
  4. Interestingly, the listed equity allocation is in line with the Kiwi Funds, around 20%.  However, the weighting in Australia to domestic equities in the total core equities allocation is closer to 50%, compared to 35% in NZ.  Domestic equities make up around 9% of a Conservative Fund in Australia, compared to 6.5% in New Zealand. Albeit, the Australian Funds do have a higher risk profile.
  5. The Australian Funds have significantly higher allocations to Alternatives than the NZ Funds.  When you consider a similar core equities allocations and higher cash allocations in Australia, the higher Alternatives allocation comes at the expense of Fixed Income.
Australian
Super Funds
CashFixed IncomeIncome
Allocation
Average27.5%36.7%59.6%
Min23.0%28.5%53.0%
Max37.0%67.0%67.0%
Median25.0%30.3%58.3%
Listed Equities
Domestic
Listed Equities
International
AlternativesGrowth
Average9.1%11.1%21.8%40.4%
Min7.0%7.0%6.0%33.0%
Max11.5%17.5%29.5%47.0%
Median9.5%10.5%24.0%41.8%

The Alternatives allocation will be discussed in more depth when presenting the results of the Balance and Growth Fund’s allocations.

Please read my Disclosure Statement

 Global Investment Ideas from New Zealand. Building more Robust Investment Portfolios.

Monthly Financial Markets Commentary and Performance – January 2021

The most recent Monthly Financial Markets Commentary and Performance is for March 2021.

David vs Goliath

  • GameStop dominated headlines over the last week of January and distracted market participants from key fundamentals.
  • In a sign of our times, encouraged via social media platform Reddit retail investors brought into GameStop, one of the most heavily shorted stocks in the market.  This led to a “short-squeeze”.  As the stock price of GameStop rose, rising by over 1,500% in January, short-sellers had to buy back the stock to cover their loses, pushing the stock price higher.  Loses from the short-squeeze are estimated to have totaled $6 billion at one stage, mainly incurred by hedge funds.
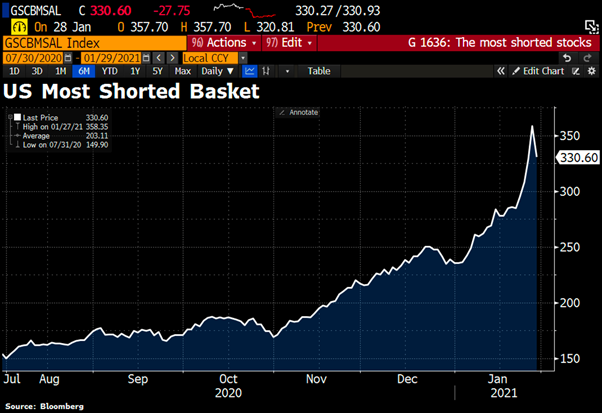
  • A Goldman Sachs’ index of the most heavily shorted stocks rose close to 30% in January, ouch!  This is the index’s best monthly return since 2008, a painful month for short sellers. See graph below.
  • The GameStop short-squeeze is considered one of the largest in US history and resulted in increased market volatility. 
  • Another Goldman Index of the most popular hedge funds stocks fell by over 5% in a week as hedge funds sold stock positions to cover losses on their shorts, double ouch!!
  • The events surrounding GameStop are not expected to derail global equities markets, which are best characterised as at the early stages of a new bull market run.  Pull backs and corrections can be expected along the way.

Economic Fundamentals

  • The GameStop event detracted from developments earlier in the month and improving fundamentals in relation to the fight against the Coronavirus.
  • The US Democratic party took control of the US Senate by the slimmest of margins after winning both seats in the Georgia run-off elections held in early January.  They now control the Presidency, Senate, and House of Representatives.
  • President Biden released his $1.9 trillion (over 8% of the economy) Covid-19 Relief package, this is in addition to the $900 billion of spending approved by Congress in December.  The plan includes $1,400 in additional direct payments to individuals (raising checks to $2000) and aid to small businesses. 
  • Although there are political risks around getting the complete packaged passed, a significant percentage of the package is likely to be passed into law.  This will represent a sizable stimulus for the US economy in the months ahead.
  • The extra spending along with ultra-low interest rates argues well for the global and US economy in 2021 and 2022.
  • Interest rates are likely to remain low for some time.   Many Central Banks, for example the US Federal Reserve and Reserve Bank of Australia, are unlikely to raise interest rates until annual inflation has run above 2% for some time.  This is not expected to occur until late 2024.
  • Over the later part of January, the daily rate of global coronavirus cases and hospitalisations began to decline, particularly in the US, Europe, and Japan.
  • At the same time the global vaccine rollout continues to gather pace, approximately 4.5 million vaccine doses are being administrated daily.
  • In total, more than 100 million vaccine doses had been administrated in 56 countries by early February 2021.  Israel is leading with over 57% of their population vaccinated.  America has vaccinated over 32 million people, 9.6% of their population.  The UK has reached 14% of their population.
  • Goldman Sachs predict: The UK is expected to vaccinate 50% of its population in March, with the US and Canada following in April. The EU, Japan, and Australia reach this 50% threshold in May.
  • Once the vaccine rollout gathers speed the reopening of economies will accelerate around the world.

Economic data

  • Although global economic activity slowed over the last few months of 2020, due to rising covid-19 cases and associated lock down measures, the global economy is on track for a V-shaped recover.  The US and China are leading the way.  Europe is at risk of a double dip recession.
  • The consensus forecast for world economic growth in 2021 is just over 5%, and approximately 4.0% for 2022.  The global economy shrank by around 4.0% in 2020.
  • For the first time in over 10 years, we are likely to see strong and synchronised global economic growth over the years ahead.
  • The Chinese economy rose 6.5% in the last quarter of 2020 from a year earlier.  A strong outcome to finish the year and resulted in the Chinese economy growing 2.5% last year, the only major economy to report positive economic growth for 2020.  Albeit this is the country’s weakest annual economic expansion since the late 1970s.
  • Based on first estimates the US economy grew 4.0% (annualised rate) over the 2020 December Quarter, which is below consensus forecasts and down on the 33.4% annualised rate in the third quarter of last year.
  • The Euro area economy contracted 0.7% over the final three months of 2020, this was a little bit better than expected.
  • Economic activity in New Zealand and Australia is exceeding expectations.  Most notable was the surprise fall in New Zealand’s unemployment to 4.9%, levels not seen since 2017 and much lower than the 5.6% anticipated.  The export and housing sectors drove employment growth.

Market Performance

  • Reflecting the volatility arising from the GameStop short-squeeze the US sharemarket fell 1.0% in January.  In the US smaller sized companies continued to outperform.
  • International sharemarket benchmarks performed a little better than the US market. Markets across Asia performing well, particularly China (+4.8%).  Latin American markets underperformed.
  • Overall, Emerging Markets continued to outperform Developed Markets, EM markets returning over 3.0% in January.
  • The Australian and New Zealand sharemarkets eked out positive returns, +0.3% and 0.1% respectively.
  • Commodities performed well, +4.8%, oil outperformed in January (+7.5%) and the price of Gold fell (-2.5%).
  • By and large fixed income underperformed in January, particularly longer dated securities as interest rates drifted higher.  In New Zealand, the Government Bond Index fell 0.3% and Australia’s -0.7%.

Please read my Disclosure Statement


Global Investment Ideas from New Zealand. Building more Robust Investment Portfolios.