A Framework for Including Alternatives into a Portfolio

Over the years Kiwi Investor Blog has covered alternatives and the benefits they can bring to a well-diversified portfolio. What I have not done is provide a practical framework for how to actually introduce them.

This post attempts to do that. It is not a complete list. Think of it as a starting point.

A word on scope first. This is not an argument against equities and bonds. They will remain the core of most well-constructed portfolios and rightly so.

The case for alternatives is about enhancing those exposures, improving the overall risk and return profile of a portfolio, and building a portfolio that is more resilient across a range of different market environments.

The inclusion of alternatives is additive, not a replacement. Portfolio evolution, not revolution.

A Different Mindset Is Worth Considering

Successfully introducing alternatives into a portfolio is as much about mindset as it is about manager selection or asset allocation. The mindset question comes first.

A return-focused approach to investing, where the primary goal is maximising returns, beating a benchmark, or ranking well against peers, is a perfectly reasonable starting point for a traditional portfolio of equities and bonds. Returns are visible, measurable, and easy to communicate. There is nothing wrong with this orientation.

When it comes to including alternatives, a somewhat different way of thinking tends to be more useful. The investors who have most successfully built alternatives into their portfolios have generally approached the question from the perspective of risk and resilience first, with return as the outcome rather than the objective. The shift is subtle but it matters.

Rather than asking “how do we get more return?”, the question becomes “how do we build a portfolio that holds up well across a range of economic environments, and what role can alternatives play in that?” It is a different frame, and it opens up different possibilities.

This mindset is also consistent with maximising returns and ranking well against peers. Actually, it could be argued this mindset increases the probability of achieving these objectives.

This point is worth dwelling on, because it is subtle but important. Expected return is a single number, a central estimate of where a strategy might land on average. What an investor actually experiences, however, is just one outcome from a wide range of possibilities. A strategy with a higher expected return but a wide spread of potential outcomes may, in practice, have a lower probability of meeting a given return target than a strategy with a slightly lower expected return but a narrower spread.

Including alternatives can increase the probability of achieving an objective, even where the expected return of the portfolio is similar, or modestly lower. By reducing volatility around that expected return, alternatives can narrow the range of likely outcomes, which in turn lifts the probability of landing at or above whatever return is actually required. The goal shifts from maximising expected return to maximising the probability of achieving the return that is needed, a subtly different objective, but one that tends to align more closely with what investors are actually trying to do.

We will expand on this below, as alternatives have different roles to play in a well-diversified portfolio.

Anchoring to Goals and Outcomes Over the Cycle

This mindset shift is perhaps the most practical: moving from benchmark-relative thinking to goal-based thinking. Rather than measuring success against an index, the focus is on achieving clearly defined risk and return outcomes over the full market cycle. A market cycle is typically five to seven years.

The questions this raises are straightforward but important. What does the portfolio actually need to achieve? What income needs to be generated, and when? What level of drawdown is genuinely tolerable? What does success look like at the end of the investment horizon?

These questions are applicable for all investors, including KiwiSaver funds, those planning for retirement, charitable trusts, and ultra-high net worth individuals.

These different investors will have different answers. A charitable endowment might need to preserve real capital while distributing 4–5% per annum. A KiwiSaver member approaching retirement might prioritise avoiding a sharp drawdown in the final years before withdrawal. A family office might focus on inflation protection and multi-generational income. Each implies a different portfolio.

This longer-term, outcome-oriented framing is also what creates the right conditions for alternatives to be included. Once success is measured over a cycle rather than a quarter, the illiquidity of private markets becomes more of a feature than a constraint.

The investors who have thought carefully about their genuine liquidity needs, and found they can afford to look through short-term fluctuations, have generally been rewarded for it.

From Asset Allocation to Risk Allocation

A natural extension of this thinking is to consider not just how capital is allocated across asset classes, but how risk is allocated.

In a traditional 60/40 portfolio, roughly 90% of the portfolio’s volatility comes from equities, even though equities represent only 60% of the capital. The portfolio looks diversified on paper but is, in terms of risk, heavily concentrated. Making this visible is a useful exercise: it often motivates a genuine rethink of what diversification actually means in practice.

As I have written previously on this blog, true portfolio diversification does not come from investing in many different asset classes, it comes from investing in different risk factors. That is a foundation principle.

True diversification requires exposure to different risk factors. That is what alternatives, thoughtfully selected, can provide.

Designing for a Range of Environments

One of the most helpful ways to think about portfolio construction, and one that lends itself naturally to the inclusion of alternatives, is to design for uncertainty rather than optimise for a single forecast. Markets move in ways that surprise us. Economic conditions shift. What works well in one environment may struggle in another.

A useful starting point is to consider how a portfolio would perform across different economic conditions: periods of rising growth, falling growth, rising inflation, and falling inflation.

No single asset class does well in all four. Equities tend to thrive in rising growth and benign inflation. Bonds provide ballast in slowing growth and deflation. Real assets and inflation-linked securities come into their own when prices are rising.

A portfolio with some exposure across all of these environments is likely to be more resilient over time than one concentrated heavily in just one or two.

This way of thinking naturally leads to a broader set of portfolio building blocks, and alternatives, thoughtfully chosen, are part of that broader investment set.

Thinking About Downside, Not Just Upside

Another useful shift is to give more weight to downside protection. Returns compound, and losses interrupt compounding. A portfolio that falls 50% needs to gain 100% just to recover. Avoiding large drawdowns is not timidity; it is one of the more powerful tools available to long-term investors.

Thinking about the conditions under which a portfolio might suffer badly, and whether those risks have been adequately addressed, is a worthwhile complement to thinking about return potential. It does not mean avoiding risk. It means being deliberate about which risks are taken, and ensuring the portfolio is not unduly exposed to a single adverse scenario.

This framing also helps evaluate alternatives more clearly. A trend following strategy, for example, is often most useful not because it outperforms equities but because it tends to hold up, or even contribute positively, when equities are under stress. Evaluating alternatives on those terms, rather than purely against a return benchmark, tends to lead to better portfolio construction decisions.

A Framework for Thinking About Alternatives

Alternatives are not a monolith. Each category serves a different purpose within a portfolio, and understanding those purposes is critical to building a coherent strategy.

As Preqin have noted, investors’ motivations for investing in alternatives are quite distinctive. A useful way to think about this is through the lens of what each alternative brings to the table.

Private Equity — Access to companies and growth opportunities not available on public markets. The evidence for long-run outperformance over listed equities is well established, particularly among top-quartile managers. The trade-off is illiquidity and manager selection risk. Private equity rewards investors with long time horizons and the patience to stay the course.

Infrastructure (Unlisted) — Real, long-duration assets (e.g. toll roads, utilities, airports, renewable energy) that generate stable, predictable cash flows, often with inflation linkage. For portfolios with long-term income objectives, unlisted infrastructure is particularly compelling. It also tends to have lower correlation with listed markets, which is precisely the point.

Private Debt — Loans and credit instruments made outside the public bond markets. Private debt has grown substantially since the global financial crisis as banks retrenched from certain lending markets. It typically offers a meaningful yield premium over public credit in exchange for illiquidity, an attractive trade for investors who do not need immediate access to their capital.

Hedge Funds (and Alternative Risk Premia) — A broad category, but at their best, hedge fund strategies can provide genuine diversification: returns that are lowly correlated with both equities and bonds. Managed futures, global macro, and market-neutral strategies have historically performed well precisely when traditional portfolios have struggled. Not all hedge funds deliver on this promise. Manager selection and fee discipline matter enormously here.

The Attraction of Alternatives

Alternatives are generally added to portfolios for two primary reasons.

  • Enhance returns — for example, private equity and venture capital, where the objective is to access return premiums not available in public markets.
  • Diversification — for example, hedge funds and liquid alternatives, used to reduce portfolio declines at times of severe sharemarket falls.

Inflation hedging and yield enhancement are other reasons for allocating toward alternatives.

The motivations behind each allocation are quite distinctive. A Preqin survey of institutional investors found that investors’ reasons for holding different alternative asset classes vary considerably depending on the role each is expected to play in the portfolio. I covered this in more detail in Further growth expected for an Alternative future – Preqin.

The table below summarises the key findings.

Alternative Asset ClassPrimary Investor Motivations
Private Equity and Venture CapitalHigh absolute and risk-adjusted returns
Infrastructure and Real EstateAn inflation hedge and a reliable income stream
Private DebtHigh risk-adjusted returns and an income stream
Hedge FundsDiversification and low correlation with other asset classes
Natural ResourcesDiversification and low correlation with other asset classes
Insurance-Linked SecuritiesIncome and diversification

What stands out from this table is that no single alternative is being held for the same reason. Some are held for return enhancement, some for income, some for inflation protection, and some purely for diversification. This reinforces the broader point made: alternatives are not a single decision but a set of distinct building blocks, each chosen for a specific role within the overall portfolio.

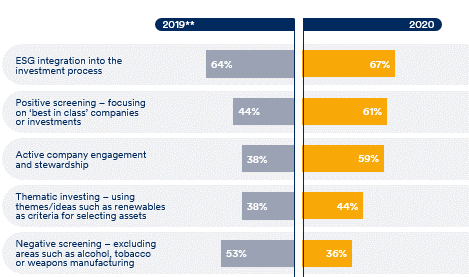
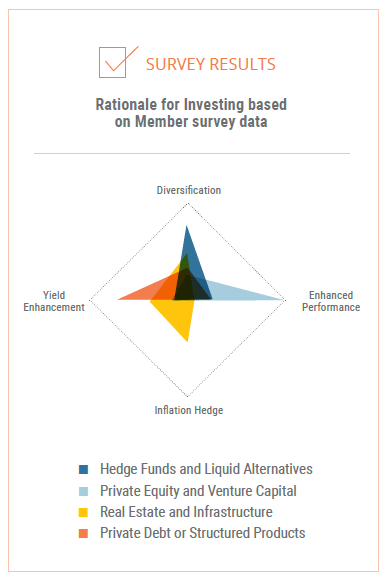
Consistent with the above commentary, the following graph presents the rationale for investing in alternatives based on the CAIA Members surveyed in 2020.

Practical Considerations: Liquidity, Fees, and Manager Selection

Moving into alternatives is not without complexity. Three issues deserve careful consideration.

Liquidity is the most important starting point. Before allocating to illiquid strategies, investors should rigorously assess their true liquidity needs, not their perceived needs, but their actual cash flow requirements over a 5–10 year horizon. Liquidity should be treated as a budget: deploy it wisely.

Fees in alternatives are higher than in traditional asset classes, and that is a legitimate consideration. But higher fees are not automatically a problem. What matters is the return after fees. A private equity fund that delivers 4–5% above public equity returns net of all costs is clearly worthwhile. Every alternative should be assessed on its after-fee contribution to the portfolio. For a more detailed discussion on fees and alternatives, please see my previous post Investment Fees and Investing like an Endowment – Part 2.

Manager selection matters far more in alternatives than in listed markets. The spread between top-quartile and bottom-quartile private equity managers, for example, is enormous, far greater than the equivalent spread in traditional asset classes. Gaining access to top-tier managers is both critical and, for many smaller investors, genuinely challenging. Although fund-of-funds structures, co-investment platforms, and specialist advisers can all play a role here, the layering of fees and risk exposures is important, e.g. the liquidity framework.

Where to Start

For investors new to alternatives, a phased approach is sensible. A reasonable starting point for a medium-to-long-term investor might include the following:

  • Set a target allocation of 10–15% as an initial ambition, with the intention to build over time as governance capability and manager relationships develop.
  • Start with the most accessible categories. Unlisted infrastructure, private equity, and private debt tend to be more straightforward entry points than hedge funds. They are also easier to explain to stakeholders.
  • Build governance capability first. Alternatives require more active oversight, deeper due diligence, and clearer investment policy frameworks than listed strategies.
  • Commit across vintages. Private markets operate on multi-year cycles. Spreading commitments across different vintage years reduces timing risk significantly.

Pulling It Together

The argument here is not that equities and bonds should be abandoned, far from it. They remain the foundation of a well-constructed portfolio.

The argument is that a portfolio composed only of equities and bonds is leaving risk-adjusted return potential on the table, and accepting a concentration of risk that long-term investors can afford to reduce.

The mindset shift comes first: from a focus on return to one of risk management and resilience, from benchmark-beating to goal achievement, from optimising for one environment to building a portfolio that can perform across many. The framework for alternatives follows naturally from that shift.

The world’s best long-term investors understood this a long time ago. The opportunity for New Zealand investors, whether managing KiwiSaver assets, endowment funds, or family wealth, is to apply the same thinking here. The evidence is clear. The framework exists.

Disclosure

Please read the Kiwi Investor Blog Disclosure Statement before relying on any information in this post. This blog is written for information and discussion purposes only. Nothing in this post constitutes financial advice. All investment strategies involve risk, including the loss of principal. Readers should seek independent financial advice before making any investment decisions. The views expressed in this post are my own and do not represent the views of my employer or any organisation with which I am affiliated.

Welcome Back — and Welcome

This Is What Kiwi Investor Blog Is About.

Ten essential posts. The ideas that define this blog. A guide for new readers and a reminder for those who have been here before.

After five years away, this post reintroduces Kiwi Investor Blog: what it is, what it is trying to do, and where to start if you are new. Rather than simply listing posts, it curates ten of the blog’s most read and enduring pieces and explains, for each one, why the idea matters, what it challenges, and what a thoughtful investor should take away from it. If you have been here before, think of this as a reset. If you are new, think of it as a guided introduction to a set of ideas that most mainstream New Zealand financial commentary does not cover.

What Kiwi Investor Blog is — and what it is trying to do

Kiwi Investor Blog started from a simple observation: there is a gap between how the world’s best institutional investors think about building and managing investment portfolios, and what is available to most New Zealand investors in the way of independent commentary, research, and analysis.

The large global pension funds, endowments, sovereign wealth funds and insurance companies that manage hundreds of billions of dollars collectively have access to world-class research, sophisticated portfolio construction frameworks, and decades of accumulated experience in areas that barely feature in mainstream New Zealand investment conversation.

This blog’s purpose is to close that gap. Not by dumbing ideas down, but by translating concepts, frameworks, and research that institutional investors use routinely and making them accessible, relevant, and practically useful for a wider New Zealand audience.

The topics that most NZ financial commentary doesn’t cover — and why they matter

Mainstream personal finance commentary in New Zealand is overwhelmingly focused on a narrow set of topics: KiwiSaver fund selection, property versus shares, mortgage strategy, and the basics of budgeting. These are all very worthwhile subjects and covered well. But they represent a small fraction of the investment landscape that a thoughtful investor needs to navigate.

Kiwi Investor Blog has, since its inception, focused on topics that are discussed in institutional investment circles but are largely absent from the broader NZ investment conversation:

  • Behavioural finance — the systematic ways in which investor psychology undermines investment outcomes, and how to design against it.
  • True diversification — what it actually means to hold a portfolio whose components behave differently from each other, and why most ‘diversified’ funds are less diversified than they appear.
  • Alternative investments — the role of hedge funds, private equity, real assets, and liquid alternatives in building more robust portfolios, and why New Zealand investors have historically had limited access to them.
  • Liability-driven investing — the framework used by insurance companies and some pension funds to match assets to income needs, applied to the challenges facing individual NZ investors approaching and in retirement.
  • The limitations of the balanced fund — why the standard 60/40 portfolio carries more risk than investors fully appreciate, and what more robust alternatives look like.
  • Fees and their compounding effect — why even small fee differences are large in the long run, and how to read an investment fee disclosure with clear eyes.

None of these topics is especially complex. But none of them gets the sustained, rigorous treatment in NZ financial media that they deserve. That is the gap this blog exists to fill.

Ten essential posts — a guided tour of the blog’s core ideas

The following posts are selected from the blog’s archive based on two criteria: enduring relevance (the ideas are as important today as when they were written) and distinctive value (the content covers ground that is not widely available elsewhere in the NZ investment commentary landscape). They are presented with a summary of the key argument and the single most important insight for a reader to take away.

Post 1  ·  BEHAVIOURAL FINANCE

1. The Benefits of Behavioural Finance in the Investment Planning Process

Why do smart, well-informed investors consistently make the same predictable mistakes? Behavioural finance is the field that answers that question by drawing on psychology and economics to explain why human beings are systematically poor at managing money, even when they know better. This post introduces the key concepts of loss aversion, overconfidence, herding, and recency bias and explains how awareness of these tendencies can be built into the investment planning process itself. It remains the most-read post in the blog’s history for good reason: the insights are universal, timeless, and directly actionable.

Key insight:  Knowing that markets are irrational is useless if your own behaviour is equally irrational. The goal of behavioural finance is not just to understand markets but to also understand yourself as an investor.

→  Read: The Benefits of Behavioural Finance

Post 2  ·  PORTFOLIO CONSTRUCTION

2. A Short History of Portfolio Diversification

Diversification is the only free lunch in investing. That phrase is used so often it has lost its meaning. This post traces the intellectual history of diversification from Harry Markowitz’s 1952 mean-variance framework through to modern multi-asset portfolio construction, explaining not just what diversification means but why it works, when it doesn’t, and what institutional investors have learned about it over seven decades of practice. It is a foundational piece for any serious investor.

Key insight:  True diversification is not about holding many assets. It is about holding assets whose returns are driven by genuinely different economic forces. A portfolio of 20 funds all exposed to the same equity risk premium is not diversified.

→  Read: A Short History of Portfolio Diversification

Post 3  ·  PORTFOLIO CONSTRUCTION

3. Disaggregation of Investment Returns

One of the most practically useful posts on the blog — and one of the most underappreciated. Most investors think of their portfolio return as a single number. This post explains how that return can be decomposed into its component parts: the market beta, the factor exposures, the manager skill (alpha), and the fees extracted at each layer. Understanding which part of your return is coming from where is the foundation of intelligent portfolio evaluation. It is a concept that institutional investors use routinely and that is almost entirely absent from retail investment commentary in New Zealand.

Key insight:  Before you can assess whether your investment manager is adding value, you need to understand what portion of their return you are already paying for through passive exposure and what, if anything, is left over after fees.

→  Read: Disaggregation of Investment Returns

Post 4  ·  PORTFOLIO CONSTRUCTION

4. The Traditional Diversified Fund Is Outdated — Greater Customisation Is Required

The one-size-fits-all balanced fund has been the default vehicle for New Zealand investors for decades. In most cases this suits investors well. This post makes the case for greater portfolio customisation to reflect the investor’s specific risk tolerances, time horizons, liability profiles, and income objectives. The argument draws on how large institutional investors such as pension funds, endowments, and sovereign wealth funds think about portfolio construction, and asks why individual investors are routinely offered something less sophisticated.

Key insight:  The institution managing a $10 billion pension fund does not use a balanced fund. It builds a portfolio around the specific liabilities it needs to meet. Sophisticated individual investors have specific financial goals too, and their portfolios should reflect them.

→  Read: The Traditional Diversified Fund Is Outdated

Post 5  ·  BEHAVIOURAL FINANCE

5. The Psychology of Portfolio Diversification

A companion piece to the behavioural finance post, focused specifically on how psychological biases affect the way investors think about and implement diversification. Home bias, the tendency to overweight familiar domestic assets, familiarity bias, mental accounting, and the illusion of diversification (holding many funds that are all highly correlated) are explored in detail. The post bridges theory and practice in a way that is immediately useful for investors reviewing their own portfolios.

Key insight:  New Zealand represents less than 0.2% of global equity market capitalisation. A portfolio that over-invested in NZ assets is not diversified; it is a concentrated bet on a single small economy.

→  Read: The Psychology of Portfolio Diversification

Post 6  ·  FEES & COSTS

6. Five Myths About Investment Management Fees — Broadening the Fee Debate

Fees are the single most controllable variable in long-term investment outcomes, yet they are consistently misunderstood, underestimated, and obscured by the investment industry. This post takes on five of the most persistent myths about investment management fees, including the idea that higher fees reflect higher quality, that fee differences of less than 1% are immaterial, and that all fees are disclosed in a way that allows meaningful comparison. It is a post that will save most readers money simply by changing how they read a fund disclosure document.

Key insight:  A fee difference of 0.5% per annum appears small. Over 30 years of compounding on a $200,000 portfolio, it is worth approximately $85,000 in foregone wealth. Fees compound in exactly the same way as returns, but in reverse.

→  Read: Five Myths About Investment Management Fees

Post 7  ·  RISK & PORTFOLIO THEORY

7. Understanding the Impact of Volatility on Your Portfolio

Volatility is the most widely cited measure of investment risk and one of the most widely misunderstood. This post explains not just what volatility means statistically, but why the path of returns matters as much as their average level, a concept with profound implications for retirement investors in particular. The mathematics of volatility drag, the asymmetry between gains and losses, and the practical consequences for portfolio construction are all covered in a way that builds genuine intuition rather than just presenting formulas.

Key insight:  A portfolio that falls 50% needs to rise 100% to recover. This asymmetry, not widely appreciated by investors, is why managing downside risk is not the same as being conservative. It is the foundation of intelligent risk management.

→  Read: Understanding the Impact of Volatility on Your Portfolio

Post 8  ·  PORTFOLIO CONSTRUCTION

8. Time to Move Away from the Balanced Portfolio — They Are Riskier Than You Think

Written before the events of 2022 made its argument unavoidable, this post explains why the traditional 60/40 balanced fund carries more risk than investors typically appreciate. The equity risk dominance of the balanced portfolio and the fact that in almost any significant market downturn, the balanced fund falls alongside equities is laid out clearly. The conditions under which bonds genuinely diversify equity risk are examined, along with the circumstances in which that diversification fails. Events since 2022 have provided a live demonstration of precisely the argument this post made.

Key insight:  In 49 of the last 50 years, when the US equity market fell, a 60/40 balanced portfolio also fell. The 40% in bonds has provided partial cushioning, but it has never been a genuine alternative to equity risk management.

→  Read: Time to Move Away from the Balanced Portfolio

Post 9  ·  BEHAVIOURAL FINANCE

9. The Regret-Proof Portfolio

One of the most distinctive posts on the blog and one that addresses a dimension of investing that almost no one in the industry discusses seriously. Regret is a powerful emotion in investment decision-making: the regret of having sold before a rally, of having stayed in a falling market, of having chosen the wrong fund. This post proposes a framework for thinking about portfolio construction that accounts for the investor’s own emotional responses not to indulge them, but to design a portfolio the investor can actually stick with through market cycles. A portfolio that is technically optimal but behaviourally unsustainable is not actually optimal.

Key insight:  The best investment strategy is not the one with the highest expected return. It is the one you will actually implement, hold through downturns, and not abandon at the worst possible moment. Regret minimisation is a legitimate and underused design principle.

→  Read: The Regret-Proof Portfolio

Post 10  ·  RETIREMENT INCOME

10. More on Liability Driven Investing (LDI) for Beginners

Liability-driven investing is the framework that the world’s largest insurance companies and pension funds use to manage the challenge of converting an asset pool into a reliable income stream. In New Zealand, it is almost entirely absent from the mainstream conversation about retirement planning. LDI is directly applicable to the situation facing every KiwiSaver member approaching retirement. This post introduces the core concept in plain English: rather than asking ‘how do I maximise returns?’, LDI asks ‘what income do I need, when do I need it, and how do I build a portfolio that reliably delivers it?’ It is the intellectual foundation for this blog’s approach to retirement income, and remains as relevant today as when it was written.

Key insight:  Every investor approaching retirement has liabilities: the income they will need each year to fund their lifestyle. LDI matches assets to those liabilities explicitly. It is not exotic or complex. It is simply asking the right question first.

→  Read: More on Liability Driven Investing for Beginners

Further posts are planned across the blog’s core topics of behavioural finance, portfolio construction, alternatives, and retirement income.

A note to returning readers

If you subscribed to this blog before 2021 and found your way back: thank you. A lot has happened in markets over the past five years that this blog warned about, and a lot has changed that is worth examining together. The core thesis of this blog has not changed: that institutional-quality thinking, made accessible and applied honestly to the NZ investment landscape, is genuinely valuable to all investors. If anything, the events of 2022–2026 have reinforced rather than undermined that view.

If you are new: welcome. Start anywhere on the list above. The posts are independent of each other and do not require prior knowledge of the blog. What they do require is a willingness to engage with investment ideas, to question conventional wisdom, to think in frameworks rather than rules of thumb, and to accept that good investment thinking is demanding but not inaccessible.

The gap between how institutional investors think about this and what most New Zealanders have access to is real. This blog’s aim is to narrow it, one post at a time.

Kiwi Investor Blog covers portfolio construction, behavioural finance, alternative investments, retirement income, and KiwiSaver from an independent, institutional perspective. It does not constitute financial advice.

Please read the Disclosure Statement on the blog before relying on any content. The views expressed are those of the author personally and do not represent the views of their employer or any organisation with which the author is affiliated.

Disclosure

Please read the Kiwi Investor Blog Disclosure Statement before relying on any information in this post. This blog is written for information and discussion purposes only and does not constitute financial advice. All investment strategies involve risk, including the loss of principal. Readers should seek independent financial advice tailored to their individual circumstances. The views expressed are those of the author personally and do not represent the views of their employer or any organisation with which the author is affiliated.

The 60/40 Portfolio Five Years On and What Has Changed?

Kiwi Investor Blog  ·  kiwiinvestorblog.com  ·  Revisiting the balanced portfolio, rising rates, and the bond-equity correlation regime we are now in.

Introduction

For most of the past two decades, holding both shares and bonds in a balanced portfolio provided a natural cushion: when shares fell, bonds typically rose. That cushion largely disappeared between 2022 and 2024. In this post, I revisit what happened, why it matters, and what a recent AQR article suggests investors should consider when thinking about portfolio positioning in the current environment.

After five years away — a return to the scene

It has been almost five years since my last post on Kiwi Investor Blog. A lot has changed, and, in some respects, a great deal has confirmed what many of us in the investment community were highlighting in 2020 and 2021, after a period of ultra-low interest rates.

Back then, the central argument of this blog was straightforward: the traditional 60/40 balanced portfolio was riskier than many investors appreciated.

The events of the past five years have provided a live test of those concerns.

What happened between 2022 and 2025: a brief recap

The period from early 2022 through to mid-2023 was one of the most challenging in decades for holders of traditional balanced portfolios:

  • Inflation surged globally, reaching multi-decade highs. The Reserve Bank of New Zealand raised the Official Cash Rate from a historic low of 0.25% in late 2021 to a peak of 5.50% by mid-2023.
  • Global bond markets suffered their worst losses in a generation on the back of sharply higher interest rates. As a result, the very asset class investors had long relied upon to cushion sharemarket falls was itself falling hard.
  • Sharemarkets also declined significantly in 2022. This meant both shares and bonds fell simultaneously. Unfortunately, the classic diversification benefit of the 60/40 portfolio simply did not materialise.
  • KiwiSaver balanced funds had a difficult 2022. Many New Zealand investors experienced meaningful negative returns in their retirement savings for the first time in years.
  • Markets recovered strongly in 2023 and 2024, led by a narrow group of US technology stocks. Bond returns remained subdued relative to historical norms.
  • Global sharemarkets performed strongly in 2025, again predominately led higher by a narrow range of large cap technology companies.

In short: the traditional balanced portfolio proved riskier than many investors had assumed, and bonds failed to play their expected defensive role when it mattered most.

A longer view: the negative stock-bond correlation was never the historical norm

Before turning to AQR’s recent research, it is worth pausing on an important piece of historical context that is often overlooked in discussions about portfolio construction.

The negative correlation between shares and bonds, the relationship that made the 60/40 portfolio so effective for two decades, has not been a permanent feature of financial markets.

As displayed in the graph below, the correlation between US shares and bonds turned negative following the 2000 dot-com sharemarket crash and has persisted for two decades because of falling interest rates, low and stable inflation, and repeated central bank intervention.

For most of the twentieth century prior to that shares and bonds moved together, not apart. A positive stock-bond correlation was the norm, not the exception.

Source: AQR

This matters enormously for how investors should think about the current environment. The question is not simply whether the correlation has changed but whether the conditions that produced the negative correlation regime are likely to return. And here the outlook is sobering.

The structural forces that drove four decades of falling interest rates and bond outperformance have largely reversed or are in the process of doing so. Geopolitical fragmentation, persistently high government debt levels across developed economies, and increased public spending on defence and infrastructure all point toward a structural environment of higher and less predictable inflation. Historically, these conditions have produced positive stock-bond correlations.

A return to the pre-2022 environment of reliably negative correlations would likely require either a significant market dislocation (a severe deflationary shock or financial crisis) or a fundamental reversal of these structural trends. Neither appears likely in the near term.

This is not a reason for despair. But it is a reason to think carefully about portfolio construction in a way that does not simply assume the conditions of 2000–2020 will reassert themselves.

For the avoidance of doubt, bonds remain a critical allocation within a well-diversified portfolio, particularly during periods of economic or market stress when equities can fall sharply. Their value lies not in delivering constant high returns but in reducing drawdowns, providing liquidity, and reducing volatility when risk assets are under pressure.

The real question is not whether bonds still matter but how to size the allocation and what additional diversifiers can be added to a portfolio to strengthen resilience across different economic and market environments.

AQR’s timely new research: what the data says

Against this backdrop, an article published on 8 April 2026 by AQR Capital Management is essential reading for anyone thinking seriously about portfolio construction. The article is titled “A Positive Stock-Bond Correlation Is a Terrible Reason to Add More Equity Risk to Your Portfolio”.

AQR observe that the share-bond correlation turned positive a few years ago, and that this shift has prompted a wave of industry advice about what investors should do in response. The chain of logic being presented to investors runs roughly as follows: bonds are now positively correlated with shares; they can therefore no longer diversify a portfolio; and so investors should sell bonds and replace them with something else. That “something else” has included private credit, buffer funds, and in some cases, even cryptocurrency.

AQR’s response to this reasoning is direct: the proposed alternatives typically carry significantly more shares-like risk than the bonds they are replacing. Far from improving diversification, AQR argue investors following this advice often end up with portfolios more exposed to sharemarket risk than before.

The data AQR present is striking. Over the five years to February 2026, government bonds carried an equity (shares) beta of approximately 0.2 (meaning for every dollar in bonds, investors received roughly 20 cents of equity market exposure). Private credit (proxied by listed Business Development Companies) carried a beta of 0.7,more than three times that of bonds. Buffer funds came in at 0.6. Bitcoin at 2.1. In each case, the proposed “bond replacement” carried substantially more equity risk than the asset it was meant to replace.

AQR also make a broader and equally important point. The 60/40 portfolio has always been dominated by equity risk. A good or bad year for shares has almost always determined whether it was a good or bad year for a diversified portfolio, regardless of what bonds were doing. The current environment has not created a new diversification problem. It has made an existing and longstanding one more visible.

On the future path of the correlation, AQR’s view is consistent with the structural analysis above. Where inflation uncertainty is the dominant macro driver, as both inflation news and growth news can move shares and bonds in the same direction when inflation is the primary concern (see AQR article below), the correlation is likely to remain positive. Only a genuine stabilisation of inflation expectations, or a large market dislocation that reactivates the traditional flight-to-quality dynamic in bond markets, would be expected to restore a reliably negative correlation. AQR note that recent geopolitical developments and the pressures on central bank independence make such a stabilisation uncertain.

What AQR’s research points toward

It is useful to summarise what AQR’s analysis suggests investors and their advisers should be thinking about.

The core conclusion is that the search for genuine diversification is not new, and should not be distorted by the recent correlation shift. The goal has always been to identify return streams that are structurally uncorrelated with equity market risk. AQR point to strategies that have demonstrated this quality in practice during the positive correlation period, including trend-following strategies (managed futures), which have a long track record of performing well during sustained equity drawdowns, and equity market neutral strategies, which seek returns from stock selection while neutralising broad market exposure.

What AQR argue firmly against is the substitution of bonds with assets that are simply equity risk in a different packaging. Private credit, structured products with equity-linked payoffs, and cryptocurrency all carry equity-like risk regardless of how they are labelled or marketed. Calling a strategy “private” or “defined outcome” does not change its underlying economic character.

For deeper reading: what drives the stock-bond correlation?

Readers who want to go further into the mechanics of why the stock-bond correlation changes over time will find an earlier AQR paper particularly valuable. Published in the Journal of Portfolio Management (March 2023), “A Changing Stock–Bond Correlation: Drivers and Implications” by Brixton, Brooks, Hecht, Ilmanen, Maloney, and McQuinn provides a rigorous macroeconomic framework for understanding what determines whether shares and bonds move together or apart.

The paper’s central insight is that the stock-bond correlation is not primarily driven by the level of inflation, but by the relative importance of inflation uncertainty versus growth uncertainty, and the relationship between the two. The key findings are as follows.

Opposite sensitivities to growth, similar sensitivities to inflation. Equities benefit from positive growth news while bonds suffer, so growth shocks push them in opposite directions. Inflation shocks, by contrast, hurt both asset classes, pushing them in the same direction.

What matters is the relative volatility of growth and inflation news. When growth uncertainty dominates, as it did during most of the 2000s and 2010s, the stock-bond correlation tends to be negative, meaning bonds provide genuine diversification. When inflation uncertainty dominates, as it did in the 1970s, 1980s, and 1990s, and again more recently, the correlation tends to be positive.

Alternatives can fill the diversification gap. The paper shows that if sustained inflation uncertainty drives the stock-bond correlation higher, investors can compensate by raising allocations to assets with structurally different return drivers. These assets include commodities (which benefit from inflation shocks rather than being hurt by them), trend-following strategies, and market-neutral approaches. This conclusion is directly consistent with the more recent AQR research discussed above.

The paper is freely available on the AQR website. For those wanting to understand the theoretical underpinnings of the correlation shift we are living through, it remains one of the clearest and most practically grounded treatments of the subject available: A Changing Stock–Bond Correlation: Drivers and Implications (AQR, 2023)

The bottom line

The April 2026 AQR article is a pointed rebuke of an investment industry that, in their view, is using a real and legitimate shift in the correlation regime as cover to sell products that simply add more equity risk under a different name. The core message is that the right response to a world where bonds diversify less effectively is not to add assets that diversify even less. As always, the objective is to find strategies with structurally different return drivers.

That conclusion aligns with the portfolio construction themes this blog has explored over the years, and it will continue to inform the analysis here going forward.

The era of reliably negative stock-bond correlations was the exception, not the rule.

Investors who plan for it to return may be waiting a long time. Those who build portfolios capable of navigating a wider range of market and economic environments are better placed for what lies ahead.

As always, I welcome comments, feedback, and questions from readers.

For further reading on these themes, please see earlier Kiwi Investor Blog posts on the role of alternatives in a robust portfolio, goal-based investing, and the limitations of the traditional balanced fund. The AQR article referenced in this post ‘A Positive Stock-Bond Correlation Is a Terrible Reason to Add More Equity Risk to Your Portfolio’ (April 8, 2026) is freely available at aqr.com. Readers are encouraged to read it in full

Disclosure

Please read the Kiwi Investor Blog Disclosure Statement before relying on any information in this post. This blog is written for information and discussion purposes only. Nothing in this post constitutes financial advice. All investment strategies involve risk, including the loss of principal. Readers should seek independent financial advice before making any investment decisions. The views expressed in this post are my own and do not represent the views of my employer or any organisation with which I am affiliated.

Generating stable and sustainable investment income

I would like to share this blog post by AMP Capital New Zealand, Four pillars for generating income | AMP Capital, which looks at the four main pillars of an investment framework to deliver a stable and sustainable level of income over time.

The Post challenges some of the conventional wisdoms underpinning the management of traditional portfolios.

The basis of the framework is a goal orientated investment approach.

For those wishing to understand more around Goal Based Investing, this Wikipedia page, which I have contributed to, Goal-based investing may be of interest. The Wikipedia page includes:

  • A description of Goal Based Investing (GBI)
  • A comparison of GBI to traditional portfolio theory
  • History and development of GBI
  • GBI in principle
  • GBI for the retirement problem

Pease read my Disclosure Statement


Global Investment Ideas from New Zealand. Building more Robust Investment Portfolios.

Five Myths of About Investment Management Fees – Broadening the Fee Debate

We need to change the conversation on investment management fees.  The debate on fees needs to be based on facts rather than myths. Despite often being framed in this way, the debate on investment management fees is not black versus white.

What matters is not the fee level, but the manager’s ability to deliver a satisfactory outcome to investors after fees. Either way, it is no good paying high fees or the lowest possible fees if your investment objectives have not been achieved. Therefore, amongst the key questions to ask are, are you satisfied with the investment outcomes after the fees you have paid? – have your investment objectives or retirement goals been achieved?

After fee returns are important.  Therefore, higher fee investment strategies should not necessarily be avoided if they can assist in meeting your investment objectives. In the current investment environment, the use of higher fee investment strategies may be necessary to achieve your investment objectives.

Therefore, Investors should focus on given the investment outcomes have I minimised the fees paid. 

In my mind, this would be consistent with the FMA’s value for money focus. (FMA is New Zealand’s Regulatory)

At the same time, fees should not be the overriding concern and investors must analyse fees in the overall context of managing their portfolios appropriately.

Investment management fee Myths

The 5 most common myths about investment management fees are:

  1. Fees should be as low as possible
  2. Incentive fees are always better than fixed fees
  3. High water marks always help investors
  4. Hedge Funds are where the alpha is.  They deserve their high fees
  5. You can always separate alpha from beta, and pay appropriate fees for each

This paper, Five Myths About Fees, address the above myths in detail.

Although all the myths are important, the myth that fees should be as low as possible probably resonates most with investors.

Investment management fees for active management are higher than index management and involve a wealth transfer from the investor to the investment manager.  This is a fact.

However, the paper is clear, investors should look to maximise excess returns (they term alpha) after fees.  Another way of looking at this, for a given level of excess returns, fees should be minimised.  This is an important concept when considering the discussion below around broadening the discussion on fees.

The paper also notes, investors should pay higher fees to those managers that are more consistent.  For example, if two managers provide the same level of excess return, but one does so by taking less risk, investors should pay higher fees to this manager (the manager who achieves the same excess return but with lower risk – technically speaking, this is the manager with the higher information ratio).

In summary, the take-outs on the myth fees should be as low as possible:

  • Fees must remain below expected excess returns e.g., a manager that charges active fees but only delivers enhanced index returns should be avoided.
  • Managers who consistently add value warrant higher fees.

In relation to do managers add value, see this Post, Challenging the Conventional Wisdom of Active Management.

The paper on the five fee myths is wide ranging.  It also provides insights into the key elements of the fee negotiation game and determining the conditions under which higher fees should be paid.

Key conclusions from the article, particularly after addressing Myth 4 & 5:

  • most investment strategies offer a combination of cheaply accessible market index returns (beta) and active management excess returns (alpha).  While many institutional investors look to separate beta and alpha for most investors this is too limiting and difficult.  Many talented investment managers appear in investment strategies which include both beta and excess returns (alpha).
  • Investors should consider fees before deciding on an investment strategy, not look at an investment strategy and then consider fees.
  • At the same time, fees should not be the overriding concern.
  • High fee investment strategies are worthwhile if they deliver sufficient return and lower risk.
  • Investors must analyse fees in the overall context of managing their portfolios appropriately.

A framework for Changing the discussion on fees

Despite it often framed this way, the debate on fees is not black versus white.

From this respective, understanding the disaggregation of investment returns can help in broaden the debate on fees and also help determine the appropriateness of fees being paid. 

From a broad view, investment returns can be disaggregated in to the following three parts:

  1. Market beta. Think equity market exposures to the NZX50 or S&P 500 indices (New Zealand and America equity market exposures respectively).  Market Index funds provide market beta returns i.e. they track the returns of the market e.g. S&P 500 and NZX50. Beta is cheap, as low as 0.01% for large institutional investors.
  • Factor betas and Alternative hedge fund beta exposures.  Of the sources of investment returns these are a little more ambiguous and contentious than the others.  This mainly arises from use of terminology and the number of investable factors that are rewarding.  My take is as follows, Factor betas and Alternative hedge fund beta fit between market betas (above) and alpha (explained below).
    • Factor Beta exposures.  These are the factor exposures for which I think there are a limited number.  The common factors include value, momentum, low volatility, size, quality/profitability, carry.  They are often referred to as Smart beta.
    • Alternative hedge fund betas.  Many hedge fund returns are sourced from well understood investment strategies.  Therefore, a large proportion of hedge fund returns can be explained by common hedge fund risk exposures, also known as hedge fund beta or alternative risk premia or risk premia.  Systematic, or rule based, investment strategies can be developed to capture a large portion of hedge fund returns that can be attributed to a hedge fund strategy (risk premia) e.g. long/short equity, managed futures, global macro, and arbitrage hedge fund strategies.  The alternative hedge fund betas do not capture the full hedge fund returns as a portion can be attributed to manager skill, which is not beta and more easily accessible, it is alpha.
  • Alpha is what is left after all the betas.  It is manager skill.  Alpha is a risk adjusted measure. In this regard, a manager outperforming an index is not necessarily generating alpha.  The manager may have taken more risk than the index to generate the excess returns and/or they may have an exposure to one of the factor betas or hedge fund betas which could have been captured more cheaply to generate the excess return.  In short, what is often claimed as alpha is often explained by a factor or alternative hedge fund beta outlined above.  Albeit, there are some managers than can deliver true alpha.  Nevertheless, it is rare.

These broad sources of return are captured in the diagram below, provided in a hedge fund industry study produced by the AIMA (Alternative Investment Management Association).

The disaggregation of return framework is useful for a couple of important investment considerations.  We can use this framework to determine:

  1. Appropriateness of the fees paid. Obviously for market beta low fees are paid e.g. index fund fees.  Fees increase for the factor betas and then again for the alternative hedge fund betas.  Lastly, higher fees are paid to obtain alpha, which is the hardest to produce.
  2. If a manager is adding value – this was touched on above. Can a manager’s outperformance, “alpha”, be explained by “beta” exposures, or is it truly unique and can be put down to manager skill.

The consideration of this framework is consistent with the observations from the article above covering the 5 myths of Investment Management Fees.

Lastly, personally I think a well-diversified portfolio would include an exposure to all of the return sources outlined above, at the very least.

Many institutional investors understand that true portfolio diversification does not come from investing in many different asset classes but comes from investing in different risk factors. See More Asset Classes Does not Equal More Diversification.

From this perspective, the objective is to implement a portfolio with exposures to a broad set of different return and risk outcomes.

Please read my Disclosure Statement

For Outsourced Chief Investment Officer (OCIO) and investment consulting services please see here.


Global Investment Ideas from New Zealand. Building more Robust Investment Portfolios.

Active Engagement, Stewardship, and Taxonomy key Responsible Investing Issues

Active engagement and stewardship have leapt in importance as a way for asset managers to drive sustainable change. This is a key conclusion of a study undertaken by Schroders in 2020. 

Schroders conclude “The results suggest that engagement and voting are now increasingly being viewed as an important aspect of achieving change, rather than simply divesting.”

Their study found that nearly 60% of “institutions said active company engagement and stewardship was a key approach to integrating sustainability.” This is a significant rise on 38% a year ago.

The survey also highlighted:

  • ESG Integration into the investment process and positive screening (focusing on the best in class companies) are the top two important drivers for asset managers to drive sustainable change;
  • Positive screening has also grown sharply in importance, from 44% of survey respondence to 61%; and
  • Conversely Negative Screening has fallen in importance (53% to 36%).
Source: Schroders

Investors noted signs of successful engagement included:

  • Transparent reporting;
  • Tangible outcomes; and
  • Consistently voting against companies in order to drive change.

Greenwashing, poor data, and increased Regulation

Greenwashing, as described by Schroders “‘a lack of clear, agreed sustainable investment definitions’” was seen as the most significant obstacle to investor’s sustainable investment intentions.  60% of those surveyed found green-washing as one of the most significant obstacles impeding their sustainable investing intentions.

The lack of transparency and reported data was also raised as an issue restricting the ability to invest sustainably.

Both measures increased in importance on last year, while performance concerns continued to decline.  45% of investors cited performance as concern in relation to investing sustainably.

Source: Schroders

These results were recently picked up in an Alternative Investment Management Association (AIMA) article, which focused on the increased integration of ESG into Hedge Fund’s investment processes.  Hedge funds start integrating ESG (aima.org).

In relation to green-washing, AIMA notes that regulators are also concerned about green-washing, noting the introduction of the Sustainable Finance Disclosure Regulation (SFDR) rule in the European Union.  The SFDR came into effect on March 10 of this year, aimed at ensuring financial firms such as fund managers, insurers, and banks providing financial products and services comprehensively disclose just how committed to sustainability they truly are.

The AIMA notes “The EU rules will also create a taxonomy as regulators look to facilitate greater consistency in terms of what can be classified as being a sustainable economic activity.”

The AIMA also noted more global investors are now prioritising ESG, and it is something which hedge funds need to respond to.  Although they felt the US was behind the rest of the world, particularly Europe (I would add Australian and New Zealand as well), this was changing.

By way of example, the AIMA article highlighted “that several high profile US institutions – including the likes of CALPERS and Wespath – have signed up to the UN-backed Net Zero Asset Owner Alliance, a consortium comprised of 30 of the world’s largest investors – all of whom have committed to reduce carbon emissions linked to the companies they invest in by 29% within the next four years.”

Failure to transition towards net zero is widely seen as a important risk management issue for companies. Arguably, companies failing to adapt or transition towards net zero will see their businesses and valuations suffer.

Lastly, AIMA highlighted the concerns over the quality of ESG data being disclosed by managers to their investors.

“One of the primary problems is that there are no harmonised ESG data standards. Instead, there are many different ESG standards and protocols, all of which have their own characteristics. With different managers subscribing to different ESG standards, the reports they produce for clients are often inconsistent and even contradictory. Similarly, ratings agencies will often have their own bespoke methods of collecting data from companies they are scoring. ……… Without a common data collection methodology, the ratings agencies’ scoring processes will be fragmented.”

Key Engagement Issues

The survey by Schroders found environmental issues remained the most important engagement issue for investors.

In total, 68% of investors globally said they expected investing sustainably to grow in importance over the next five years.

“Driving this focus were institutions looking to align their investments with their own corporate values, responding to regulatory and industry pressure, and, positively, the belief that investing sustainably can drive higher returns and lower risk.”

The Schroder study included 650 institutional investors encompassing $25.9 trillion in assets.

Please read my Disclosure Statement

For Outsourced Chief Investment Officer (OCIO) and investment consulting services please see here.

Global Investment Ideas from New Zealand. Building more Robust Investment Portfolios.

Monthly Financial Markets Commentary and Performance – March 2021

Global Economic Risk

  • The greatest risk to the global economy is that economic activity surprises on the upside in 2021.
  • Currently consensus forecasts are for the global economy to grow 5.8% in 2021, lead higher by the US 5.7%, China 8.5%, and India 9.4%.
  • Global economic consensus forecasts are likely to move higher as the year progresses, reflecting:
    • economic activity surprises on the upside post COVID-19 vaccination reopening,
    • which will be supported by very low interest rates and the expected continuation of accommodative policy by central banks for some time to come, and
    • the very large government spending packages being rolled out. For example, the recently proposed $2.2 trillion spending package on infrastructure and other benefits over the next 10 years by President Biden in the USA, this is addition to $1.9tn spending stimulus he announced earlier in the year (American Rescue Plan).
  • The size of the US government spending program is huge, $5 trillion in measures have been announced since March 2020, over 80% of this will be “spent” by the end of 2021. This does raise economic risks for the future and $2 trillion in tax increases is being planned.

Concerns over inflation overdone……………for the time being.

  • Global interest rates have moved higher over the first three months of 2021 due to optimism over the rollout of the COVID-19 vaccine, better than expected economic data, the highest level of US government spending outside of war times, and the US Federal Reserves’ commitment to maintaining easy policy settings until higher inflation is sustainable.
  • Arguably interest rates have risen on a growth scare, rather than an inflation scare.
  • For the time being inflation is not a major issue and is probably not likely to be so for some time given “under-employment” (spare capacity) within the US, and global, economy.
  • Inflation in the US is expected to spike in the months ahead, this will reflect base effects from the shock to measures of inflation 12 months ago.
  • Albeit the risks to inflation are rising and higher inflation is likely to be an issue by the middle of the current decade, resulting in central banks raising interest rates.
    • From a portfolio construction perspective, investors with a longer-term view should reduce portfolio duration and start considering the allocation to inflation linked bonds and real assets (such as property and infrastructure).
  • Either way, the outlook for fixed income is not encouraging in either the short or longer term, and particularly relative to returns experienced over the last 10-20 years.
  • In the US, the 10-year government bond yield recently reached its highest level since January 2020, trading at 1.77%, this compares to 0.62% a year ago and a low of 0.55% in August of 2020.
  • In New Zealand, the 10-year Government Bond yield finished March 2021 at 1.76%, the highest month end level since May 2019, and over 1% higher than the May 2020 low of 0.6%.

US 10-Year Government Bond Yield

Source: CNBC

Vaccine and Economic Data

  • By the end of the first Quarter of 2021 61% of the population had received their first vaccine shot in Israel, this compares to 46% in the UK, 30% in the US and 12.6% across Europe.
  • The daily pace of new doses administered is approximately 1.5m in the European Union, 2.8m in the US, and 0.5m in the UK.
  • Economic data has surprised on the upside, particularly in the US where the reopening of the economy is accelerating economic activity:
    • The number employed in the US grew by 916k in March, well above consensus forecasts. The unemployment rate dropped to 6.0%, from 6.2%, with an increase in the participation rate restricting a larger decline in the unemployment rate.
    • US Consumer confidence also increased by a much larger amount in March than anticipated.
    • Expectations for US manufacturing activity increased by more than expected and reached the highest level since 1983.
    • A measure for US services sector activity also exceeded expectations.
    • Likewise, measures of economic activity in the Euro Zone and China have recorded stronger than expected numbers.
    • European measures of expected manufacturing activity are at all-time highs.
    • China’s industrial profits have grown by 179% from last year, reflecting the low base of 2020 but also the very strong increase in revenues and profits over the last 12 months.
  • While China is further advanced in its economic recovery, Europe lags both China and the US, nevertheless, the ongoing vaccine roll out and an increase in government spending should see the Euro Zone’s economy strengthen over the second half of 2021.
  • The US Federal Reserve (Fed), unsurprisingly, has upgraded their economic forecasts significantly reflecting the above factors, specifically larger than expected government spending and the improving public health situation.
  • The Fed also see inflation temporarily rising above 2% in the near term and then to settle to around 2% until 2023, they see the risks to inflation as balanced.

Market Performance

  • The above environment has been good for global equity markets, but not so good for global fixed income markets.
  • Base effects are also impacting Global Equity Market returns, as highlighted in the Table below.
  • As can be seen, global equities have returned nearly 50% over the last year, in part reflecting markets reached their lows in March 2020 amidst the global COVID-19 pandemic.
MSCI ACWI MSCI EM
12 Months 48.7%53.0%
6 Months18.6%20.6%
3 Months5.5%4.0%
1 Month3.3%-0.9%
Source MSCI

  • The strength of the rebound since last year is very evident in the following graph.
Source: MSCI
  • Emerging markets have outperformed developed markets over the last year despite underperforming over the first quarter of 2021.
  • Over the first three months of 2021, European markets climbed 8.7%, the US 5.8%, Australia +4.3% and New Zealand fell 4.0%.
  • In the fixed income markets, the NZ Government Bond Index fell 3.2% for the March Quarter, Aussie fixed income declined 3.5%. Smaller declines were experience in global fixed income.
  • As a general trend, value continued to outperform momentum and the financial and energy sectors did well. The Real Estate and Utilities sectors tended to lag the broader market.
  • The US dollar has been stronger relative to most currencies recently, reflecting firmer US economic growth and rising bond yields.
  • Commodity prices have also been strong, the Dow Jones Commodity Index return 8.4% over the first three months of 2021.

Please read my Disclosure Statement

Global Investment Ideas from New Zealand. Building more Robust Investment Portfolios.

KiwiSaver Balance Fund’s Strategic Asset Allocation (SAA) Analysis

A review of KiwiSaver Balanced Funds, which are soon to become the Default Option, highlights:

  • A heavy reliance on equities to drive return outcomes – there are few return engines outside of equities.
  • Limited portfolio diversification – likely resulting in higher levels of portfolio volatility across a full market cycle (which could be dampened down for the benefit of investors).
  • A high allocation to Fixed Income – which is a concern in the current market environment.

By comparison, Australian Super Funds with similar return objectives to a KiwiSaver Balance Fund have lower allocations to equities despite having higher “growth” asset allocations.  They achieve this by having higher weightings to alternative investment strategies such as Private Equity, Direct Property, Unlisted Infrastructure, Commodities, and Diversified Multi-asset Funds.

Consequently, the Australian Super Funds have lower weights to fixed income relative to their Kiwi peers. There are some nuances amongst asset class allocations of the KiwiSaver Balance Funds, these are similar to those identified from the KiwiSaver Conservative Fund analysis

I think it is fair to say that New Zealand KiwiSaver Funds need greater levels of diversification. 

Often liquidity is sighted as a reason for not investing into alternative investment strategies, to this point:

  • Portfolios often overestimate the level of liquidity they require (see here); and 
  • There are ways of increasing portfolio diversification with more liquid investment options.

Fees may also be playing a part.  Let us hope not, particularly in considering the best outcomes for customers.

The high allocation to fixed income is also a concern, particularly at this juncture in the economic and market cycles. 

Fixed Income was recently described as a “slow moving train wreck” at a recent industry event in New Zealand, Heathcote Investment Partners’ Meet the Manager series, see Toot, toot: what to do when bonds go off the rails | Investment News NZ

The traditional roles of Fixed Income are likely to be challenged in the years ahead:

  • Returns are highly likely to be lower than those delivered from fixed income over the last 10-20 years; and
  • The risk mitigation characteristics of fixed income are also likely to be lower in the years ahead.

Purely from a risk management perspective, Kiwi investors should be looking to increase the genuine level of diversification within their portfolios – by lessening the role of equities and exploring investment options to substitute/complement fixed income allocations.

Personally, I am not convinced of moving the KiwiSaver Default Fund to a Balanced Fund option is the right solution.  My views can be found here.  It is clearly ridiculous to have a 20- and 55-year-old Default KiwiSaver investor in the same investment strategy. 

My preference would be for Target Date / Life Cycle / Life Stage type funds as the Default Options – these align more with the financial planning theory.  The criticism of these type of Funds is often incorrectly positioned, I provide a defense of Target Date Funds here.

Analysis of KiwiSaver Balanced Funds

The Table below provides average, min, and max allocations of the Strategic Asset Allocations (SSA) for 12 KiwiSaver providers, sourced from their latest Statements of Investment Policy and Objectives (SIPO). 

Most of these managers are currently Default KiwiSaver Providers.

Income Allocations
 CashNZ
Fixed Income
International
Bonds
Income
Allocations
Averages5.2%12.8%23.7%41.6%
Min1.0%6.0%18.0%39.0%
Max10.0%16.5%28.0%50.0%
Median4.5%14.0%25.3%40.0%
Growth Allocations
 NZ EquitiesInternational
Equities
Other
Equities
  AlternativesGrowth
Allocations
Averages19.1%32.8%5.0%3.2%58.4%
Min11.5%26.0%0.0%0.0%50.0%
Max29.0%40.0%8.0%6.0%61.0%
Median20.0%32.0%5.5%4.0%60.0%

Income Assets

From a top level, the managers are tightly grouped around 40% allocation to Income assets (Cash, NZ Fixed Income and International Bonds). 

A KiwiSaver Balanced Fund is very much the traditional 60/40 portfolio (60% Equities / 40% Fixed Income).

There is one Manager that is an outliner, a truly “Balanced” Fund of 50% Equities and 50% Fixed Income.  There is significant peer risk here and with no published return objective it is not possible to assess the appropriateness of its SAA.  Albeit they will likely be the best performing manager when global sharemarkets fall sharply.  However, over the longer term they are likely to struggle in keeping up with peers.

Within Income Assets

The variation within the Income Assets is consistent with analysis undertaken on the KiwiSaver Conservative Funds, see analysis here, which also includes a review of the risk drivers within Fixed Income, particularly likely variation in duration exposure. 

Growth assets

As would be expected, the Growth Allocation is reasonably tight around 40%, the flip side of the Income Allocation.

Listed equities, including New Zealand equities, international equities, and listed property and infrastructure dominate the growth allocations i.e. there are very little investments into Alternatives. See Tables below.

Of interest, on average Domestic Equities (New Zealand and Australia) make up around 36% of the core equities allocations within the KiwiSaver Funds e.g. domestic and international listed equities ex listed property and infrastructure combined.

Overall, core equities make up 52% of a Fund on average.  This is by far the dominant risk within these portfolios.  On a risk basis, the equities allocations contribute to over 90% of the risks within a “Balanced” portfolio.

Ratio of
Domestic Equities
Core
Listed Equities
Averages36.4%51.9%
Min26.0%42.0%
Max52.7%60.0%
Median35.4%51.8%

The remaining growth allocations are predominately made up of listed Property and listed Infrastructure, with smaller allocations to alternatives.  Direct Property dominates the alternative allocations, with smaller allocations to private equity and more liquid hedge fund type strategies.

Total Listed Equities
Allocation
Alternatives AllocationAlternatives share of
Growth Assets
Averages56.8%3.2%2.7%
Min50.0%0.0%0.0%
Max61.0%6.0%10.0%
Median56.0%4.0%0.0%

Below is the same Data for a broad selection of Australian “Balanced” Funds.

Ratio of
Domestic Equities
Core
Listed Equities
Averages39.8%48.5%
Min0.0%30.0%
Max51.0%62.0%
Median42.6%50.0%
Total Listed Equities
Allocation
Alternatives AllocationAlternatives share of
Growth Assets
Averages52.3%27.2%33.4%
Min30.0%8.0%9.5%
Max76.0%53.0%63.9%
Median50.0%25.0%33.3%

Australian “Balanced” Funds have an 80% allocation to Growth assets but a lower allocation to Core Equities (Australian and International Equities) than their New Zealand counterparts, 48.5% versus 51.9% on average for the Kiwi Funds.

This reflects that the Australian Funds have a higher allocation to Alternatives, which includes investment into Private Equity, Direct Property, Infrastructure, Commodities, and Diversified Multi-asset Funds.

Diversified Multi-Asset Funds

It should be noted that Diversified Multi-Asset Funds can have high allocations to listed equities, therefore some funds have a higher allocation to equities than appears based on sector allocations alone.

Diversified Multi-Asset funds offer “genuine diversification” relative to a traditional balanced fund and are more actively managed.  In addition to investing in the traditional asset classes of equities and fixed income, they also invest into an array of alternative assets, often in more specialised areas and situations.  These Funds seek breadth and depth across asset classes seeking to allocate to different return engines e.g. specialist areas of the health care industry, housing within property, renewable energy, and specialised credit opportunities.

Diversified Multi-Asset Funds offer an authentic option to increase diversification within a traditional portfolio, particularly for those investors who have constraints in relation to fees and liquidity. 

There are several well-resourced managers in Australia with long histories of adding value with these types of funds.

Is it Apples vs Apples?

There is a wide variation in the Growth/Income split between New Zealand and Australian “Balanced” Funds.

Across both risk categories of Conservative and Balanced Funds, although the Australian Funds have higher Growth allocations than the Kiwi Funds, they have a slightly lower allocation to equities.

The difference is a lower allocation to fixed income and a higher alternative allocation in Australia.  The portfolios are more diversified in Australia, this allows them to have a “higher” growth allocation.  They are also most likely better positioned for the years ahead given the current stage in the economic and fixed income market cycles.

Although there is a degree of uniformity amongst the Kiwi Funds, you cannot choose a Fund by its name alone.

A review of the return objectives for both the New Zealand and Australian reveals:

  • The Australian Funds have return objective of CPI + 3% on average, they range from 2.5% to 4%.
  • The New Zealand Funds by and large fail to publish return objectives, those that do range from 2.5% – 3%.

This indicates that the universe of Funds is not too dissimilar from a return objective perspective, and the analysis above provides some real insights for consideration and to ask why the difference?

Personally, I think all managers should publish their return objectives in a CPI+ format.  This is a valuable piece of information for the informed investor along with a Fund’s proposed risk category. 

Please read my Disclosure Statement


Global Investment Ideas from New Zealand. Building more Robust Investment Portfolios.

Interest rate strategies for a low and rising interest rate environment

There are several options available for investors who are relying on fixed income investments to generate income in the current extremely challenging environment – characterised by low short-term rates and rising longer-term interest rates.

Short-term fixed income funds and private debt funds are two examples.  Both seek to deliver a healthy return above cash and term deposits.  They achieve this in a variety of ways, chiefly by gaining exposure to different investment risks.

In addition, active management is an important source of return from short-tern fixed income funds.  And exposure to the illiquidity premium is a source of “excess” returns in relation to private debt funds.

Crucial to success in the current environment is an investor’s perception and measurement of risk.

In measuring risk, investor focus should be on avoiding permanent loss of capital, rather than volatility of capital and investment returns.

So long as permanent loss of capital is appropriately managed, investors should be prepared to accept a higher volatility of capital from their fixed income investments, along with less liquidity. 

Such an approach will likely result in higher and more consistent levels of income in retirement.

Short-term fixed income funds

Short-term fixed income funds are actively managed fixed income funds that seek to take advantages of opportunities in short-term fixed income and credit markets to generate returns above cash and term deposits.

Although short-term fixed income funds target a lower average portfolio duration, they are often able to invest in securities that have up to 5 years until they mature. (Duration is a measure of a security and portfolio’s sensitivity to movements in interest rates.  The higher a portfolio’s duration the more volatile it will be.  A portfolio rises in value when interest rates fall and decreases in value when interest rates rise.  Duration is measured in years.)

The target duration on “short-term fixed income funds” can vary materially, from less than 1 year and up to a maximum of three years.

Likewise, credit quality can vary significantly between different funds, ranging from high quality investment grade exposures to sub-investment grade (High Yield).  On a more technical note, and often not considered, the credit duration of these funds can also vary, particularly in relation to the maximum term of credit security invested in.  Like interest rate duration, credit duration is measured in years and the higher the credit duration the more volatile will be the security or portfolio.

Some of the short-term fixed income funds can also invest into inflation-linked securities, an additional diversifying source of return and risk exposure for a portfolio. And maybe a valuable addition to portfolios in the years ahead.

Funds also differ in the countries they invest into, from domestic markets (e.g. New Zealand and Australia) to internationally, including the emerging markets.

Therefore, there is a very broad spectrum of Funds in this category and fund selection should be undertaken relative to risk tolerances and any investment mandate constraints where applicable e.g. limits on credit quality.

In my mind, a broad investment mandate is better.  This provides more opportunity for a manager to add value and manage portfolio risks – should they have the skill, resources, and capabilities to do so.

Lastly, short-term fixed income funds are generally highly liquid, and more liquid than term deposits.

My approach would be to implement as broad an investment strategy as possible given the constraints of fees, risk tolerance, and access to appropriate vehicles.

There are a number of these funds in the marketplace. For a Kiwi Investor, a strategy denominated in New Zealand dollar terms should be preferred.

Private Debt Funds

For those investors with a longer-term investment horizon and can maintain within their portfolio illiquid investments, Private Debt Funds offer the potential to boost returns, not only in the current investment environment, in the future as well.

Typically, the term “private debt” is applied to debt investments which are not financed by banks (non-bank lending) and are not issued or traded in an open market.

Private debt falls into a broader category termed ‘alternative debt’ or ‘alternative credit’, and is used interchangeably with ‘direct lending’, ‘private lending’ and ‘private credit’.

Within the private debt market, investors lend to investee entities – be they corporate groups, subsidiaries, or special purpose vehicles established to finance specific projects or assets – in the same way that banks lend to such entities.

Private debt investments are often used to finance business growth and provide working capital.

Private Debt Funds invest in loans to a wide range of borrowers such as public and private companies, infrastructure providers, property developers, and project finance groups.

Private Debt has been one of the fastest-growing asset classes.  Part of this growth reflects a change in debt markets since the Global Financial Crisis (GFC) and a corresponding demand from investors, attracted by the return potential and a broader set of credit investment opportunities to invest in.

Illiquidity Risk Premium

To generate returns over cash and term deposits investors need to take on more risk. 

Arguably the most efficient way to take on more risk is to invest into a diversified range of risk premiums.  The best known risk premiums are value, growth, momentum, and to a lesser extent low volatility.  Equity markets, interest rates, and credit are also risk premiums. Good active managers will add value over and above, or independently, of all these premiums.

There is also an illiquidity risk premium, which is often underrepresented in portfolios.

The illiquidity premium is the additional compensation to investors for not being able to access their capital for a specific period.

As a result, illiquid investments, such as Private Debt, should offer a “premium” in the form of higher yield expectations.

These higher relative yields could be a helpful in boosting income in the current environment and in the future.

Measuring Risk

“Risk means, more things can happen than will happen”, Elroy Dimson. 

An investor’s perception and measurement of risk are important in managing an investment portfolio.

Perception toward risk is critical. For example, often, adding new “risks” to a portfolio leads to a less risky portfolio. 

Most importantly, in managing investment risks, the ability to think in terms of probabilities is important.  This involves understanding and appreciating the likelihood/chance of an event occurring and then the expected impacts of that event occurring to all parts of the portfolio.

In relation to measurement of risk, investor focus should be on avoiding permanent loss of capital, rather than measuring risk as fluctuations in capital and returns.

Warren Buffett understands this concept of risk very well.  And, it has not done him any harm implementing this approach to risk!

Accordingly, investors would do better thinking along these lines in relation to risk.

So long as permanent loss of capital is appropriately managed, investors should prepare to accept a higher volatility of capital from their fixed income investments and less liquidity. 

Such an approach will likely result in higher and more consistent levels of income in retirement.

Please read my Disclosure Statement

Global Investment Ideas from New Zealand. Building more Robust Investment Portfolios.

source: Forbes.com

Investment Framework for a Rising Interest Rates Environment

Amongst the strategies to employ for the current interest rate environment is a Liability Driven Investment (LDI) approach. 

LDI provides a framework for managing retirement income outcomes in what is likely to be a rising interest rate environment over the years ahead. 

LDI places retirement planning goals at the centre of the investment approach leading to several key benefits:

  1. More stable level of income in retirement;
  2. More efficient use of capital – potentially need less retirement savings; and
  3. Better framework to make trade-off between allocation to equities and the retirement income portfolio in improving the likelihood of reaching desired standard of living in retirement.

Under LDI a more customised investment solution can be developed.

Conversely, if an investor runs with a Cash strategy, where the goal is primarily capital preservation, they will likely need additional precautionary savings to meet their income requirements over retirement.

Therefore, while an LDI strategy increases the likelihood of reaching the retirement income objectives, it also achieves this with a more efficient allocation of investment capital.

The additional capital could be used for current consumption or invested in growth assets to potentially fund a higher standard of living in retirement, or used for other investment goals e.g. endowments and legacies.

Accordingly, LDI potentially provides a better framework in which to evaluate the risk of meeting your retirement income goals in a rising interest rate environment.

Retirement Planning (mis) focus

Arguably the primary goal of retirement planning is to provide a stable and secure stream of income in retirement – income to support a desired standard of living in retirement.

However, retirement planning investment approaches often focus too heavily on accumulated wealth e.g. how much do I need to save to retire on?

This could potentially result in the wrong focus.  For example, if a New Zealander retired in 2008 with a million dollars, their annual income would have been around $80k by investing in retail term deposits.  Their income would have dramatically dropped in 2009 to approximately $35k.  That is a big drop in income!  But interest rates have fallen further, currently (Feb 2021) a million dollars invested in New Zealand Term deposits will generate around $10k.

As a result, the focus should not necessarily be on the size of the account value e.g. KiwiSaver account balance.

This reflects that volatility of capital and investment returns are not a true measure of a retiree’s investment risk.

Investment strategies that focus on capital preservation, such as holding high levels of cash and short-term fixed income strategies, are riskier and more volatile relative to the investment goal of generating a stable and secure stream of income in retirement.

Redefining the Retirement Goal

Those planning for retirement seek to secure essential (sufficient income) and aspirational goals (additional wealth accumulation) with a high probability of achieving them.

Accordingly, the goal for retirement can be split between retirement income (essential goals) and wealth accumulation (aspirational goals). 

Those saving for retirement should be focusing on more than accumulated wealth alone. Other key considerations may include a desired level of retirement spending, meeting children’s education costs, healthcare costs, and a legacy.  These can be considered as future liabilities that need to be met.

Consequently, a better measure of a retiree’s investment risk becomes uncertainty around how much spending can be sustained in retirement.

Liability Driven Investing

Liability-driven investment (LDI) strategies, otherwise known as asset-liability management (ALM), take a complete and holistic approach.

LDI explicitly includes an investor’s current and future liabilities e.g., essential and aspirational goals.

The traditional way of building portfolios focusses more on risk tolerance, return expectations, and accumulated wealth rather than achieving the investment goals outlined above.

LDI creates better portfolios, particularly when it comes to retirement needs.  A more robust portfolio is generated, and the focus is on the key investment risk; failure to meet your investment objectives.

Obviously most financial planning processes take into consideration investment and retirement goals. Nevertheless, LDI makes retirement goals the central piece of constructing a portfolio. With LDI, portfolio allocations and management of risks are relative to meeting retirement objectives.

A more customised investment solution is developed.

See here for more on LDI.

The Benefits of LDI

Dimensional Funds Advisors (DFA) undertook analysis comparing two investment strategies relative to the goal of generating a stable and secure level of income in retirement:

  1. Goals based strategy that looks to generate sufficient income in retirement to match expected spending (consumption). This is the LDI strategy.
  2. Capital preservation strategy that is invested in Cash to manage the volatility of the account balance.

The following conclusions can be drawn from the DFA analysis:

  • The LDI strategy provides a more stable stream of income in retirement;
  • The LDI strategy provides greater clarity and confidence to plan for retirement; and
  • The Cash strategy results in a high level of volatility relative to the goal of generating a stable level of income in retirement.

See here for a detailed review of the DFA Research. 

In simple terms, the LDI strategy is a long-term bond portfolio that matches the expected retirement spending/consumption goal. Effectively, the LDI strategy generates cashflows to match future expected spending.

This reduces volatility relative to retirement spending goals.

Insurance Company’s implement a similar approach in meeting (paying out) future expected liabilities (insurance claims).

DFA conclude that “any strategy that attempts to reduce volatility using short- to intermediate-term fixed income, when the goal is a long-term liability like retirement consumption, will not be as effective as the LDI strategy.”

Although cash is perceived as low risk, it is not low risk when it comes to generating a steady and secure stream of income in retirement. Likewise, short term fixed income securities, while appropriate for capital preservation, are risky if the goal is to meet future spending/consumption in retirement.

In summary a LDI strategy provides the following benefits:

  1. More stable level of income in retirement;
  2. More efficient use of capital – potentially need less retirement savings; and
  3. Better framework to make trade-off between allocation to equities and retirement income portfolio in improving the likelihood of reaching desired standard of living in retirement.

If an investor runs with a Cash strategy, where the goal is primarily capital preservation, they will likely need additional precautionary savings to meet their retirement income requirements.

Therefore, while an LDI strategy increases the likelihood of reaching the retirement income objectives, it also achieves this with a more efficient allocation of capital.

This additional capital could be used for current consumption or invested in growth assets to potentially fund a higher standard of living in retirement, or used for other investment goals e.g. endowments and legacies.

Accordingly, LDI potentially provides a better framework in which to assess the risk of meeting your retirement income goals in a rising interest rate environment.

LDI Investment Framework for Individuals

Under the LDI model there are two portfolios: the liability portfolio and a return seeking portfolio. Most investment products offered today are return seeking portfolios with some dampening down of risk (measured by volatility of returns).

LDI is used by pension funds and insurance companies where their investment objectives and portfolios are primarily reflected in the terms of their future liabilities.

“Institutional” investment approaches such as LDI, Two-portfolio separation, and being more dynamic, are finding their way into wealth management solutions.

Goals-Based Investing is the wealth management counterpart to LDI. By way of example is EDHEC Risk Institute Goal-Based Investing Approach.

EDHEC suggest investors should maintain two portfolios:

  1. Goal-hedging portfolio – this replicates future replacement income goals; and
  2. Performance-seeking portfolio – this portfolio seeks returns and is efficiently diversified across the different risk premia – disaggregation of investment returns.

And, over time the manager dynamically allocates to the hedging portfolio and performance seeking portfolio to ensure there is a high probability of meeting retirement income levels.

Nevertheless, and most importantly, the Goal Based Investment framework outlined by EDHEC focuses on the goal of generating income in retirement.

Instead of worrying about fluctuations in capital, investors investing for retirement should worry about fluctuations of income in retirement.

With regards to capital specifically, the focus should be on avoiding permanent loss of capital, rather than fluctuations in capital.

See here for more on the EDHEC Goals Based Investment approach.

Please read my Disclosure Statement


Global Investment Ideas from New Zealand. Building more Robust Investment Portfolios.