Protecting your Portfolio from different market environments – including tail risk hedging

Avoiding large market losses is vital to accumulating wealth and reaching your investment objectives, whether that is attaining a desired standard of living in retirement or an ongoing and uninterrupted endowment.


The complexity and different approaches to providing portfolio protection (tail-risk hedging) has been highlighted by a recent twitter spat between Nassim Nicholas Taleb, author of Black Swan, and Cliff Asness, a pioneer in quant investing.

The differences in perspectives and approaches is very well captured by Bloomberg’s Aaron Brown article, Taleb-Asness Black Swan Spat Is a Teaching Moment.

I provide a summary of the contrasting perspectives in the Table below as outlined by Brown’s article, who considers both men as his friends.

There are certainly some important learnings and insights in contrasting the different approaches.


PIMCO recently published an article Hedging for Different Market Scenarios. This provides another perspective.

PIMCO provide a brief summary of different strategies and their trade-offs in diversifying a Portfolio.

They outline four approaches to diversify the risk from investing in sharemarkets (equity risk).

In addition to tail risk hedging, the subject of the twitter spat above between Taleb and Asness, and outlined below, PIMCO consider three other strategies to increase portfolio diversification: Long-term Fixed Income securities (Bonds), managed futures, and alternative risk premia.

PIMCO provide the following Graph to illustrate the effectiveness of the different “hedging” strategies varies by market scenario.PIMCO_Hedging_for_Different_Market_Scenarios_1100_Chart1_58109

As PIMCO note “it’s important for investors to know in what types of environments each strategy is more likely to work and in what environments each are likely to be less effective.”

As they emphasise “not every type of risk-mitigating strategy can be expected to work in every type of market sell-off.”

A brief description of the diversifying strategies is provided below:

  • Long Bonds – holding long term (duration) high quality government bonds (e.g. US and NZ 10-year or long Government Bonds) have been effective when there are sudden declines in sharemarkets. They are less effective when interest rates are rising. (Although not covered in the PIMCO article, there are some questions as to their effectiveness in the future given extremely low interest rates currently.)
  • Managed Futures, or trend following strategies, have historically performed well when markets trend i.e. there is are consistent drawn-out decline in sharemarkets e.g. tech market bust of 2000-2001. These strategies work less well when markets are very volatile, short sharp movements up and down.
  • Alternative risk premia strategies have the potential to add value to a portfolio when sharemarkets are non-trending. Although they generally provide a return outcome independent of broad market movements they struggle to provide effective portfolio diversification benefits when there are major market disruptions. Alternative risk premia is an extension of Factor investing.
  • Tail risk hedging, is often explained as providing a higher degree of reliability at time of significant market declines, this is often at the expense of short-term returns i.e. there is a cost for market protection.


A key point from the PIMCO article is that not one strategy can be effective in all market environments.

Therefore, maintaining an array of diversification strategies is preferred “investors should “diversify their diversifiers””.


It is well accepted you cannot time markets and the best means to protect portfolios from large market declines is via a well-diversified portfolio, as outlined in this Kiwi Investor Blog Post found here, which coincidentally covers an AQR paper. (The business Cliff Asness is a Founding Partner.)


A summary of the key differences in perspectives and approaches between Taleb and Asness as outlined in Aaron Brown’s Bloomberg’s article, Taleb-Asness Black Swan Spat Is a Teaching Moment.

My categorisations Asness Taleb
Defining a tail event Asness refers to the worst events in history for investors, such as the 5% worst one-month returns for the S&P 500 Index.

Research by AQR shows that steep declines that last three months or less do little or no damage to 10-year returns.

It is the long periods of mediocre returns, particularly three years or longer, that damages longer term performance.

Taleb defines “tail events” not by frequency of occurrence in the past, but by unexpectedness. (Black Swan)

Therefore, he is scathing of strategies designed to do well in past disasters, or based on models about likely future scenarios.


Different Emphasis

The emphasis is not only on surviving the tail event but to design portfolios that have the highest probability of generating acceptable long-term returns.   These portfolios will give an unpleasant experience during bad times.


Taleb prefers tail-risk hedges that deliver lots of cash in the worst times. Cash provides a more pleasant outcome and greater options at times of a crisis.

Investors are likely facing a host of challenges at the time of market crisis, both financial and nonfinancial, and cash is better.

Different approaches AQR strategies usually involve leverage and unlimited-loss derivatives.


Taleb believes this approach just adds new risks to a portfolio. The potential downsides are greater than the upside.
Costs AQR responds that Taleb’s preferred approaches are expensive that they don’t reduce risk.

Also, the more successful the strategy, the more expensive it becomes to implement, that you give up your gains over time e.g. put options on stocks

Taleb argues he has developed methods to deliver cash in crises that are cheap enough that they actually add to long-term returns while reducing risk.


Investor behaviours Asness argues that investors often adopt Taleb’s like strategies after a severe market decline. Therefore, they pay the high premiums as outlined above. Eventually, they get tire of the paying the premiums during the good times, exit the strategy, and therefore miss the payout on the next crash. Taleb emphasises the bad decisions investors make during a market crisis/panic, in contrast to AQR’s emphasis on bad decisions people make after the market crisis.


Good luck, stay healthy and safe.


Happy investing.

Please see my Disclosure Statement


Global Investment Ideas from New Zealand. Building more Robust Investment Portfolios.

Are Investment products meeting people’s needs over their working life?

A key finding by the Australian Productivity Commission is that “Well-designed life-cycle products can produce benefits greater than or equivalent to single-strategy balanced products, while better addressing sequencing risk for members.

There are also good prospects for further personalisation of life-cycle products that will better match them to diverse member needs, which would require funds to collect and use more information on their members.

Some current MySuper life-cycle products shift members into lower-risk assets too early in their working lives, which will not be in the interests of most members.”


This is one of many findings from of the 2018 Australian Productivity Commission Inquiry Report, Superannuation: Assessing Efficiency and Competitiveness.

Mysuper is a default option in Australia, similar to the Default Options by Kiwisaver providers in New Zealand and around the world.


The above findings are from the Section 4, Are Members needs being met, of the report (pg 238). This section, 4.3, Are products meeting people’s needs over their working life?, focuses on Life Cycle Funds. (Lifecycle Funds are often referred to as target-date funds in the United States, the United Kingdom, and other countries. They are popular in the US, accounting for 25% of their saving for retirement assets, and growing.)

Life cycle Funds, also referred to as Glide Path Funds, reduce the equity allocation in favour of more conservative investments, fixed interest and cash, as the investor gets closer to retirement.


Section 4.3 concludes “the Commission now recognises the value of well-designed MySuper life-cycle products, and the potentially significant gains that could arise from further personalisation.”

As covered in the report, they highlight that the poorer products currently on offer “requires some cleaning.”


Two areas of Section 4.3 are of interest to me.


The relative attractiveness of Lifecycle Funds

The report covers the varying views on Lifecycle Funds.

On this the Commission notes that the underperformance of some Lifecycle Funds does not “repudiate the principle of varying the management of risk as a person ages.”

Importantly, the “costs and benefits of life-cycle products depend on their design and on the characteristics of fund members (for example, the size of their balance).”

They note “the determinant of the variation between life-cycle products is the glide path from growth to defensive assets as the member ages”

“The lowest average retirement balances occur for life-cycle products with accelerated transitions to defensive assets as the member ages.”


As noted by several submissions, Lifecycle Funds can provide better outcomes if they maintain a higher growth allocation in the earlier years of saving for retirement. They also offer additional benefits in market downturns, particularly closer to retirement, they produce less poor outcomes than a standard single-strategy product, such as a Balanced Fund i.e. they manage sequencing risk better.


The criticism of Lifecycle Funds is often associated with poor design, as covered in this Post.


Increased Customisation of the Investment Solution

It is important to appreciate that not one investment product can meet all investor’s needs.  It does not make sense for a 29 year old and a 50 year to be in the same Default Fund.

This is an attractive feature of Lifecycle Fund offerings, they can be more tailored to the investor.

Specifically, they can be tailored for more than just age, such as Balance size, and this can in the majority of cases result in better outcomes for those saving for retirement. As outlined in this research article by Rice Warner.  Tailored investment solutions boost retirement savings outcomes.


On this point the Commission’s Report notes “There is significant scope for more personalised MySuper products”…

Specifically there is the scope to customise the investment strategy of Lifecycle Funds beyond age.

The report outlined a submission that observed that “… data and technology provide the opportunity for giant advancements in the design of personalised lifecycle strategies. Such strategies could account for: age, balance, contribution rate (which entails non-contribution due to career breaks etc), gender, expected returns, [and] risk.”

“Ultimately, individualised product design could also take into account other member characteristics, such as household assets, income from any partner and the potential capacity to extend a working life if there are adverse asset price shocks.”


The following two submissions in relation to Lifecycle Funds by David Bell and Aaron Minney are well worth reading for those wanting a greater understanding and appreciation of broader topics associated with Lifecycle Funds.

These submissions are also well worth reading by those interested in designing effective investment solutions for those saving for retirement.


Happy investing.

Please see my Disclosure Statement


Global Investment Ideas from New Zealand. Building more Robust Investment Portfolios.


Investment leadership is needed now

Investment leadership needs to step up. It needs to project confidence that it can crack through this crisis. It then needs to re-group with the benefits of extraordinary lessons learned through extraordinary times and morph into something better. While this crisis is rightly producing stories of heroes in scrubs and gowns, the investment industry will be discovering its own heroes. They are likely to be T-shaped leaders: both sure-footed in strategy and steeped in humanity.

This is the conclusion of Roger Irwin in his recent article, the hour for leadership is now, appearing on Top1000funds.com.


T-shaped leadership involves having deep expertise in your field and a greater awareness of societal and business issues.

As he notes, investment leaders have the opportunity to make life-changing differences for people’s savings and investments. “They will do so by drawing from the widest range of leadership skills to manoeuvre through the epic challenges this crisis presents and by emerging with stronger, fairer and more sustainable businesses.”

I couldn’t agree more.


The article has a wide ranging discussion on leadership, and what will be valued in the current situation. A mix of leadership approaches is required, it is not a case of either / or but and.


As he quite rightly points out, in the current environment, safety will be high on everyone’s needs.

“This suggests that the empathy shown to workers through this period of vulnerability will be preciously valued. For example, in the choice of what’s right to do now when family issues arise while working from home; this is the time to choose to do the family thing. For the best organisations, it’s not even close.” Quite right.


There is no doubt the current environment presents a unique set of challenges.

Irwin suggests the best stories will come from “organisations where leadership and culture are strongest. They will have a few things in common: a balance in the craft of exercising dominant and serving leadership styles; a purposeful culture as a north star; clarity that profit play a supporting role in that purpose; and a culture that accommodates this ‘it’s all about the people’ moment.”


He expects a number of disruptions to organisations, the following observations are made:

  • Good leaders always manage to stay in touch.
  • There will be a growing need for emotional intelligence among investment leadership. “Employees increasingly expect work and life to be integrated and this is central to good employee experiences where well-being, purpose and personal growth rank highly and intrinsic motivations are more lasting than extrinsic forms like pay.”
  • There needs to be a culture of openness in the workplace. The hoarding of information is old school. “Now the open-cultured organisations can create the positive state of psychological safety at all levels with everyone feeling included. This plays to better decision making all round and helps people with their resilience during tough times.”


As mentioned above, the current environment requires leaders to be T-shaped.

The vertical bar in the T constitutes deep expertise in their field.

The horizontal bar is about having greater awareness of societal and business issues. Being more in touch. The article provides a number of examples, including: a greater understanding of stress and fight or flight responses in brain science; and the balancing of dominant and serving leadership in management science.

He suggests, we build the vertical bar in the T through being in-touch with a wider network and other disciplines.


Good luck, stay healthy and safe.


Happy investing.

Please see my Disclosure Statement
 

Global Investment Ideas from New Zealand. Building more Robust Investment Portfolios.


The psychology of Portfolio Diversification

In a well-diversified portfolio, when one asset class is performing extremely well (like global equity markets), the diversified portfolio is unlikely to keep pace.

In these instances, the investor is likely to regret that they had reduced their exposure to that asset class in favour of greater portfolio diversification.

This is a key characteristic of having a well-diversified portfolio. On many occasions, some part of the portfolio will be “underperforming” (particularly relative to the asset class that is performing strongly).

Nevertheless, stay the course, over any given period, diversification will have won or lost but as that period gets longer diversification is more and more likely to win.

True diversification comes from introducing new risks into a portfolio. This can appear counter-intuitive. These new risks have their own risk and return profile that is largely independent of other investment strategies within the Portfolio. These new risks will perform well in some market environments and poorly in others.

Nevertheless, overtime the sum is greater than the parts.


The majority of the above insights are from a recent Willis Tower Watson (WTW) article on Diversification, Keep Calm and Diversify.

The article provides a clear and precise account of portfolio diversification.  It is a great resource for those new to the topic and for those more familiar.


WTW conclude with the view “that true diversification is the best way to achieve strong risk adjusted returns and that portfolios with these characteristics will fare better than equities and diversified growth funds with high exposures to traditional asset classes in the years to come.”


Playing with our minds – Recent History

As the WTW article highlights the last ten-twenty years has been very unusual for both equity and bond markets have delivered excellent returns.

This is illustrated in the following chart they provide, the last two rolling 10-year periods have been periods of exceptional performance for a Balanced Portfolio (60%/40% equity/fixed income portfolio).

WTW Balance Fund Performance


WTW made the following observations:

  • The last ten years has tested the patience of investors when it comes to diversification;
  • For those running truly diversified portfolios, this may be the worst time to change approach (the death of portfolio diversification is greatly exaggerated);
  • Diversification offers ‘insurance’ against getting it wrong e.g. market timing; and
  • Diversification has a positive return outcome, unlike most insurance.


WTW are not alone on their view of diversification, for example a AQR article from 2018 highlighted that diversification was the best way to manage periods of severe sharemarket declines, as recently experienced.  I covered this paper in a recent Post: Sharemarket crashes – what works best in minimising losses, market timing or diversification.


WTW also note that it is difficult to believe that the next 10-year period will look like the period that has just gone.

There is no doubt we are in for a challenging investment environment based on many forecasted investment returns.


What is diversification?

WTW believe investors will be better served going forwards by building robust portfolios that exploit a range of return drivers such that no single risk dominates performance. (In a Balanced Portfolio of 60% equities, equities account for over 90% of portfolio risk.)

They argue true portfolio diversification is achieved by investing in a range of strategies that have low and varying levels of sensitivity (correlation) to traditional asset classes and in some instances have none at all.

Other sources of return, and risks, include investing in investment strategies with low levels of liquidity, accessing manager skill e.g. active returns above a market benchmark are a source of return diversification, and diversifying strategies that access return sources independent of traditional equity and fixed income returns. These strategies are also lowly correlated to traditional market returns.


Sources of Portfolio Diversification

Hedge Funds and Liquid Alternatives

Hedge Funds and Liquid Alternatives are an example of diversifying strategies mentioned above. As outlined in this Post, covering a paper by Vanguard, they both bring diversifying benefits to a traditional portfolio.

Access to the Vanguard paper can be found here.


It is worth highlighting that hedge fund and liquid alternative strategies do not provide a “hedge” to equity and fixed income markets.

Therefore they do not always provide a positive return when equity markets fall. Albeit, they do not decline as much at times of market crisis, as we have recently witnesses. Technically speaking their drawdowns (losses) are smaller relative to equity markets.

As evidenced in the Graph below provided by Mercer.

Mercer drawdown graph


Private Markets

TWT also note there are opportunities within Private Markets to increase portfolio diversification.

There will be increasing opportunities in Private markets because fewer companies are choosing to list and there are greater restrictions on the banking sector’s ability to lend.

This is consistent with key findings of the recently published CAIA Association report, The Next Decade of Alternative Investments: From Adolescence to Responsible Citizenship.

The factors mentioned above, along with the low interest rate environment, the expected shortfall in superannuation accounts to meet future retirement obligations, and the maturing of emerging markets are expected to drive the growth in alternative investments over the decade ahead.

A copy of the CAIA report can be found here. I covered the report in a recent Post: CAIA Survey Results – The attraction of Alternative Investments and future trends.


TWT expect to see increasing opportunities across private markets, including a “range from investments in the acquisition, development, and operation of natural resources, infrastructure and real estate assets, fast-growing companies in overlooked parts of capital markets, and innovative early-stage ventures that can benefit from long-term megatrends.”

Continuing the theme of lending where the banks cannot, they also see the opportunity for increasing portfolios with allocations to Private Debt.

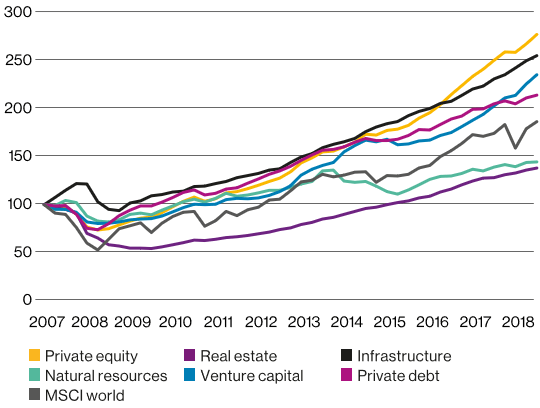
WTW provided the following graph, source data from Preqin

WTW Private Market Performance


Real Assets

In addition to Hedge Funds, Liquid Alternatives, and Private markets (debt and equity), Real Assets are worthy of special mention.

Real assets such as Farmland, Timberland, Infrastructure, Natural Resources, Real Estate, TIPS (Inflation Protected Fixed Income Securities), Commodities, Foreign Currencies, and Gold offer real diversification benefits relative to equities and fixed income in different macro-economic environments, such as low economic growth, high inflation, stagflation, and stagnation.

These are a conclusive findings of a recent study by PGIM. The PGIM report on Real Assets can be found here. I provided a summary of their analysis in this Post: Real Assets offer real diversification benefits.


Conclusion

To diversify a portfolio it is recommended to add risk and return sources that make money on average and have a low correlation to equities.

Diversification should be true both in normal times and when most needed: during tough periods for sharemarkets.

Diversification is not the same thing as a hedge. Although “hedges” make money at times of sharemarket crashes, there is a cost, investments with better hedging characteristics tend to do worse on average over the longer term. Think of this as the cost of “insurance”.

Therefore, alternatives investments, as outlined above, are more compelling relative to the traditional asset classes in diversifying a portfolio, they provide the benefits of diversification and on average over time their returns tend to keep up with sharemarket returns.

Importantly, investing in more and more traditional asset classes does not equal more diversification e.g. listed property.  As outlined in this Post.


As outlined above, we want to invest in a combination of lowly correlated asset classes, where returns are largely independent of each other. A combination of investment strategies that have largely different risk and return drivers.


Good luck, stay healthy and safe.


Happy investing.

Please see my Disclosure Statement


Global Investment Ideas from New Zealand. Building more Robust Investment Portfolios.


Tailored Investment solutions boost superannuation outcomes – Lifecycle Funds outperform Balanced Funds

A greater level of customisation leads to better investment outcomes for investors.

For example, Multifactor Lifecycle Funds that focus on age and size of account balances are best placed to last the distance as we live for longer in retirement, compared to a Balanced Fund and Lifecycle Funds that focus on age alone.

Multifactor Lifecycle Funds:

  1. Generate higher expected lifetime income relative to a Balanced Fund (70% equities and 30% Fixed Income and Cash); and
  2. Outperform a Balanced Fund over 90% of the time based on a numerous number of different market and economic scenarios.

These are the key findings of the Rice Warner’s research paper: Lifecycle Design – To and Through Retirement.

Lifecycle Funds, also referred to as Glide Path Funds, Target Date Funds, or Lifestages Funds, reduce the equity allocation in favour of more conservative investments, fixed interest and cash, as the investor approaches retirement.


Rice Warner found that somebody aged 30 with an opening balance of $26,000 and invested in a Multifactor Lifecycle Fund had a 91.8% chance of outperforming a Balanced Fund by the time of retirement at age 63.

Their research also found that by investing in a Multifactor Lifecycle Fund the expected retirement income is up to 35% higher than that expected from a Balanced Fund (Source: Australian AFR The product that can boost super by 35pc).

For somebody aged 60 with an account balance of $118,300, a Multifactor Lifecycle Fund had a 72.4 per cent chance of outperforming a Balanced Fund.

Lastly, Second Generation Lifecycle Funds, which reduce their growth allocation later, outperformed a Balanced Fund 91.2% of the time. A Multifactor Lifecycle Fund outperforms a Second Generation Lifecycle Fund 84.6% of the time.


A key conclusion from the Rice Warner research is that Lifecycle strategies that use factors in addition to age, such as superannuation account balance size, provide the ability to better tailor a portfolio to enhance outcomes for those saving for retirement. Therefore, they often outperform other investment strategies.


They achieve this by adopting a more growth-oriented stance while an investor has a long investment horizon and shifting to defensive assets when the investor’s investment horizon grows short.

Importantly, an individual’s investment horizon is a function of not only age but also the size of their superannuation account. This is an important concept, the rationale is provided in the section below – The Benefits of a Multifactor Lifecycle Fund.


A summary of the Rice Warner analysis is provided below, along with key Conclusions and Implications for those aged 30 and 60.

A copy of the Rice Warner analysis can be found here.


To my mind, there is going to be an increased customisation of investment solutions available for those saving for retirement that will consider factors beyond age e.g. account size, salary, and assets outside of Super.  Some are available already.

Technology will enable this, Microsoft and BlackRock are well advanced in collaborating, BlackRock and Microsoft want to make retirement investing as easy as ordering an Uber.


In relation to Lifecycle Funds, they are subject to wide spread criticism.

Some of this criticism is warranted, nevertheless, often the criticism is the result of the poor design of the Fund itself, rather than concept of a Lifecycle Fund itself. This is highlighted in the Rice Warner research, where the first Generation of Lifecycle Funds de-risk to early.

I covered the criticism of Lifecycle Funds in a previous Post, in the defence of Lifecycle Funds.


Lifecycle Funds can be improved upon. For example a more sophisticated approach to the management of the Cash and Fixed Interest allocation, this is well documented by the research undertaken by Dimensional Funds Advisors which I covered in a previous Post.


In my opinion, all investments strategies would benefit from a greater focus on tangible investment goals, this will lead to a more robust investment solution.

A Goals based investing approach is more robust than the application of “rule of thumbs”, such as the 4% rule and adjusting the growth allocation based purely as a function of age.

Goals based investing approaches provide a better framework in which to assess the risk of not meeting your retirement goals.

Greater levels of customisation are required, which is more relevant in the current investment environment.


Rice Warner – The benefits of Multifactor Lifecycle Funds

Investment literature indicates that an investor’s investment horizon is a key determinant of an appropriate investment strategy.

The consequence of longer investment horizons allows an investor to take on more risk because even if there is a severe market decline there is time to recover the losses.

Furthermore, and an important observation, Rice Warner’s analysis suggests that as we enter retirement investment horizon is a function of age and size of the superannuation account balance.

A retiree with a larger account balance has in effect a longer investment horizon. They are in a better position to weather any market volatility.

This reflects, that those with a small account size typically withdraw a greater proportion of their total assets each year, indicative of largely fixed minimum cost of living, resulting in a shorter investment horizon.


A very big implication of this analysis is that an investor’s investment horizon is “not bounded by the date that they choose to retire (though this point is relevant). This is as a member is likely to hold a substantial proportion of their superannuation well into the retirement phase, unless their balance is low.”

“One consequence of this is that investment strategies which consider this retirement investment horizon may deliver better outcomes for members – both to and through retirement. This is because as a member’s account balance grows, sequencing risk becomes less relevant allowing higher allocations to growth assets.”

For those wanting a better understanding of sequencing risk, please see my earlier Post.


Rice Warner conclude, Lifecycle strategies that use factors in addition to age, such as superannuation account balance size, provide the ability to better tailor a portfolio to provide enhanced outcomes for those saving for retirement. Therefore, they often outperform other investment strategies.

Thus, the title of their research Paper, Lifecycle Design – To and Through Retirement, more often than not investors should still hold a relatively high allocation to growth assets in retirement.  They should be held to the day of retirement and throughout retirement.

The research clearly supports this, a higher growth asset allocations should be held to and through retirement.  In my mind this is going to be an increasingly topically issue given the current market environment.


Rice Warner Analysis

Rice Warner considered several investment strategies applied to various hypothetical members throughout their lifetime.

They assess the distribution of outcomes of the investment strategies to establish whether adjustments can be made to provide members with better outcomes overtime.

Rice Warner considered:

  1. Balanced Strategy which adopts a fixed 70% allocation to Growth assets.
  2. High Growth strategy which adopts a fixed 85% allocation to Growth assets.
  3. First-generation Lifecycle (Lifecycle 1 (Age)) with a focus on defensive assets and de-risking at young ages.
  4. Second-generation Lifecycle (Lifecycle 2 (Age)) with a focus on growth assets and de-risking at older ages.
  5. Multi-dimensional Lifecycle (Lifecycle (Age and Balance)) which adopts a high allocation to growth assets unless a member is at an advanced age and has a low balance.

Six member profiles selected to capture low, moderate, and high wealth members at ages 30 and 60.

Rice Warner then considered the distribution of expected lifetime income under a range of investment scenarios using a stochastic model.

This allowed for a comparison of the income provided to members under each strategy in a range of investment situations for comparative purposes.


Conclusions

Rice Warner Conclude:

  • Investment horizon is a critical driver in setting an appropriate investment strategy. Investment strategies should take into consideration a range of investment horizon, both before and after retirement.
  • Adopting high allocations to growth assets is not inherently a poor strategy, even in cases where members are approaching retirement. These portfolios will typically provide:
    • Improved outcomes in cases where members are young, or investment performance is strong;
    • Marginally weaker outcomes where members are older and investment performance is weak.
  • Second-generation Lifecycle investment strategies (focused on growth assets and late de-risking) will typically outperform first generation strategies (which are focused on defensive assets and de-risking when a member is young).
  • Growth-oriented constant strategies will typically outperform First-generation Lifecycle strategies, except where investment performance is poor.
  • Designing Lifecycle strategies that use further factors in addition to age (such as balance) provide the ability to better tailor a portfolio to provide enhanced outcomes by:
    • Adopting a more growth-oriented stance while a member has a long investment horizon.
    • Shifting to defensive assets when a member’s investment horizon grows short.


Implications

Overall the results, aged 30:

  • High Growth strategies can provide significant scope for outperformance with minimal risk of underperformance relative to a Balanced Fund due to the members’ long investment horizon.
  • First-generation Lifecycle strategies will typically underperform each of the other strategies considered except where investment outcomes are poor for a protracted period. This underperformance is a result of the defensive allocation of these strategies being compounded over the member’s long investment horizon.
  • Second-generation Lifecycle can mitigate the risk faced by the members over their lifetime, albeit at the cost of a reduced expected return on their portfolio relative to a portfolio with a higher constant allocation to growth assets.
  • Lifecycle strategies which adjust based on multiple factors are able to manage the risk and return trade-off inherent to investments in a more effective way than single strategies or Lifecycle strategies only based on age. This is a result of the increased tailoring allowing the portfolio to adopt a more aggressive stance when members are young and thereby accumulate a high balance and extend their investment horizon further. This leads to this portfolio often outperforming the other strategies considered.


For those aged 60

  • High Growth strategies can provide significant outperformance in strong investment conditions. This comes at the cost of a modest level of underperformance in a poor investment scenario (a reduction in total lifetime income for members ranging between 2% and 5% relative to a Balanced fund).
  • First-generation Lifecycle strategies will underperform in neutral or strong market conditions due to their lack of growth assets. In cases where investment performance is poor these strategies outperform the other strategies considered particularly for those with low levels of wealth (due to their short investment horizons).
  • Two-dimensional Lifecycles provide enhanced risk management (but not necessarily better expected performance) by providing:
    • Protection for members who are vulnerable to sequencing risk with short investment horizons (low and moderate wealth profiles) by adopting a Balanced stance.
    • High allocations to growth for members whose investment horizon is long (high wealth profiles).


Good luck, stay healthy and safe.


Happy investing.

Please see my Disclosure Statement


Global Investment Ideas from New Zealand. Building more Robust Investment Portfolios.


Forecasted investment returns remain disappointing – despite recent market movements

Long-term expected returns from global sharemarkets have not materially changed despite recent sharemarket declines.

The longer term outlook for fixed income returns has deteriorated materially.

There is no doubt the investment environment is going to be challenging, not just in the months ahead, over the medium to longer term as well.

This should prompt some introspection as to the robustness of current portfolios.

From a risk management perspective an assessment should be undertaken to determine if current portfolio allocations are appropriate in meeting client investment objectives over the longer term.

A set and forget strategy does not look appropriate at this time. Serious thought should be given to where expected returns are going to come from over the medium to longer term.

By way of example, the expected long-term return from a traditional Balanced Portfolio, of 60% Equities and 40% Fixed Income, is going to be very challenging.

Arguably, the environment for the Balanced Portfolio has worsened, given return forecasts for fixed income and that they are not expected to provide the same level of portfolio diversification as displayed historically.

The strong performance of fixed income is a key contributing factor to the success of the Balanced Fund over the last 20 years. This portfolio plank has been severely weakened.


Asset Class expected forecasted Returns

A clue to future expected returns is outlined in the following Table generated by GMO, which they update on a regular basis.

The Table presents GMO’s 7-Year Asset Class Real Return Forecasts (after inflation of around 2%), as at 31 March 2020.

GMO 7-YEAR ASSET CLASS REAL RETURN FORECASTSGMO 7-Year Asset Class Real Return Forecasts March 2020


An indication of the impact of recent market performance on future market forecasts can be gained by comparing current asset class forecast returns to those undertaken previously.

The following Table compares GMO’s 7-Year Asset Class Real Returns as 31 March 2020 to those published for 31 December 2019.

The first column provides the 7-Year return forecasts updated as at 31 March 2020. These are compared to GMO’s return forecast at the beginning of the year.

The last column in the Table below outlines the change in asset class forecasted returns over the quarter.

31-Mar-20

31-Dec-19

Change

US Large

-1.5%

-4.9%

3.4%

US Small

1.4%

-2.2%

3.6%

International Equities

1.9%

-0.8%

2.7%

Emerging Markets

4.9%

3.5%

1.4%

US Fixed Income

-3.8%

-1.8%

-2.0%

International Fixed Income Hedged

-4.3%

-3.5%

-0.8%

Emerging Market Debt

3.0%

-0.6%

3.6%

US Cash

-0.2%

0.2%

-0.4%

       
US Balanced (60% Equities / 40% Fixed Income)

-2.4%

-3.7%

1.2%

International Balanced

-0.6%

-1.9%

1.3%

The following observations can be made from the Table above:

  • Although the return outcomes for equities have improved, they remain low, under 2% p.a. after inflation;
  • Emerging markets equities offer the most value amongst global sharemarkets, generally returns outside of the US are more attractive;
  • Expected returns from developed market fixed income markets have deteriorated, particularly for the US;
  • The expected outlook for Emerging Market debt has improved materially over the last three months; and
  • The return outlook for the Balanced Fund remains disappointing despite an improvement.


Impact of recent market movements on expected returns

The degree to which forecast sharemarket returns have increased may disappoint, particular given the extreme levels of market volatility experienced over the first quarter of 2020.

This in part reflects that global sharemarkets as a group “only” fell 11.5% over the first three months of the year. It probably felt like more.

Furthermore, although declining sharemarkets now translates to higher expected returns in the future, it is not a one for one relationship.


The relationship between current market performance and the impact on forecast returns is well captured by a recent Research Affiliates article.

As they note “When a market corrects dramatically, say, 30%, long-term expected returns do not rise by the same 30%.”

They illustrate this point using the US market (S&P 500 Index).


Research Affiliates estimate that a 30% pullback (drawdown) in the US sharemarket implies an increase in expected return of 1.7% a year for the next decade.

This is based on their assumptions for average real earnings per share over a rolling 10-year period for US companies and their estimate of fair value for the US sharemarket over the longer term. For an estimation of fair value they apply a cyclically adjusted price-to-earnings (CAPE) ratio.

The return estimate is based on the level and valuation of the US sharemarket on the 19th February, when the US market reached a historical high level (Peak).

The interrelationship between current market value, expected earnings, and the estimate of longer term value and their impact on expected returns is captured in the following diagram.

Based on market valuation, as measured by CAPE on 19th February 2020, the right-hand side displays the estimated change in expected returns from a decline in the US sharemarket from the peak in February e.g. a 30% drop in the S&P 500 Index from the Peak translates to a 1.7% change in Expected Return from valuation (change in CAPE).

The central point remains, a drop in the sharemarket today translates into higher expected returns.

Research Affiliates CAPE and Expected Return Estimates at Different Market Prices

The diagram above also captures the changing valuation of the market, as measured by CAPE, to a decline in the US sharemarket, as outlined on the left-hand side.


Research Affiliates long-term expected returns for a wide range of markets can be found on their homepage.


Caution in using Longer-term market forecasts

Forecasting the expected return for sharemarkets is extremely tricky, to say the least, with the likely variation in potential outcomes very widely dispersed.

Forecasting fixed income returns has a higher level of certainty.  The current level of interest rates provides a good indication of future returns. Given the dramatic fall in interest rates over the last three months, the expected returns from fixed income has deteriorated.


Nevertheless, caution should be taken when considering longer-term market forecasts.

This is emphasised in the Research Affiliates article, their “expected return forecasts also come with a warning label: Long-term expected returns, unto themselves, are not sufficient for short-term decision making. Ignoring this warning will most likely lead to impaired wealth.

Ten-year return forecasts offer valuable guidance to a buy-and-hold investor about the return they are likely to earn over the next decade. They provide no information, however, about when to buy or sell and do not identify a market top or bottom.”


Challenging Investment Environment

From a risk management perspective an assessment should be undertaken to determine if current portfolio allocations are appropriate in meeting client investment objectives over the longer term.

A set and forget strategy does not look appropriate at this time. Serious thought should be given to where expected returns are going to come from over the medium to longer term

There is no doubt the investment environment is going to be challenging, not just in the months ahead, over the medium to longer term as well.


This should prompt some introspection as to the robustness of current portfolios.

For example, the low expected return environment led GMO to declare earlier in the year it is time to move away from the Balanced Portfolio. The Balanced Portfolio is riskier than many people think.

The low expected return environment and reduced portfolio diversification benefits of fixed income is why the Balanced Fund is expected to underperform.


It is also partly driving institutional investors to develop more robust portfolios by investing outside of the traditional asset classes of equities and fixed income by increasing their allocations to alternative investments.

As highlighted by a recent CAIA survey investments into alternatives, such as private equity, real assets, and liquid alternatives, are set to grow over the next five years, becoming a bigger proportion of the global investment universe.


Research by AQR highlights that diversifying outside of the traditional asset is the best way to manage through severe sharemarket declines. Furthermore, diversification should work in good and bad times


For those interested, posts on the optimal private equity allocation and characteristics and portfolio benefits of real assets may be of interest.  Real assets offer real portfolio diversification benefits, particularly in different economic environments.

My Post Investing in a Challenging Investment Environment outlines suggested changes to current investment approaches that could be considered.


Good luck, stay healthy and safe.


Happy investing.

Please see my Disclosure Statement


Global Investment Ideas from New Zealand. Building more Robust Investment Portfolios.