Is a value bias part of the answer in navigating today’s low interest rates?

The Value Factor (value) offers the potential for additional returns relative to the broader sharemarket in the years ahead.

Exploring an array of different investment strategies and questioning the role of bonds in a portfolio are key to building a robust portfolio in the current low interest rate environment.

There will also be a need to be more dynamic and flexible to take advantage of market opportunities as they arise.

From this perspective, a value tilt within a portfolio is one investment strategy to consider in potentially boosting future investment returns.

The attraction of Value

Evidence supporting a value tilt within a robust portfolio is compelling, albeit opinion is split.

Nevertheless, longer-term, the “Rotating into Value stocks offers substantial upside in terms of return versus the broad market” according to GMO.

GMO presents the case for a value tilt to navigate today’s low interest rates in their Second Quarter 2020 Letter, which includes two insightful articles, one by Ben Inker and another by Matt Kadnar. 

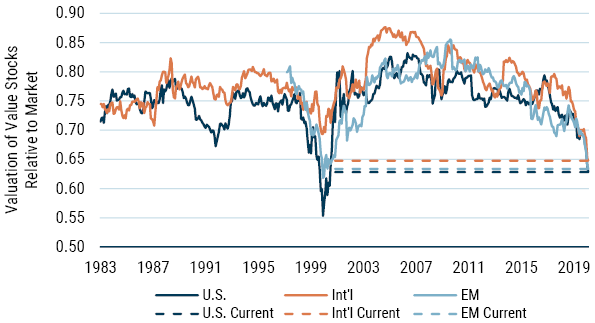
Value is at cheapest relative to the broader market since 1999, based on GMO’s analysis.  Value is in the top decile of attractiveness around the world, as highlighted in the following figure.

Spread of Value for MSCI Regional Value Factors (GMO)

As of 6/30/2020 | Source: MSCI, Worldscope, GMO

Is Value Investing Dead

As mentioned, the opinion on value is split.

A research paper by AQR earlier in the year addressed the key criticisms of value, Is (Systematic) Value Investing Dead?

For a shorter read on the case for value Cliff Asness, of AQR, Blog Post of the same title is worth reading.

AQR’s analysis is consistent with GMO’s, as highlighted in the Graph and Table below.

The Graph below measures the Price-to-Book spread of the whole US sharemarket from December 1967 to March 2020.

This spread was at the 100th percentile versus 50+ years of history on the 31 March 2020 i.e. value is at it cheapest based on 50 years of data.

Price-to-Book Spread (AQR)

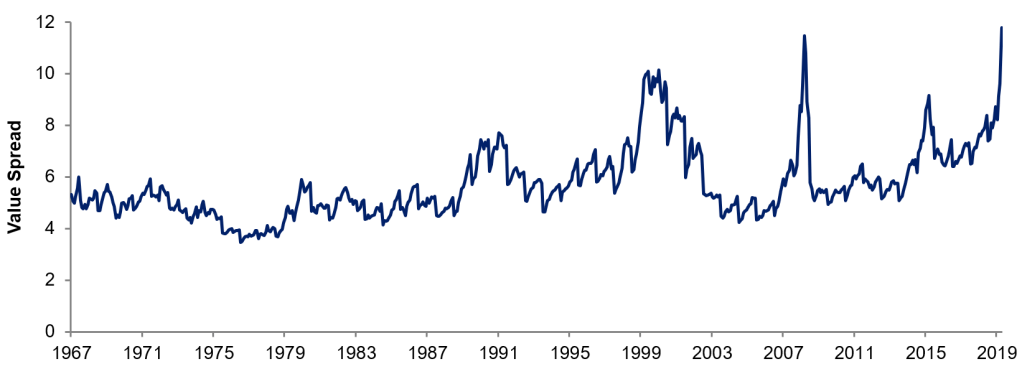
Asness’s Blog Post highlights “expensive stocks are sometimes only <4x as expensive as the cheap stocks, the median is that they are 5.4x more expensive, but today they are almost 12x more expensive.” (March 2020).

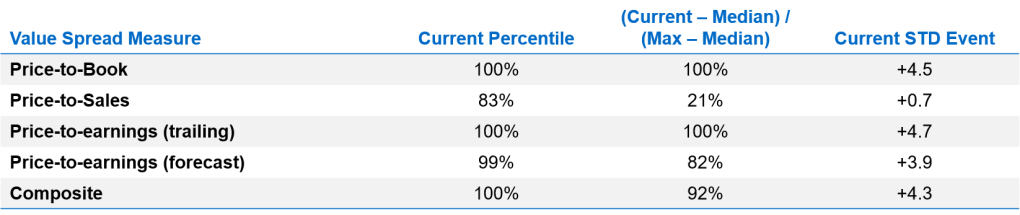
It is the same story when looking at different measures of value for the US sharemarket, as highlighted in the Table below.

Value is at its cheapest on many measures (AQR)

‘Don’t ask the barber whether you need a haircut’

This quote by Warren Buffett springs to mind when considering the analysis from GMO and AQR, both being value orientated investors.  As Asness states, AQR has a horse in the race.

However, as outlined in his Post, he undertakes the same analysis as above and controls for, just to name a few:

  • Excluding all Technology, Media, and Telcom Stocks
  • Excluding the largest stocks
  • Excluding the most expensive stocks
  • Industry bets
  • Industry neutrality
  • Quality of company

Analysis is also undertaken using other measures of value, Price-Sales, P/E, using trailing and forecast earnings (these are in addition to Price-Book).

The attraction of value remains based on different measures of value and when making the adjustments to market indices as outlined above.

Asness argues value is exceptionally cheap, probably the cheapest it has ever been in history (March 2020).

The AQR analysis shows this is not because of an outdated price-to-book nor because of the dominance of highly expensive mega-cap stocks.  Investors are paying more than usual for stocks they love versus the ones they hate.  There is a very large mispricing.

The AQR research paper mentioned above, looked at the common criticisms of value, such as:

  1. increased share repurchase activity;
  2. the changing nature of firm activities, the rise of ‘intangibles’ and the impact of conservative accounting systems;
  3. the changing nature of monetary policy and the potential impact of lower interest rates; and
  4. value measures are too simple to work.

 Across each criticism they find little evidence to support them.

Are we there yet?

We do not know when and how the valuation gap will be closed. 

Nevertheless, the evidence is compelling in favour of maintaining a value tilt within a portfolio, and certainly now is not the time to give up on value.

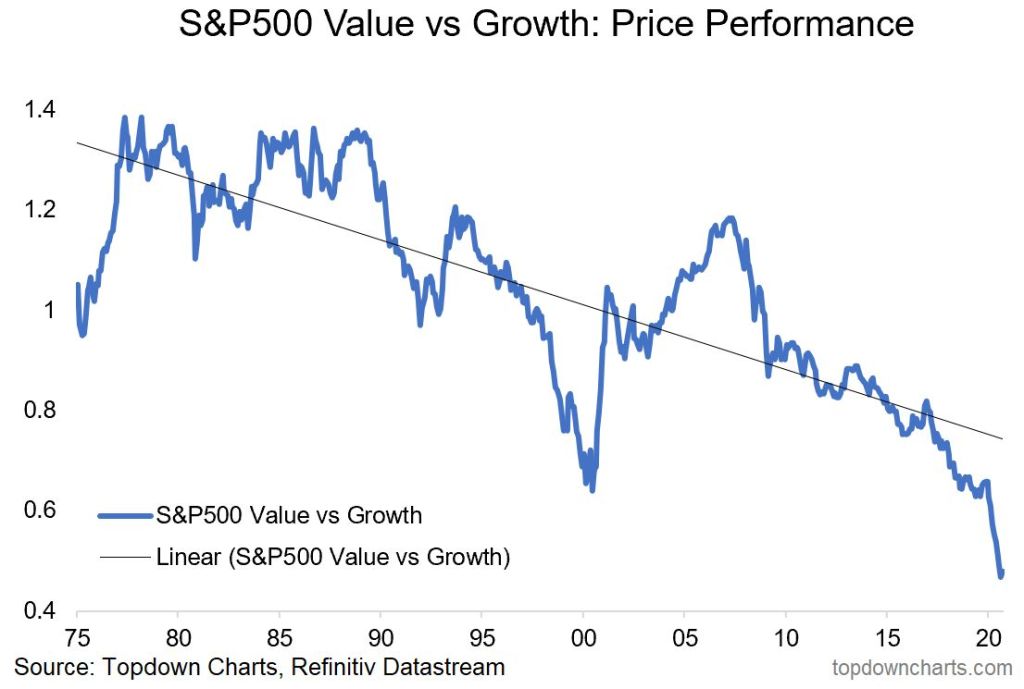
This is not a widely popular view, and quite likely a minority view, given the underperformance of value over the last ten years.  As clearly demonstrated in the Graph below provided by Top Down Charts.

However, from an investment management perspective, the longer-term odds are in favour of maintaining a value tilt and thereby providing a boost to future investment returns in what is likely to be a low return environment over the next ten years.

It is too early to give up on value, news of its death are greatly exaggerated, on this, Asness makes the following point, value is “a strategy that’s “worked” through the 1920s – when a lot of stocks were railroads, steel, and steamship companies – through the Great Depression, WWII, the 1950s – which included some small technological changes like rural electrification, the space race and all the technology that it spanned – the internet age (remember these same stories for why value was broken back in 1999-2000?)………. Value certainly doesn’t depend on technological advancement being stagnant! But in a time when it’s failed for quite a while (again, that just happens sometimes even if it’s as good as we realistically think it is), it’s natural and proper that all the old questions get asked again. Is now different?”

I don’t think so.

Please see my Disclosure Statement

Global Investment Ideas from New Zealand. Building more Robust Investment Portfolios.

Future trends in ETFs are rather daunting. Are you prepared?

The recent survey by EDHEC-Risk Institute (EDHEC) of European professional investors into their practices, perceptions and future plans for investing into Exchange Trade Funds (ETF) is of interest and well worth reading.

The survey gathered information from 163 European investment professionals. Respondents to the survey were high-ranking professionals within their respective organisations, representing firms with large assets under management (36% of respondents represent firms with assets under management exceeding €10bn). Respondents to the survey are from the United Kingdom, European Union, Switzerland, and a small sample from other countries outside the European Union.


What is the dominant purpose of ETF usage?

The survey results clearly indicate that the current usage of ETFs is dominated by a truly passive investment approach. “Despite the possibilities that ETFs offer – due to their liquidity – for implementing tactical changes, they are mainly used for long-term exposure.”

Gaining broad market exposure remains the main focus of ETF users – 71% of respondents use ETFs to gain broad market exposure, versus 45% who use ETFs to obtain specific sub-segment exposure (sector, style).

“In line with this expression of conservatism in their use of ETFs, which is mainly focused on traditional passive management, it can also be noted that investors are largely satisfied by ETFs in traditional asset classes but more reserved about ETFs for alternative asset classes”


What are the future growth drivers?

The European ETF market has seen tremendous growth over the past decade or so. At the end of December 2017, the assets under management (AUM) within the 1,610 ETFs constituting the European industry stood at $762bn, compared with 273 ETFs amounting to $94bn at the end of December 2006 (ETFGI, 2017).

“A remarkable finding from our survey is that a high percentage of investors (50%) still plan to increase their use of ETFs in the future, despite the already high maturity of this market and high current adoption rates.”

Why? lowering investment cost is the primary driver behind investors’ future adoption of ETFs for 86% of respondents in 2018 (which is an increase from 70% in 2014).

Interestingly, EDHEC find investors are not only planning to increase their ETF allocation to replace active managers (70% of respondents in 2018), but are also seeking to replace other passive investing products through ETFs (45% of respondents in 2018).


How do investors select ETFs?

Cost and quality of replication. Both of which are more easy to identify from a quantitative perspective.

EDHEC argue” Given that the key decision criteria are more product-specific and are actually “hard” measurable criteria, while “soft” criteria that may be more provider-specific have less importance, competition for offering the best products can be expected to remain strong in the ETF market. This implies that it will be difficult to build barriers of entry for existing providers unless they are related to hurdles associated with an ability to offer products with low cost and high replication quality.”


A section I found more interesting:

What are the Key Objectives Driving the Use of Smart Beta and Factor Investing Strategies?

EDHEC find that “the quest for outperformance is the main driver of interest in smart beta and factor investing. In fact, 73% of respondents agree that smart beta and factor investing indices offers significant potential for outperformance”

The most important motivation behind adopting such strategies is to improve performance.

Interestingly they find that the actual implementation of such strategies is still at an early stage

EDHEC found that among those respondents who have made investments in smart beta and factor investing strategies, these investments typically made up only a small fraction of portfolio holdings.

“More than four-fifths of respondents (83%) invest less than 20% of their total investments in smart beta and factor investing strategies and only 11% of respondents invest more than 40% of their total investments in smart beta and factor investing strategies”

As they say, ”It is perhaps surprising that almost a decade after the influential report on Norway’s Sovereign Wealth Fund (see Ang, Goetzmann and Schaefer, 2009), which emphasised the benefits of factor investing for investors, adoption of such an approach remains partial at best.


Not surprisingly, those that use factor strategies, the use of them is not related to factor timing and more to extracting the long term premia from the factors.


In relation to fixed interest, “17% of the whole sample of respondents already use smart beta and factor investing for fixed-income. Some 80% of this sub-sample of respondents invest less than 20% of their total investment in smart beta and factor investing for fixed-income.”

It appears that respondents show a significant interest for smart beta and factor investing for fixed-income. The interest appears to be there, but likelihood of implementation not so much.

Interestingly, from responses “it thus appears that investors are doubtful that research on factor investing in fixed-income is sufficiently mature at this stage. Given the strong interest in such strategies indicated by investors, furthering research in fixed-income factor investing is a promising venture for the industry.”


The survey looked into a number of other areas, for example do investors have the necessary information to evaluate smart beta and factor investing strategies? What requirements do investors have about smart beta and factor investing strategy factors?


Future Developments

What are investor expectations for further development of ETF products?

The following areas where identified as potential are of further ETF product development:

  • Ethical/Socially Responsible Investing (SRI) ETFs,
  • emerging market equity ETFs and emerging market bond ETFs,
  • ETF indices based on smart beta and on multi-factor indices, EDHEC note that more than two-fifths of the respondents want further developments in at least one of the categories related to smart beta equity or factor indices. “This shows that the development of ETFs based on advanced forms of equity indices is now by far the highest priority for respondents.”……… “We also note that additional demand for ETFs based on smart bond indices is not so far behind”…..


Fixed Income and Alternatives

The survey results indicate that respondents desire further development in the area of fixed income and alternative asset classes.

Also there is an increased interest in integration of ESG in smart beta and factor investing, and strategies in alternative asset classes.

“So, there is still a lack of products when it comes to asset classes other than equity, and this lack is particularly critical for the fixed-income asset class, which is largely used by investors.”… “It is likely that the development of new products corresponding to these demands may lead to an even wider adoption of smart beta and factor investing solutions.”


Happy investing.


Global Investment Ideas from New Zealand. Building more Robust Investment Portfolios.


Please see my Disclosure Statement

Andrew Ang on Factor Investing

Great interview with Andrew Ang on Factor investing.


Two key take outs from my perspective in relation to Factor Investing.


How to determine what factors to invest in?

  1. Ensure the factor generates a return as a reward for bearing a specific set of risks. The risk return profile results from market structures, an economic value, or investors’ behavioural bias.
  2. The excess return from the factor needs to be persistent and will be there over time.
  3. The factor is a unique and a differentiated source of return, different to the risk return profile of the market (beta), and lowly correlated with other factors.
  4. The factor is scalable, the factor can be delivered relatively cheaply and with scale.


As you know, there are lots of reported factors (the factor zoo). I tend to agree that there are a limited number, value, momentum, quality, size, and minimum volatility appear to have the greatest foundation of work in supporting their existence, economic rationale, and persistence over time.


How should factors be used?

  1. To complement an existing portfolio of active managers, preferable active managers with genuine idiosyncratic risk exposures e.g. non-factors more company specific risks.
  2.  Replace a traditional index exposure to get a more efficient market exposure, this could enhance your returns and/or reduce risk, see previous post on short comings of passive indexing.
  3.  Express a view within a portfolio e.g. over or under weight certain factors that are attractive or unattractive at certain points in the business cycle.


Happy investing.


Please see my Disclosure Statement


Global Investment Ideas from New Zealand. Building more Robust Investment Portfolios.

Limitations of Passive Index Investing

The short comings of investing into market index benchmarks are not widely discussed, nor understood.

Market indices suffer from two key short comings:

  1. They have exposures to unrewarded risks, they are therefore suboptimal e.g. think concentration risk, the best example of which is the Finnish Market Index which at one point Nokia made up over 50% of the Index. In New Zealand Telecom once made up over 30% of the Market Index.
  1. Poor Diversification of rewarding risk exposures e.g. they are not efficient. See discussion below.


The first short coming is well understood and often highlighted.  This is an issue with the current US market with the growing dominance of the Technology stocks which now make up 25% of the market.  Apple currently makes up around 4% of the S&P 500, this compares to IBM’s 7% weighting in the late 1970s.  Transport stocks dominated the S&P 500 for over 60 years in the mid-1880s to early 1900s.  Therefore unrewarded risks, such as concentration risks, have been a common feature of market indices and benchmarks.


The second short coming is less well understood.  In effect, market indices are poorly allocated to known risk premia from which excess returns can be generated from.

For example, and to the point, given their construction market indices are underweight the value and size premia.  These are known systematics risks for which investors are rewarded e.g. the value and size premia


Of course we are talking about the rise of Factor Investing, which I covered in an earlier post.


We are also not talking about a “factor zoo”, there are a number of limited rewarding risk premia, which are likely to include the likes of value and size (small cap), momentum, and low volatility.  Profitability, quality, and carry are potentially others to consider as well.  Implementation of Factor strategies is key.


Fama and French, the fathers of Finance, developed the 3 Factor model in the 1990s.  The 3 factor model includes market risk, value, and size.  It has now become a 5 factor model.  Their pioneering work forms the basis of a very successful global Funds Management business.

This stuff is not new, yet large amounts of money flow into the inefficient and sub-optimal market index funds.  Bond indices are more suboptimal than equity market indices.


Therefore, factor exposures provide a more efficient exposure for investors.

The go to analogy on understanding Factors comes from Professor Andrew Ang, factors in markets are like nutrients in food:

“Factors are to assets what nutrients are to food. Just like ‘eating right’ requires you to look through food labels to understand the nutrient content, ‘investing right’ means looking through asset class labels for the underlying factor risks. It’s the nutrients in the food that matter. And similarly, the factors matter, not the asset labels.”


Factor investing is part of a strong movement by institutional investors away from investing into “asset classes” but thinking more about looking through asset class labels and investing into the underlying factors.


Many institutional investors understand that true portfolio diversification does not come from investing in many different asset classes but comes from investing in different risk factors.

The objective is to implement a portfolio with exposures to a broad set of different return and risk outcomes.

True portfolio diversification is achieved by investing in different risk factors that drive the asset classes e.g. duration, economic growth, low volatility, value, and momentum.


This is part of a wider shift within the global Wealth and Funds Management industry.  The industrial revolution that EDHEC Risk discusses.  There are better ways of doing things, such as Goal Based Investing.


Remember, Modern Portfolio Theory (MPT) is over 65 years old, it is hardly modern anymore.  Although the fundamentals of the benefits of diversification remain, greater insights have been gained over the years and more efficient approaches to building robust portfolios have been developed.


Happy investing.


Please see my Disclosure Statement


Global Investment Ideas from New Zealand. Building more Robust Investment Portfolios.


 cropped-title-picture-enhanced.jpg

Unintended Portfolio Risks – Fixed Interest example

A lot of investment professionals understand the issue outlined in this post.

Not so the investment public, for example KiwiSaver Investors.  Are they aware that their “Conservative” Kiwisaver Default Funds have become more risky over recent years?

And how are Investment Committees addressing the limitations of market indices?  Particularly those who blindly follow them.

It worries me with the high concentration of international fixed interest in the KiwiSaver Default Funds.  There is a lot of room for disappointment.


Many institutional investors understand that true portfolio diversification does not come from investing in many different asset classes but comes from investing in different risk factors.  See earlier post More Asset Classes Does not Equal More Diversification.

The objective is to implement a portfolio with exposures to a broad set of different return and risk outcomes

True portfolio diversification is achieved by investing in different risk factors that drive the asset classes e.g. duration, economic growth, low volatility, value, and growth.


An example of the benefits of this approach is very evident in fixed interest.

As we know, duration is a key risk factor that drives fixed interest securities. (Duration is a measure of a fixed interest securities price/value sensitivity to changes in interest rates.  The longer the duration e.g. 10 years, the great the securities price sensitivity and change in value from movements in interest rates i.e. a 90 day cash security has very little duration risk and value sensitivity to changes in interest rates.  Lastly, as interest rates increase the price/value of a fixed interest security falls.  Conversely if interest rates fall the price rises.)


Fixed interest indices have become more risky over the last 10 years.  Not because interest rates have reached historical lows.  Many have predicted we witnessed the end of a 35 year bull market in fixed interest markets last year.

The duration of most international fixed interest indices has increased over the last 10 years.  Duration being the measure of risk.

Therefore, fixed interest indices have become more risky from an interest rate perspective given an increase in duration.


By way of example, the duration of most international fixed interest indices have increased by 1.5 – 2 years over the last 8-10 years.

In a recent piece by Blackstone they noted the duration of the Bloomberg Barclays Agg Bond Index moved from 4.4 years in 2016 to 6.3 years (as of 5/2018).

Blackstone also noted that the biggest risk to investors is not recognizing that the data changed. History proves bond yields do move higher.


What does this mean for a number of the Kiwisaver Default Funds that have around 30% of their portfolio invested in international fixed interest?

In 2008, a 30% allocation to international fixed interest meant a duration contribution to a multi-asset portfolio of 1.65 years, assuming an index duration of 5.5 years.

In 2018, the 30% allocation to international fixed interest means a duration contribution to a multi-asset portfolio of 2.1 years, assuming an index duration of 7.0 years.

Therefore, the duration risk of the portfolio has increased by around half a year, an increase of almost a third.

As a result the multi-asset portfolio has become more volatile to movements in interest rates.


So what can be done?

  1. A new index with a lower duration could be used. It would need to be 5.5 years to bring the multi-asset portfolio’s risk back to levels displayed in 2008, all else equal.
  1. The portfolio allocation to global fixed interest could be reduced. The multi-asset portfolio weighting would need to be reduced to 24% from 30%, a reduction of 6%, to bring the portfolio’s duration risk back to the levels displayed in 2008, all else equal.
  1. A combination of the above.


However, on all occasions, Portfolio risk has been brought back to levels of 10 years ago.  Further action would be required if one had a negative view on the outlook for interest rates and wanted to de-risk the portfolio further.  Noting we are probably at the end of 35 year bull market in fixed interest.


This issue is often exasperated further by increasing the multi-assets portfolio’s allocation to Listed Property and Infrastructure as a means to increase yield, given a reduction in interest rates.  Listed property and infrastructure are interest rate sensitive sectors of the equity markets.

Therefore, increasing allocations to these sectors often only increases portfolio duration risk and equity risk at the same time.  Not great if interest rates increase sharply, as they have over the last year internationally.

Portfolio risk has not been reduced if a factor focused approach is taken.  A new asset class does not necessarily reduce portfolio risk, despite what a portfolio optimisation model may say!


In conclusion, and the key point, it is not how much international and NZ Fixed Interest to allocate to within a portfolio that is important.  What is importnat is how much duration risk should the portfolio have in meeting its investment objectives.

Investment committees should not be debating the level of allocation to international or NZ fixed interest without first considering what is the most appropriate level of portfolio duration risk to target.  This is a different conversation and focus.

Implementation of the duration target can then be made in relation to the international and NZ fixed interest allocation split.  An issue in this consideration is that NZ investors have NZ liabilities e.g. NZ inflation risk

This is a subtle but an important shift in thinking to build more robust portfolios.


Happy investing.


Please see my Disclosure Statement

Global Investment Ideas from New Zealand. Building more Robust Investment Portfolios.

Disaggregation of Investment Returns

Understanding the disaggregation of investment returns can assist in building a truly diversified and robust investment portfolio.

It can also help determine the appropriateness of fees being paid and if a manager is adding value.


Many institutional investors understand that true portfolio diversification does not come from investing in many different asset classes but comes from investing in different risk factors. More Asset Classes Does not Equal More Diversification.

The objective is to implement a portfolio with exposures to a broad set of different return and risk outcomes.  The increasing allocation to alternative investment strategies by institutional investors globally, such as hedge fund strategies, to complement more traditional investments is evidence of this.  Alternative strategies are added so as to reduce overall portfolio volatility, resulting in a more attractive portfolio risk return profile.

The inclusion of alternative strategies can assist in providing greater probability in meeting investment objectives.


An understanding of the different return and risk outcomes can be gained by disaggregating investment returns.

Essentially, and from a broad view, investment returns can be disaggregated in to the following three parts:

  1. Market beta. Think equity market exposures to the NZX50 or S&P 500 indices (New Zealand and America equity market exposures respectively).  Market Index funds provide market beta returns i.e. they track the returns of the market e.g. S&P 500 and NZX50
  2. Factor betas and Alternative hedge fund beta exposures.  Of the sources of investment returns these are a little more ambiguous and contentious than the others.  This mainly arises from use of terminology and number of investable factors that are rewarding.  My take is as follows, these betas fit between market betas and alpha.
    1. Factor Beta exposures.  These are the factor exposures for which I think there are a limited number.  The common factors include value, momentum, low volatility, size, quality/profitability, carry.  These were outlined in this blog and are often referred to as Smart beta – see diagram below.
    2. Alternative hedge fund betas.  Many hedge fund returns are sourced from well understood investment strategies.  Therefore, a large proportion of hedge fund returns can be explained by common hedge fund risk exposures, also known as hedge fund beta or alternative risk premia or risk premia.  Systematic, or rule based, investment strategies can be developed to capture a large portion of hedge fund returns that can be attributed to a hedge fund strategy (risk premia) e.g. long/short equity, managed futures, global macro, and arbitrage hedge fund strategies.  The alternative hedge fund betas do not capture the full hedge fund returns as a portion can be attributed to manager skill, which is not beta and more easily accessible, it is alpha.


Lastly, and number three, there is Alpha.  Alpha is what is left after beta.  It is manager skill.  Alpha is a risk adjusted measure. In this regard, a manager outperforming an index is not necessarily alpha.  The manager may have taken more risk than the index to generate the excess returns, they may have an exposure to one of the factor betas or hedge fund betas which could have been captured more cheaply to generate the excess return.  In short, what is often claimed as alpha is often explained by the factor and alternative hedge fund betas outlined above.  Albeit, there are some managers than can deliver true alpha.  Nevertheless, it is rare.


These broad sources of return are captured in the diagram below, provided in a recent hedge fund industry study produced by the AIMA (Alternative Investment Management Association).

Another key distinction, in the most beta and factor betas are captured by investing long (i.e. buying securities and holding) while alternative hedge fund betas are captured by going both long and short and generally being market neutral i.e. having a limited exposure to market betas e.g. equity market risk.

The framework above is also useful for a couple of other important investment considerations.  We can use this framework to determine:

  1. Appropriateness of the fees paid. Obviously for market beta low fees are paid e.g. index fund fees.  Fees increase for the factor betas and then again for the alternative hedge fund betas.  Lastly, higher fees are paid to obtain alpha, which is the hardest to produce.
  1. If a manager is adding value – this was touched on above. Can a manager’s outperformance, “alpha”, be explained by “beta” exposures, or it truly unique and can be put down to manager skill.


Lastly, and most importantly, to obtain a truly diversified portfolio, a robust portfolio should have exposures to the different return and risk sources outlined above.

Accessing the disaggregation of investment returns has come increasingly available due to advancements in technologies and the lowering of transaction costs.  It is also having a fundamental impact on the global funds management industry, including hedge funds.

Furthermore, the determination of institutional investors to pay appropriate fees for return sources has witnessed the development of investment strategies that appropriately match fees for sources of return and risk.

Happy investing.


Return aggregation


Please see my Disclosure Statement


Factor Investing Portfolio Construction

Following on from my last post on Factor Investing this article provides some good insights into the implementation of a factor portfolio.

The article makes a few key points:

  1. The best way to capture the different factors is through diversification i.e. diversify across the different factors: value, momentum, size, minimum volatility and quality. Avoid having a single factor exposure.
  1. Although factors work, their performance vary greatly given different underlying financial and economic environments (macro environment).
  1. It is difficult to pick when the macro environment will change to the benefit or otherwise of an individual factor. Therefore, successfully under or over weighting a factor to expected changes in the macro environment offers little value add.  It is nevertheless likely to be more fruitful than making country and sector allocations shifts based on anticipated changes in the macro environment.
  1. There are a number of approaches to constructing a factor portfolio. Most often implemented are equally weighted approach (i.e. equal allocation to each factor) and risk weighted approach.  Risk weighted, in simple terms, starts with an equally weighted portfolio, then reduces the portfolio allocation to the higher risk factors e.g. more volatile factors, and increases the portfolio allocation to the less risky factors (in practice this is a more sophisticated and technically advanced approach).  Whichever approach is implemented, it needs to be consistent with Investor’s risk appetite and investment objectives.

The implementation of a robust factor portfolio is more complicated than outlined above.  There are a number of nuances that need to be considered e.g. level of portfolio turnover and redundancy of portfolio holdings i.e. a portfolio holding could enhance one factor but dilute another factor exposure.


Finally, the article makes a key point, this applies in any portfolio, robust portfolio construction is the key to success in Factor Investing.

True portfolio diversification isn’t easy.  Many portfolios have lots of asset classes, this does not mean they have more diversification.  See More Asset Classes Does not Equal More Diversification, the failings of diversification.

A more robust portfolio is achieved through factor allocation than say sector allocations, so long as there is a broad set of factors to invest in.


Please see my Disclosure Statement

Factor Investing

Factoring Investing, along with Alternative Investment Strategies, true portfolio diversification, Goal Based Investing (Liability Driven Investing), building robust investment portfolios, behavioural economics, and Responsible Investing, will be key themes of future blogs.

I thought this was a good article to cover as the first blog on Factor Investing:  The Case For Adding Factors To Your Portfolio.

This is a good article for those new to Factor Investing or at the beginning of considering the addition of factor exposures into a portfolio.  There are many articles like this from other provides.


A few of key points from the article:

  1. A factor can be thought as any characteristic relating a group of securities that is important in explaining their return and risk.
  1. Factor Investing is not new. It has been around for sometime within the industry, Value and Growth in the old days.  The drivers of value and momentum have been recognised by academics and professionals for decades.

What has changed, particularly over the last 5 years, is the technology that makes it easier and cheaper to capture market factors.

  1. There are not that many rewarding factors, Value, Quality, Momentum, Size and Minimum volatility are the most robust, Carry is another (I’ll blog separately on what each of these are).

Most of these factors can be found across most “asset classes” e.g. equities, fixed interest, commodities and currencies.

  1. Factors exposures can be used to determine if an active manager is adding true excess returns (alpha – risk adjusted excess returns), or just providing a market factor exposure which can be gained cheaply. It is a tough environment for active investors, they are being squeezed by passive index funds and cheaper factor funds (sometime referred to as smart beta strategies).  Albeit, a high level of sophistication is required in developing an effective factor investment strategy.
  1. Factor investing can deliver more efficient portfolios. This means better reward for risk taken.  Well-constructed factor investment strategies eliminate or reduce the exposure to unwanted and un-reward market risks. The article uses an America’s Cup analogy of reducing frictions to make the boat go faster– note New Zealand is the current holder of the America’s Cup.

Therefore, factor investment strategies can provide a more efficient portfolio outcome than selecting Industry Sectors or active management by way of example.

  1. Not all factors will perform equally well at every moment. Factors can underperform the wider and broader equity market and the other factors for long periods of time e.g. the Value factor has underperformed the broader global equity index for about 10 years currently!

Therefore, diversification across the factors is often recommended.


From a more advanced perspective, a portfolio that invests across multiply factors across multiply asset classes, and that can invest both long and short, e.g. go long stocks with favourable rewarding factors and sell short those stocks that do not display the rewarding factors, is likely the most efficient means of factor investing.  Such a strategy could well make up an allocation within a Liquid Alternatives Investment Strategy.


As an aside and not to confuse:

The above factors e.g. value, momentum and carry are factors that can be used to explain the drivers of securities within an asset classes e.g. equities fixed interest, and currencies

There are also macro factors, these explain at a higher level what drives a multi-asset portfolio.  Macro factors can explain more than 90% of returns across a multi-asset portfolio.  These macro factors can be used to determine an appropriate allocation to the different asset classes e.g. equities versus fixed interest exposures given preferred risk tolerance and investment objectives.

Macro factors include, economic growth, real interest rates, inflation, credit, emerging markets, and liquidity.  This is a topic for a future blog.


Please see my Disclosure Statement