The FMA’s 2026 KiwiSaver Annual Report: private assets and liquidity in focus

The FMA published its KiwiSaver Annual Report for the year to 31 March 2026 last month, and it is worth reading in its own right.

In her foreword, the FMA’s Head of Investment Management points to two developments singled out over the year, a growing presence of private assets in KiwiSaver portfolios and managers lifting their liquidity risk management practices following the FMA’s 2024 guidance.

Those two threads happen to follow on directly from previous KiwiInvestor Blog posts. They pick up the funds flow and accumulation story from my last post, Beyond the transfer headlines, and they update the review I did in April on how private assets are being valued and governed across New Zealand’s managed funds. See links below.

A quick recap of the Annual Report first, before getting into the private assets and liquidity detail.

The year in brief

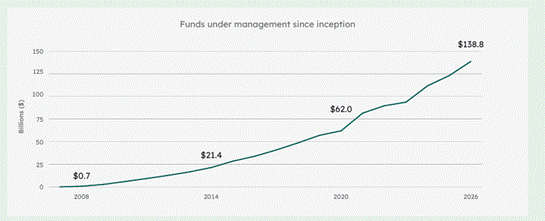
  • Total KiwiSaver funds under management reached $138.8 billion as at 31 March 2026, up 12.8 per cent for the year. Graph from the FMA.
  • Membership reached 3.44 million, up 1.6 per cent. The average balance crossed $40,000 for the first time, up 11 per cent, mostly on the back of a strong year for investment returns.
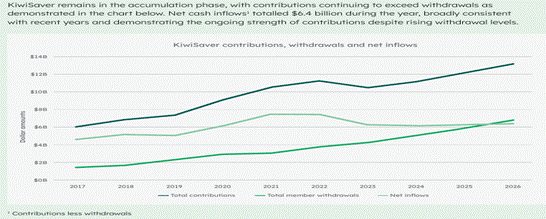
  • Contributions hit a record $13.2 billion, up 8.2 per cent. Member contributions did most of the work, up 11.1 per cent to $8.7 billion and now close to two thirds of the total.
  • Withdrawals reached a record $6.8 billion, up 15.7 per cent. First home withdrawals alone totalled $2.2 billion across more than 50,000 members. Graph from the FMA.
  • Total fees reached $978 million, up 12.6 per cent, broadly tracking the growth in funds under management, so the fee to FUM ratio held steady at around 0.7 per cent.

None of that changes the accumulation phase story from my last post. It just fills in the picture a little.

Now to two areas of focus in this year’s FMA report

Private assets in KiwiSaver

The FMA surveyed Managed Investment Scheme managers again this year to understand their exposure to private assets and how they are valuing them. Among managers that reported holding private assets at all, allocations within retail funds averaged less than 5 per cent of assets under management.

On where the exposure actually sits, direct investment is concentrated in real estate equity, private debt, private equity and real estate debt.

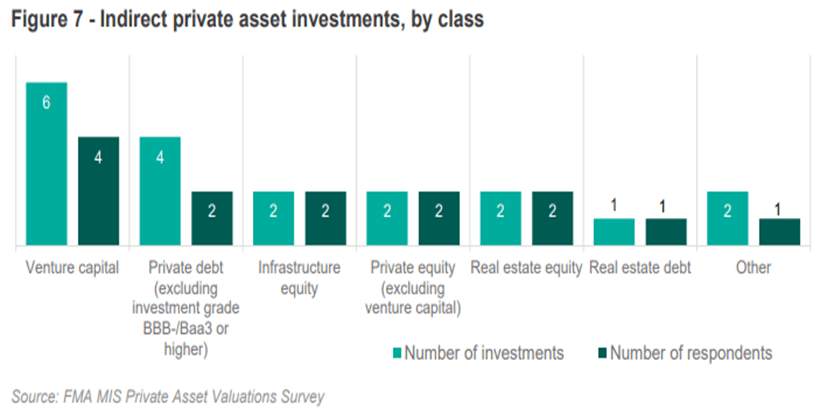
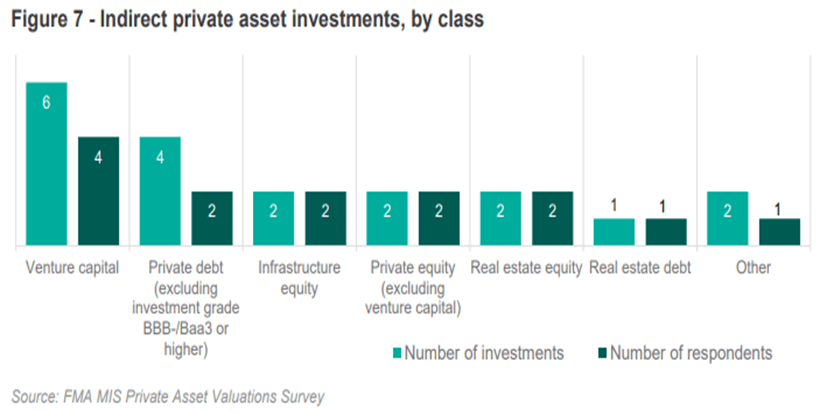
Indirect investment, which managers reported as the more common route in, leans toward private equity, private debt and infrastructure equity, with growing interest in venture capital.

Governance around this exposure looks reasonably mature. Most managers reported using internationally recognised valuation standards, independent valuers for directly held assets, multiple valuation methodologies to cross check results, and a clear separation between who prepares a valuation and who approves it.

The FMA’s own areas for continued attention are valuation frequency, the processes around out of cycle valuations when markets move suddenly, and limited visibility some managers have over the assumptions underlying indirectly held asset valuations.

Liquidity risk management, a genuine uplift

The FMA published its liquidity risk management guide in April 2024, and this year’s report is the first real progress check against it. The finding is a positive one.

Supervisory engagement shows a clear uplift in practice across the sector since the 2024 guide was published. Board approved frameworks are now the norm rather than the exception, and liquidity risk management is becoming more integrated into broader risk and compliance processes rather than sitting off to the side.

The FMA is careful to frame what remains as refinement rather than a structural gap, better defined escalation triggers, more developed stress testing, and clearer sequencing for how liquidity tools would actually be deployed if needed.

Stress testing in particular is flagged as one of the harder areas to get right, given the data limitations and judgement calls involved in designing meaningful scenarios.

Modelling forward, not just testing backward

This is the part I think deserves more attention.

The FMA’s guide requires stress testing against large withdrawals and extreme but plausible market conditions, both backward looking historical scenarios and forward looking hypothetical ones. What it does not explicitly require is forward modelling of a scheme’s own net fund flows, growth as well as decline, under a range of future scenarios.

That gap matters more as private market allocations increase. A private market allocation is typically set and monitored as a percentage of total funds under management. If net contributions slow, plateau or reverse for a period, while the underlying private commitments stay largely fixed in dollar terms and illiquid, that percentage can drift upward without a manager doing anything at all. KiwiSaver’s current accumulation phase makes this feel like a remote risk. It should not be assumed to hold indefinitely, and a scheme built around the assumption that inflows will always be there is not well governed.

In my view, none of this requires new regulation to justify it. It sits comfortably within the governance, liquidity management and valuation focus the FMA already has, in its 2024 guide and again in this year’s Annual Report. Large KiwiSaver managers increasing their private market allocations would do well to have this modelling in place well ahead of any FMA expectation that they do so.

Why this matters

New Zealand still lags Australia meaningfully on private market allocation within retirement savings, a gap I have written about before on this blog. Closing that gap sensibly requires the governance behind it to keep pace with the allocations themselves. On the evidence in this report, valuation practice and liquidity risk management are both moving in the right direction.

The FMA puts its own expectation simply. Providers, it says, should ensure their “valuation, liquidity, governance and disclosure arrangements remain appropriate” as private asset exposure continues to grow. That is a fair summary of everything covered above, and a reasonable bar for any manager to hold itself to.

This is the second post in a short series working through KiwiSaver’s 2026 numbers in some depth. The next will turn to a more specific question sitting behind much of this discussion, whether side pockets have a place in KiwiSaver as private asset allocations grow. Worth checking back for.

Further reading

For the original review of the FMA’s private assets survey, see FMA report on private assets in New Zealand managed funds.

For the funds flow and market share context behind this post, see Beyond the transfer headlines.

Source: FMA KiwiSaver Annual Report 2026.

Disclosure

Please read the Kiwi Investor Blog Disclosure Statement before relying on any information in this post. This blog is written for information and discussion purposes only. Nothing in this post constitutes financial advice. All investment strategies involve risk, including the loss of principal. Readers should seek independent financial advice before making any investment decisions. The views expressed in this post are my own and do not represent the views of my employer or any organisation with which I am affiliated.
Beyond the transfer headlines: why KiwiSaver’s accumulation story matters more than the league table

The FMA’s 2026 Annual Report and the newly released KiwiSaver XIX report from Investment News NZ both pointed to a sharp rise in scheme transfers, and the coverage since has focused almost entirely on who is winning and who is losing that competition.

This post focusses on the KiwiSaver XIX report, a post on the FMA’s 2026 Annual Report will follow.

Milford took $2.0 billion in net transfers this year, a record. ANZ lost $974 million and close to 20,000 members from its competitors.

The big five providers (ANZ, ASB, Fisher, Milford, Westpac) collectively lost market share again, their combined slice of total funds under management slipping from 64.4 per cent to 62.8 per cent.

That story is true, and worth understanding.

It is not, however, the whole picture. The part that tends to get left out matters more for how a KiwiSaver provider actually manages money, and it is worth exploring.

The system is still in accumulation

Zoom out from the competitive scoreboard and the more important number is this: total KiwiSaver funds under management reached $138.8 billion as at 31 March 2026, up 12.8 per cent for the year.

That growth was driven by contributions of $13.2 billion, comfortably ahead of withdrawals of $6.8 billion. Net cash inflow, contributions less withdrawals, was $6.4 billion.

The FMA put it plainly in its own Annual Report: KiwiSaver, “remained firmly in the accumulation phase.”

Transfers reshuffle the deck, they don’t shrink it

This is where the ANZ example becomes useful.

ANZ was one of the biggest net losers of members and dollars to competitors this year. But ANZ’s three KiwiSaver schemes still grew total funds under management by $1.1 billion, a 5.3 per cent increase, over the same twelve months. Contributions and investment returns more than covered the transfer losses.

It is not a one-off. ASB held its market share almost flat, shedding only 0.1 percentage points, while still growing funds under management by $2.1 billion, one of the largest nominal increases of any provider this year.

A provider can be a clear loser in the transfer competition and still be managing a growing pool of assets. Both things are true at once, and a headline built only around the first one is incomplete.

As the KiwiSaver XIX report notes, “The big-end of KiwiSaver town can keep shedding members at the current rate for many years yet, however, while still growing assets under management on the back of mandated flows and, in good times, investment returns.”

Why this distinction matters for fund management

A provider planning liquidity has to think in terms of gross flows, not net ones.

Contributions, transfers in, transfers out and benefit payments all move independently, on different timeframes, and often for different reasons.

The fact that the system as a whole is comfortably cash flow positive is a reassuring backdrop, but it says very little about the timing or concentration of outflows any single scheme might face in a given month or quarter.

That distinction sharpens considerably once a scheme holds meaningful exposure to illiquid assets, private equity, private debt, unlisted infrastructure and the like.

A private asset holding does not care whether the system overall is growing. It cares whether the scheme that holds it can meet redemptions and transfers without being forced to sell at the wrong time.

I have written previously about the case for alternatives in a well-diversified portfolio, and about the FMA’s recent work reviewing how private asset valuation and governance is being handled across the industry. See Post links below.

Both asset valuations and governance are worth revisiting with this point in mind, and I will return to the liquidity side of that picture, and what the FMA’s Annual Report says about it, in a follow-up post.

Modelling future flows should be standard practice

The FMA’s liquidity risk management guide requires stress testing against large withdrawals and extreme but plausible market scenarios. What it does not explicitly require is forward modelling of a scheme’s own net fund flows, growth as well as decline, under a range of future scenarios. That is a gap worth closing before the regulator closes it for you.

This matters more as private market allocations increase. A private market allocation is normally set and monitored as a percentage of total FUM. If net contributions slow, plateau, or reverse for a period, while the underlying private commitments remain largely fixed in dollar terms and illiquid, that percentage can drift upward without the manager doing anything at all. The current accumulation phase makes this feel like a remote risk. It should not be assumed to hold indefinitely.

I have managed portfolios with meaningful private market exposure where this kind of modelling was undertaken. The base case for these portfolios was a decline in FUM over time. A framework to actively manage private market exposures down over time was built to keep the portfolio within target limits. It is a straightforward discipline to build in advance. It is considerably harder to build in the middle of a liquidity event.

None of this requires new regulation to justify it. It is consistent with the governance, liquidity management and valuation focus the FMA already has in its 2024 guide and this year’s Annual Report.

Large KiwiSaver managers increasing private market allocations would do well to have this modelling in place well ahead of any FMA expectation that they do so.

A cushion, not a guarantee

None of this is an argument that KiwiSaver providers can be complacent about liquidity.

The accumulation phase gives the industry room to absorb competitive churn today, but it is a point-in-time observation about the system, not a permanent feature of it, and not a substitute for genuine liquidity planning at the individual scheme level.

The lesson from this year’s data is not that transfers don’t matter. It is that the transfer story and the growth story are two different things, and a provider, or an investor, who only follows the first is missing half the picture.

Further reading

For more on how alternatives fit into a well-diversified portfolio, see A Framework for Including Alternatives into a Portfolio.

For the FMA’s recent review of how private asset valuation and governance is being handled across New Zealand managed funds, see FMA report on private assets in New Zealand managed funds.

FMA Liquidity Management Guide: Liquidity risk management guide

Sources: FMA KiwiSaver Annual Report 2026, and KiwiSaver XIX, Investment News NZ

Disclosure

Please read the Kiwi Investor Blog Disclosure Statement before relying on any information in this post. This blog is written for information and discussion purposes only. Nothing in this post constitutes financial advice. All investment strategies involve risk, including the loss of principal. Readers should seek independent financial advice before making any investment decisions. The views expressed in this post are my own and do not represent the views of my employer or any organisation with which I am affiliated.
FMA report on private assets in New Zealand managed funds

The FMA does a lot of good work, and their recently released report, Private assets in managed funds – Investment landscape and valuation practices (April 2026), is a good example of that. In my view this is a timely report in the evolution of the New Zealand investment industry. Private markets will play an increasing role within portfolios across the sector, including KiwiSaver funds, and the FMA will have an important role to play as the industry matures and these asset classes become more mainstream.

You can access the full report here.

As private asset allocations grow globally and as interest from local fund managers increases understanding current practices and where risks may emerge is useful groundwork. This is also relevant with the growth in New Zealand’s Active Investor Plus (AIP) programme (the investment visa category designed to attract capital into New Zealand).

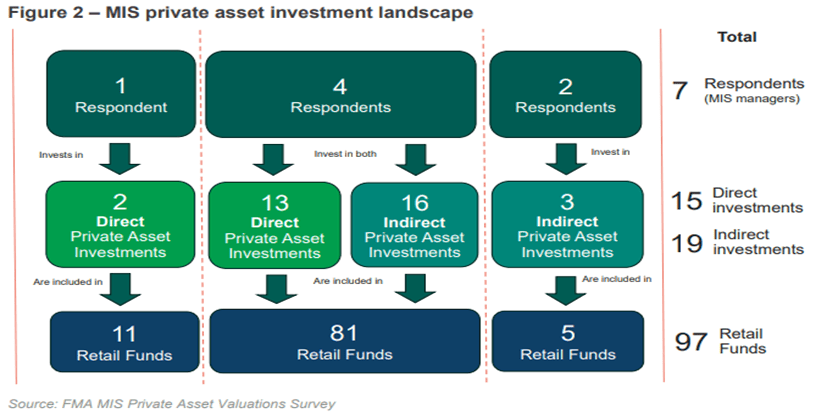
The FMA surveyed 30 managed investment scheme (MIS) managers in July 2025, with 16 responding. Of those, seven reported some exposure to private assets.

What are private assets?

Private assets are investments not traded on public exchanges. They span five main categories: private equity (shares in unlisted companies), venture capital, private debt (credit), private real estate, and private infrastructure.

Globally, private markets have grown dramatically, more than tripling over the past decade to around $15 trillion and are forecast to double again in the coming decade.

Historically, access to private assets has been the domain of large institutional investors: sovereign wealth funds, endowments, and superannuation funds. But technological and regulatory developments are steadily opening these markets to retail investors, with the retail share of private markets estimated to rise dramatically by 2032.

New Zealand’s current exposure to private assets is low

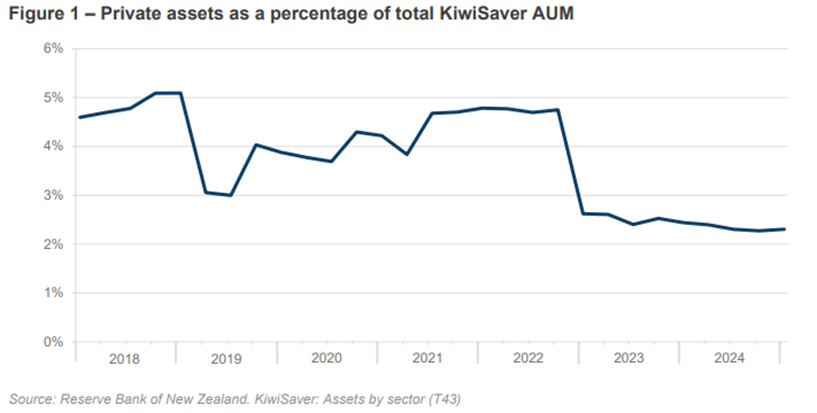
Private assets represent just 2.4% of total KiwiSaver assets under management as at the June 2025 quarter. For context, Australian pension funds allocate around 16% to private assets. Among the funds surveyed that do hold private assets, the average allocation sits under 5% of total assets under management, with 82% of those funds below a 10% allocation.

Figure 1 from the FMA report is presented below. “Private assets as a percentage of total KiwiSaver AUM”.

All graphs in this Blog post are from the FMA report.

Investment in private assets is growing, but from a very low base

Five of the seven managers with private asset exposure have been investing in them for at least five years, suggesting this is a considered long-term strategy rather than a recent trend. Six of those seven plan to expand their allocations over the next three years. A further three managers currently without private asset exposure indicated they may begin investing in them.

How are managers gaining their private asset exposure?

Managers access private assets either directly (holding the asset themselves) or indirectly through third-party fund managers. Most of those investing in private assets use both approaches.

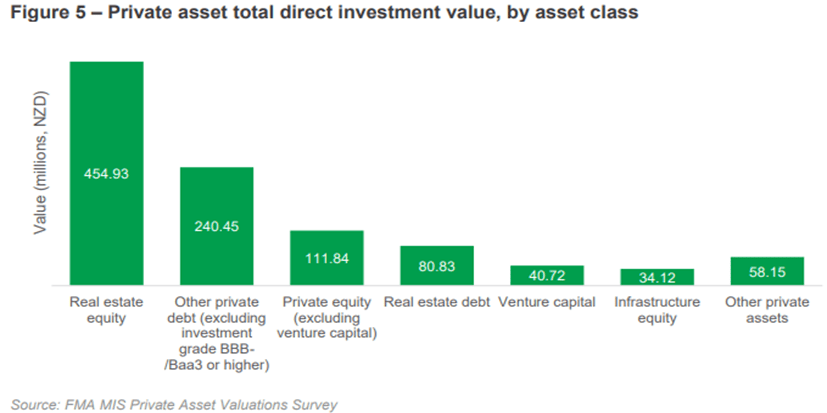
Direct investments are larger in total value, over $1 billion disclosed. Real estate equity is the dominant asset class at over $450 million, followed by private debt and private equity.

Indirect investments are more varied, with venture capital gaining traction in recent years, though average investment values remain modest at around $9 million per holding. Despite having the most investments by number, private equity dominates indirect holdings by value at over $162 million.

What did the FMA find on valuation practices?

Valuation of private assets is more complex than for listed investments. There is no daily market price for private assets like there is for public securities listed on sharemarkets and for debt securities traded over the counter.

Private assets managers use methodologies such as income-based, market-comparable, or asset-based approaches.

For directly held private assets, most managers are using independent valuers, cross-checking valuations using multiple methodologies, and maintaining separation of duties between those preparing and those approving valuations. Most are also following internationally recognised guidelines such as the IPEV (International Private Equity and Venture Capital Valuation) guidelines.

For indirectly held assets, most managers make valuation methodology an important part of their due diligence on third-party managers, and have processes to test the reasonableness of valuations they receive.

The FMA identified several areas worth monitoring as allocations increase:

  • Some private assets are only valued annually, creating the risk of stale pricing, particularly for investors transacting just before or after a valuation date. Quarterly appears to be the emerging international standard.
  • Not all managers have formal provision for out-of-cycle valuations, which is a gap given the requirement for daily unit pricing in KiwiSaver.
  • For some indirect holdings, managers have limited visibility over the inputs and assumptions used by third-party valuers.
  • Investor communication about how private asset valuations flow through to unit prices is inconsistent, only three of six managers with indirect holdings said they regularly communicate with investors on this.

Why this matters for New Zealand investors

As this blog has covered extensively, New Zealand investors have historically had very limited exposure to private assets (private equity, infrastructure, private debt, and real assets) that have underpinned strong long-run performance from the world’s leading endowment funds, sovereign wealth funds, and superannuation schemes.

The gap with Australia remains significant. At 2.4% versus roughly 16%, this is a structural difference in how retirement savings are invested. Whether that gap closes, and how quickly, will depend on fund managers being confident they have the right governance, valuation, and risk management frameworks in place to do it well. Therefore, the FMA report is a timely and useful contribution to that conversation.

The direction of travel is clear. Six of seven managers surveyed plan to grow their private asset allocations, and global private markets continue to expand. Getting the foundations right now, while allocations are still modest, is the sensible approach.

Relevance for New Zealand’s Active Investor Plus programme

This report also has direct relevance for participants in New Zealand’s Active Investor Plus (AIP) programme, the investment visa category designed to attract growth-oriented capital into New Zealand.

The AIP programme’s Growth category is heavily weighted toward private markets. Eligible investments include private equity, private debt, and venture capital, the asset classes that sit at the heart of this FMA report. For many AIP investors, managed funds investing in these areas are a natural and practical pathway to meeting their investment requirements, and the amounts flowing into this part of the New Zealand funds management industry are growing significantly.

That growth matters beyond the AIP programme itself. The capital flowing in through this channel is helping to build the scale and capability of New Zealand’s private equity and private debt managers. Private debt in particular stands to benefit. As local managers build longer track records, deeper expertise, and more robust operational infrastructure, including the valuation governance frameworks examined in this FMA report, the asset class becomes more credible and accessible for a broader range of Kiwi investors.

This has important long-term implications. A more developed and well-governed private markets sector in New Zealand creates the conditions for greater acceptance of these asset classes within KiwiSaver funds and client portfolios more broadly. The hurdles to inclusion, concerns around illiquidity, valuation complexity, and governance, become easier to address as the industry matures. In that sense, the AIP programme is not just meeting the needs of a specific category of investor; it has the potential to contribute to the development of a more diversified and sophisticated investment ecosystem that will ultimately benefit all New Zealand investors.

That makes the FMA’s decision to examine valuation practices now, before allocations grow substantially within KiwiSaver, well timed. A well-functioning private markets sector is in the interests of all participants, including the growing number of AIP investors who are making New Zealand private assets a meaningful part of their portfolios in some instances.

Further reading: why Kiwi investors may be missing out

If you’d like to understand more about the case for alternatives, which includes private assets, in a diversified portfolio, and why New Zealand investors have historically been underexposed, the following posts from the Kiwi Investor Blog are worth revisiting:

A framework for including alternatives in a portfolio — Provides a practical framework for thinking about how alternative assets, including primate markets, can be incorporated into a diversified portfolio. Covers the key considerations around asset class selection, portfolio construction, and implementation, and makes the case for why a structured and deliberate approach to alternatives, rather than ad hoc allocations, is more likely to deliver the diversification and return benefits that these asset classes can offer.

Are KiwiSaver Funds, NZ Endowments, and Family Offices missing out on the benefits of Private Investment?  Makes the case that KiwiSaver funds are significantly underweight private investments and alternatives relative to Australian peers, and the implications for long-run portfolio performance.

KiwiSaver Balanced Fund strategic asset allocation analysis  A detailed look at how New Zealand balanced funds are constructed, showing the heavy reliance on equities as the dominant growth driver, contrasted with the more diversified approach of comparable Australian funds.

Optimal private equity allocation  Covers research on building and maintaining a private equity allocation within a well-diversified portfolio, and why many KiwiSaver providers may be overestimating their liquidity constraints.

Adding alternatives to an investment portfolio  A foundational post on the diversification benefits of alternatives, covering downside protection and the case for broadening asset class exposure beyond traditional equities and fixed income.

Disclosure

Please read the Kiwi Investor Blog Disclosure Statement before relying on any information in this post. This blog is written for information and discussion purposes only. Nothing in this post constitutes financial advice. All investment strategies involve risk, including the loss of principal. Readers should seek independent financial advice before making any investment decisions. The views expressed in this post are my own and do not represent the views of my employer or any organisation with which I am affiliated.