The FMA published its KiwiSaver Annual Report for the year to 31 March 2026 last month, and it is worth reading in its own right.
In her foreword, the FMA’s Head of Investment Management points to two developments singled out over the year, a growing presence of private assets in KiwiSaver portfolios and managers lifting their liquidity risk management practices following the FMA’s 2024 guidance.
Those two threads happen to follow on directly from previous KiwiInvestor Blog posts. They pick up the funds flow and accumulation story from my last post, Beyond the transfer headlines, and they update the review I did in April on how private assets are being valued and governed across New Zealand’s managed funds. See links below.
A quick recap of the Annual Report first, before getting into the private assets and liquidity detail.
The year in brief
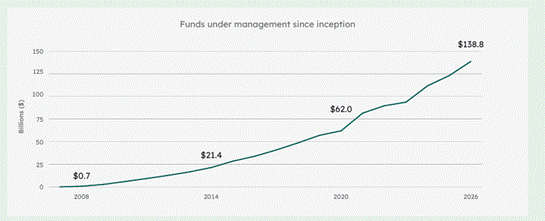
- Total KiwiSaver funds under management reached $138.8 billion as at 31 March 2026, up 12.8 per cent for the year. Graph from the FMA.
- Membership reached 3.44 million, up 1.6 per cent. The average balance crossed $40,000 for the first time, up 11 per cent, mostly on the back of a strong year for investment returns.
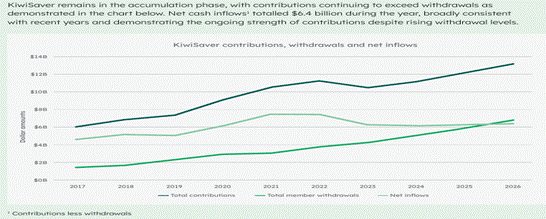
- Contributions hit a record $13.2 billion, up 8.2 per cent. Member contributions did most of the work, up 11.1 per cent to $8.7 billion and now close to two thirds of the total.
- Withdrawals reached a record $6.8 billion, up 15.7 per cent. First home withdrawals alone totalled $2.2 billion across more than 50,000 members. Graph from the FMA.
- Total fees reached $978 million, up 12.6 per cent, broadly tracking the growth in funds under management, so the fee to FUM ratio held steady at around 0.7 per cent.
None of that changes the accumulation phase story from my last post. It just fills in the picture a little.
Now to two areas of focus in this year’s FMA report
Private assets in KiwiSaver
The FMA surveyed Managed Investment Scheme managers again this year to understand their exposure to private assets and how they are valuing them. Among managers that reported holding private assets at all, allocations within retail funds averaged less than 5 per cent of assets under management.
On where the exposure actually sits, direct investment is concentrated in real estate equity, private debt, private equity and real estate debt.
Indirect investment, which managers reported as the more common route in, leans toward private equity, private debt and infrastructure equity, with growing interest in venture capital.
Governance around this exposure looks reasonably mature. Most managers reported using internationally recognised valuation standards, independent valuers for directly held assets, multiple valuation methodologies to cross check results, and a clear separation between who prepares a valuation and who approves it.
The FMA’s own areas for continued attention are valuation frequency, the processes around out of cycle valuations when markets move suddenly, and limited visibility some managers have over the assumptions underlying indirectly held asset valuations.
Liquidity risk management, a genuine uplift
The FMA published its liquidity risk management guide in April 2024, and this year’s report is the first real progress check against it. The finding is a positive one.
Supervisory engagement shows a clear uplift in practice across the sector since the 2024 guide was published. Board approved frameworks are now the norm rather than the exception, and liquidity risk management is becoming more integrated into broader risk and compliance processes rather than sitting off to the side.
The FMA is careful to frame what remains as refinement rather than a structural gap, better defined escalation triggers, more developed stress testing, and clearer sequencing for how liquidity tools would actually be deployed if needed.
Stress testing in particular is flagged as one of the harder areas to get right, given the data limitations and judgement calls involved in designing meaningful scenarios.
Modelling forward, not just testing backward
This is the part I think deserves more attention.
The FMA’s guide requires stress testing against large withdrawals and extreme but plausible market conditions, both backward looking historical scenarios and forward looking hypothetical ones. What it does not explicitly require is forward modelling of a scheme’s own net fund flows, growth as well as decline, under a range of future scenarios.
That gap matters more as private market allocations increase. A private market allocation is typically set and monitored as a percentage of total funds under management. If net contributions slow, plateau or reverse for a period, while the underlying private commitments stay largely fixed in dollar terms and illiquid, that percentage can drift upward without a manager doing anything at all. KiwiSaver’s current accumulation phase makes this feel like a remote risk. It should not be assumed to hold indefinitely, and a scheme built around the assumption that inflows will always be there is not well governed.
In my view, none of this requires new regulation to justify it. It sits comfortably within the governance, liquidity management and valuation focus the FMA already has, in its 2024 guide and again in this year’s Annual Report. Large KiwiSaver managers increasing their private market allocations would do well to have this modelling in place well ahead of any FMA expectation that they do so.
Why this matters
New Zealand still lags Australia meaningfully on private market allocation within retirement savings, a gap I have written about before on this blog. Closing that gap sensibly requires the governance behind it to keep pace with the allocations themselves. On the evidence in this report, valuation practice and liquidity risk management are both moving in the right direction.
The FMA puts its own expectation simply. Providers, it says, should ensure their “valuation, liquidity, governance and disclosure arrangements remain appropriate” as private asset exposure continues to grow. That is a fair summary of everything covered above, and a reasonable bar for any manager to hold itself to.
This is the second post in a short series working through KiwiSaver’s 2026 numbers in some depth. The next will turn to a more specific question sitting behind much of this discussion, whether side pockets have a place in KiwiSaver as private asset allocations grow. Worth checking back for.
Further reading
For the original review of the FMA’s private assets survey, see FMA report on private assets in New Zealand managed funds.
For the funds flow and market share context behind this post, see Beyond the transfer headlines.
Source: FMA KiwiSaver Annual Report 2026.
Happy investing.
Disclosure
Please read the Kiwi Investor Blog Disclosure Statement before relying on any information in this post. This blog is written for information and discussion purposes only. Nothing in this post constitutes financial advice. All investment strategies involve risk, including the loss of principal. Readers should seek independent financial advice before making any investment decisions. The views expressed in this post are my own and do not represent the views of my employer or any organisation with which I am affiliated.


Pingback: Growing alternatives in KiwiSaver: what needs to be in place | Kiwi Investor Blog