Why the Balanced Fund is expected to underperform

GMO concluded some time ago the time was right to consider moving away from the 60/40 Portfolio. Which is a “Balanced Portfolio” of 60% equities and 40% fixed income.


In a more recent note, GMO identify two key problems that lie ahead for the Balanced Portfolio, which are supportive of their conclusion. Which I think are problems facing all investors, but particularly for US and New Zealand investors.


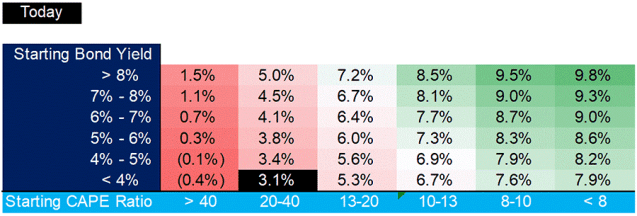
First, stock and bond valuations are both extended, suggesting they will deliver less than they have historically.

As GMO point out, the math with fixed income (bonds) is straightforward. The 10-Year U.S. Treasuries yield is under 1% today. New Zealand’s yield is also near 1%.

Today’s yield is the best predicator of future returns.

Real returns, after inflation, will likely be negative over the next 10 years from fixed income.

In short, GMO highlight “It is more or less impossible for a bond index yielding roughly 2% to deliver the 5% nominal returns investors have become accustomed to over any period of time approaching or exceeding the index’s duration.”


GMO also highlight stockmarket valuations have risen. Recent market weakness provides some valuation relief, albeit, US valuations remain elevated relative to history.


GMO conclude, “the passive 60/40 portfolio will likely deliver disappointing returns. The low starting yield of a 60/40 portfolio represents the first problem we see ahead.”


The second issue identified by GMO is that risks within fixed income have risen, and not just from a valuation perspective.

As can be seen in the graph below, provided by GMO, duration is near its highest level in history. (Duration is the key measure of risk for a fixed income portfolio. It measures the sensitivity of a fixed income security’s price movements to changes in interest rates.)

Global duration


So, not only are interest rates at historical lows (low expected returns), but risk, as measured by duration, is amongst highest level in history.


This dynamic, low expected returns and heightened risk highlights the folly of an Index approach, similarly a set and forget approach in allocating to different asset classes. Similar dynamics also play out in sharemarket indices. Risks within markets vary over time.

Furthermore, the credit risk of many fixed income indices is also higher now than compared to the Global Financial Crisis. BBB and AA rated securities currently make up a greater proportion of the fixed income indices. Therefore, the credit quality of these indices has fallen over the last ten years, while the amount of corporate debt has grown. These dynamics need to be considered, preferably before the next credit crisis.


As GMO point out “Today, the sensitivity of a 60/40 portfolio to a change in yield is nearly as high as it has ever been. Both stocks and bonds are levered to future changes in discount and interest rates. Even a small amount of mean reversion upward in the aggregate yield of the 60/40 portfolio will be painful because there is less underlying yield to cushion any capital losses and those capital losses should be expected to be larger than normal for any change in yield given the high duration.”


Because of the higher duration and lower yields, smaller movements higher in interest rates will result in greater capital losses from fixed income securities compared to times when yields were higher. This is also the math.

At the same time, given the high valuation of sharemarkets, they are more susceptible to a movement higher in interest rates. Particularly those sectors of the equity market more sensitive to interest rate movements such as Listed Property.

Therefore, the historical diversification benefits from holding fixed income and equities are likely to less in the future.


GMO conclude “While investors have become conditioned to believe that a 60/40 portfolio delivers consistently strong returns, history shows this has not always been the case and the twin problems weighing on such a construction today suggest robust returns are unlikely going forward. Due to elevated valuations (low yields) and extended durations of both stocks and bonds, it is possible that in a future downturn investors will not receive the diversification they expect from their bond portfolio. Stocks and bonds have risen together and could certainly fall in unison as well.”


Although recent market events may have delayed this moment, they have not derailed the underlying dynamics within a Balanced Portfolio which will see it struggling to meet investor’s expectations over the next decade.  The risks identify above remain.


The Balanced Portfolio is riskier than many appreciate. I covered this in a previous Post. It is not uncommon for the Balanced Portfolio to have a lost decade of returns and losses of up to 30% over a twelve-month period.


Possible Solution

To address the threats to the Balanced Portfolio identified above GMO suggest the inclusion of Liquid Alternatives across multi-asset portfolios.

Such strategies provided portfolio diversification, importantly they have very little duration risk within them, a risk both equities and fixed income are exposed too.

GMO articulate the benefits of such strategies as follows: “Liquid Alternatives can provide diversifying and uncorrelated returns. While Alternatives should not be expected to keep up with robust equity markets, they can help shield large drawdowns given their lower equity beta exposure.”

Liquid alternatives largely generate their return outcomes independently from the returns generated by equity markets (beta) and fixed income market (duration). Thus they provide exposure to different risk and return outcomes from equities and fixed income.

GMO conclude “Liquid alternatives improve the robustness of our multi-asset portfolios by helping to protect against the problems that today’s low yields and high durations present.”


The benefits of such strategies has been evident over the last few weeks, helping to diversify portfolios from the sharp fall in global sharemarkets as a result of the spreading of the coronavirus.


To finish, I would add to the GMO commentary that well diversified portfolios should also have an exposure to Real assets such as Farmland, Timberland, Infrastructure, Natural Resources, Real Estate, TIPS (Inflation Protected Fixed Income Securities), Commodities, Foreign Currencies, and Gold.  These assets offer real diversification benefits relative to equities and fixed income, and to Balanced Portfolio in different macro-economic environments, such as low economic growth, high inflation, stagflation, and stagnation.

I covered the investment characteristics and  benefits of Real Assets to a Balanced Portfolio in different economic environments in a recent Post.


Happy investing.


Please read my Disclosure Statement


Global Investment Ideas from New Zealand. Building more Robust Investment Portfolios.


Time to move away from the Balanced Portfolio. They are riskier than you think.

GMO, a US based value investor, has concluded “now is the time to be moving away from 60/40” Portfolio.  Which is a Balanced Portfolio consisting of 60% US equities and 40% US fixed income.

Being a “contrarian investor”, recent market returns and GMO’s outlook for future market returns are driving their conclusions.

I covered their 7-year forecasts in an earlier Post. GMO provide a brief summary of their medium term returns in the recently published article: Now is the Time to be Contrarian


The GMO article makes the following key observations to back up their contrarian call:

  • The last time they saw such a wide “spread” in expected returns between a traditional 60/40 portfolio and a non-traditional one was back in the late 1990s, this was just prior to the Tech bubble bursting.
  • The traditional 60/40 portfolio went on to have a “Lost Decade” in the 2000s making essentially no money, in real terms, for ten years. Starting in late 1999, the 60/40 portfolio delivered a cumulative real return over the next ten years of -3.9%.


As outlined in the GMO chart below, Lost Decades for a Balanced Portfolio have happened with alarming and surprising frequency, all preceded by expensive stocks or expensive bonds.

GMO note that both US equities and fixed income are expensive today. As observed by the high CAPE and negative real yield at the bottom of the Chart.

They are of course not alone with this observation, as highlighted by a recent CFA Institute article. I summarised this article in the Post: Past Decade of strong returns are unlikely to be repeated.

lost-decades_12-31-19


The Balance Portfolio is riskier than you think.

The GMO chart is consistent with the analysis undertaken by Deutsche Bank in 2012, Rethinking Portfolio Construction and Risk Management.

This analysis highlights that the Balanced Portfolio is risker than many think. This is quite evident in the following Table. The Performance period is from 1900 – 2010.

Real Returns

(after inflation)

Compound Annual Return per annum 3.8%
Volatility (standard deviation of returns) 9.8%
Maximum Drawdown (peak to bottom) -66%
% up years 67%
Best Year 51%
Worst Year -31%
% time negative returns over 10 years 22%

The Deutsche Bank analysis highlights:

  • The, 60/40 Portfolio has generated negative real returns over a rolling 10 year period for almost a quarter of the time (22%).
  • In the worst year the Portfolio lost 31%.
  • On an annual basis, real negative returns occur 1 in three years, and returns worse than -10% 1 in every six years
  • Equities dominate risk of a 60/40 Portfolio, accounting for over 90% of the risk in most countries.


The 4% average return, comes with volatility, much higher than people appreciate, as outlined in the Table above. The losses (drawdowns) can be large and lengthy.

This is evident the following Table of Decade returns, which line up with the GMO Chart above.

Decade Per annum return
1900s 6.3%
1910s -4.7%
1920s 12.7%
1930s -2.3%
1940s 1.1%
1950s 9.1%
1960s 4.5%
1970s -0.3%
1980s 11.7%
1990s 11.7%
2000s 0.5%


We know the 2010s was a great decade for the Balanced Portfolio.  A 10 year period in which the US sharemarket did not experience a bear market (a decline of 20% or more). This is the first time in history this has occurred.

Interestingly, Deutsche Bank highlight the 1920s and 1950s where post war gains, while the 1980s and 1990s were wind-full gains.

The best 4 decades returned 11.3% p.a. and the 7 others 0.7% p.a.


As outlined in my last Post, the case for diversifying away from traditional equity and fixed income is arguably stronger than ever before.


Happy investing.

 Please read my Disclosure Statement


Global Investment Ideas from New Zealand. Building more Robust Investment Portfolios.

More needs to be done to address the post-retirement challenges

The next generation to retire is likely to have much lower retirement savings. Those aged 40 to 55 are effectively a lost generation.

They have limited defined benefit (DB) pensions as many occupational schemes closed early on in their careers and it took the government many years to develop and implement auto-enrolment.

These are some of the underlying themes of the 2019 UK Defined Contribution (DC) Investment Forum (DCIF) report.  A summary and discussion of this report was recently published in an IPE Article.

The key findings of the DCIF Report:

  • Members are sleepwalking into retirement and choosing the path of least resistance
  • The industry has been slow to address the challenges posed by pension freedoms
  • The best approach is seen as income drawdown in earlier years and longevity protection later in retirement
  • Further policy initiatives are required to build consensus and provide clarity


In summary, “The DC industry needs to do more to address post-retirement challenges”.


There are obviously issues specific to the UK market e.g. it has been five years since pensioners in the UK gained greater freedom to use their defined contribution (DC) pots.

Nevertheless, retirement issues are universal and key learnings can be gained from individual markets.


The IPE article outlined the key challenge facing providers: “how do you ensure members retain flexibility and choice, while ensuring those members can manage both the investment and longevity risk over decades of retirement?”


Overall, the UK industry response has been slow. It appears “Pension providers have been focused on designing the best default fund with little energy spent on the post-retirement phase.”

Interestingly, research in the UK by Nest, a €8.3bn auto-enrolment provider, found most members expect their pension pot to pay an income automatically on retirement.

Members are also surprised by the level of complexity involved in draw down products.


Post Retirement Investment Solution Framework

Despite the lack of innovation to date there appears to be a consensus about the shape of the post-retirement investment solution.

An appropriate Post-Retirement Investment Strategy would allow retirees to have decent levels of income during the first two active decades of retirement and longevity protection for after 80.

“Not only does this remove the burden of an unskilled person having to manage both investment and longevity risk, but it also prevents members from either underspending or overspending their pots”.

The idea is to turn a DC pension pot into an income stream with minimal interaction from the scheme member.


This is consistent with the vision expressed by Professor Robert Merton in 2012, see this Kiwi Investor Blog Post: Designing a new Retirement System for more detail.


As the IPE article highlights, it is important retirees are provided guidance to ensure they understand their choices.

Albeit, a core offering will deliver a sustainable income.  This is potentially a default solution which can be opted out of at any stage.

Some even argue that the “trustees would then make a judgement about what a sustainable income level would be for each member and then devise a product to pay this out.”

“In addition, this product could also provide a small pot of cash for members to take tax-free on retirement as well buying later-life protection. This could take the form of deferred annuities or even a mortality pool.”


Early Product Development in the UK

The IPE article outlines several approaches to assist those entering retirement.

By way of example, Legal & General Investment Management have developed a retirement framework which they call ‘four pots for your retirement’.”

  • First pot is to fund the early years of retirement – assuming retirees will spend the first 15 years wanting to enjoy no longer working; they will travel and be active.
  • Second pot provides a level of certainty to ensure retirees do not outlive their savings, this may include an annuity type product.
  • Third pot is a rainy-day pot for one-off expenses.
  • Final pot is for inheritance.


Greater Policy Direction

Unsurprisingly, there is a call for clearer policy direction from Government. Particularly in relation to adequacy, and the relation between adequacy and retirement products.

Unlike a greater consensus around what an investment solution might look like, consensus around the regulatory environment will be harder to achieve.

This may slow investment solution innovation to the detriment of retirees.


Concluding remarks

The following point is made within the IPE article: “While pension providers in both the US and Australia have come to the same conclusions as the UK about the way to address the retirement market, no-one in these markets has yet developed a viable product.”

As the IPE article note “It is likely the industry will be pushing at an open door if it develops a product that provides an income in retirement.”

This is a significant opportunity for the industry.


Interestingly, the investment knowledge is available now to meet the Post Retirement challenge. Also, Post-Retirement Investment solutions are increasingly being developed and are available. It is going to take a change in industry mind-set before they are universally accepted.


The foundations of the investment knowledge for the Post-Retirement Investment solution as outlined above have regularly been posted on Kiwi Investor Blog.

For those wanting more information, see the following links:


There will be change, a paradigm shift is already occurring internationally, and those savings for retirement need a greater awareness of these developments and the likely Investment Solution options available, so that they are not “sleepwalking into retirement and choosing the path of least resistance”.


I don’t see enough of the Post Retirement Challenges being addressed in New Zealand by solution providers. More needs to be done, the focus in New Zealand has been on accumulation products and the default option as occurred in the UK.

The approach to date has been on building as big as possible retirement pot, this may work well for some, for others not so well.

Investment strategies can be developed that more efficiently uses the pool of capital accumulated – avoiding the dual risks of overspending or underspending in the early years of retirement and providing a greater level of flexibility compared to an annuity.

These strategies are better than Rules of Thumb, such as the 4% rule which has been found to fail in most markets.

More robust and innovative retirement solutions are required.


In New Zealand there needs to be a greater focus on decumulation, Post Retirement solutions, including a focus on generating a secure and stable level of income throughout retirement.

The investment knowledge is available now and being implemented overseas.

Let’s not leave it until it is too late before the longevity issues arise for those retiring today and the next generation, who are most at risk, begin to retire.


Happy investing.

 Please read my Disclosure Statement


Global Investment Ideas from New Zealand. Building more Robust Investment Portfolios.

Why is the Multi-Asset Portfolio so Popular?

The rise of the Multi-Asset Portfolio can be traced back to the Global Financial Crisis (GFC) in 2008, when many investors “grew disenchanted with the long-time investment mantra that equities were the one true way to wealth. That smug bromide rang hollow when the financial crisis slashed many stock portfolios in half”, according to recent Chief Investment Office (CIO) article, How Multi-Asset Investing Became So Popular.

Following the GFC, the mantra became diversify your holdings. As a result, Multi-Asset Portfolios, which combine equities, fixed income, and an array of other assets, gained greater prominence.

Multi-Asset Portfolios grew more popular on promises of greater capital preservation and sometimes the delivery of superior returns.

As CIO note, the increased prominence of the Multi-Asset Portfolio can be attributed to David Swensen, Yale’s investment chief since 1986. Yale has generated an impressive performance record by investing outside of just equities and fixed income. Their portfolio has included high allocations to private equity, real estate, and other non-traditional assets. (For more on the success of the Endowment model and the fee debate please see this Post.)


The CIO article also noted that Multi-Asset Portfolios are most prominent among target-date funds (TDFs), which have become the default offering among 401(k) plans (e.g. US superannuation schemes such as KiwiSaver in New Zealand).

“TDFs have grown five-fold since the financial crisis, reaching $1.09 trillion in 2018, a Morningstar report concluded, with an estimated $40 billion added last year.”


The Concept: Absolute returns and better risk management

The Multi-Asset Portfolio is based on the concept of absolute returns, where the focus is on generating a more targeted and less volatile investment return outcome. There is a greater focus on risk management relative to that undertaken within a traditional portfolio. The intensity and sophistication of risk management employed depends on the type of absolute return strategy.

The absolute return universe is very broad, ranging from Multi-Asset Portfolios to those with a much greater focus on absolute returns such as the plethora of Hedge Fund strategies, including Risk Parity as discussed in the CIO article.

This contrasts with the traditional balanced fund, which are generally less diversified, portfolio risk is dominated by the equity exposures, and returns are much more subject to the vagaries of investment markets. The management of risk is more focused on relative returns i.e. how performance goes relative to a market benchmark, rather than returns relative to an absolute return outcome.

A Multi-Asset Portfolio generally has more of an absolute return focus than a Traditional Portfolio. It achieves this by having a more truly diversified portfolio, moving beyond the traditional Balanced Portfolio (60% equities and 40% Fixed Income), to incorporate a greater array of different investment strategies and risk management approaches within the portfolio.

As the CIO article comments, “There’s a strong argument for Swensen-like multi-asset funds that range beyond stocks and bonds, adding solid helpings of commodities, real estate and all kinds of other asset classes. With such an array, the thinking goes, you’re best protected when recessions thunder in.”


Return Expectations

The CIO article made the following observation, Multi-Assets Portfolios are “expected to return 4.5% annually through 2024, according to Casey Quirk, an arm of Deloitte Consulting. That isn’t a daunting growth rate, but the figure should have a decent chance of holding steady, while public markets lurch around, especially in the next recession.”

To put this into perspective, a recent CFA Institute article estimated that a Balanced Portfolio will return 3.1% over the next 10 years.

It is highly likely we are heading into a “Low Return Environment”.


As a result, a different investment approach to that which has been successful over the last 20-30 years is likely needed to invest successfully in what is expected to be a Challenging Investment Environment.

As the CIO article notes, “But multi-asset now goes far beyond the simple stock-bond duality, which seems insufficient to deliver the best diversification. The most salient problem with the basic pairing nowadays is that bonds are paying low interest rates. Their ability to score capital gains is limited because rates don’t have much left to fall before they hit zero. “These don’t work as well as they used to,” observed Deepak Puri, CIO Americas for Deutsche Bank Wealth Management.”


I fear the lessons from the GFC and 2000 Tech Bubble are fading from the collective memory, as equity markets reach historical highs and investors chase income from within equity-income sectors of the sharemarket.

In addition, more advanced portfolio management approaches have been developed over the last 20 – 30 years.

It would seem crazy that these learnings are not reflected in modern day investment portfolios. In a previous Post: A Short History of Portfolio Diversification, it is not hard to see how the Multi-Asset Portfolio has developed over time and is preferred by many large institutional investors.

Meanwhile, this Post: What Portfolio Diversification looks like, compares a range of investment portfolios, including the KiwiSaver universe, to emphasis what a Multi-Asset Portfolio does look like.


Growth in Multi-Asset Portfolios to continue

Increasingly the Multi-Asset Portfolios are taking market share from traditional portfolios.

Institutional investors are increasingly adopting a more absolute return investing approach. This has witnessed an increased allocation, and growth in Funds Under Management, in underlying strategies, “such as private equity, hedge funds, real estate, natural resources, and other strategies whose assets aren’t publicly traded.”


An underlying theme of the CIO article is the Death of the Balance Portfolio, which I covered in a previous Post.

Personally, I think the death of 60/40 Portfolio is occurring for more fundamental reasons. The construction of portfolios has evolved, as noted above, more advanced approaches can be implemented. For those interested I covered this in more detail in a recent Post: Evolution within the Wealth Management Industry, the death of the Policy Portfolio. (The Policy Portfolio is the 60/40 Portfolio).


Concluding Remarks

The current market environment, of low expected returns, might quicken the evolution in portfolio construction toward greater adoption of Multi-Asset Portfolios and a more absolute return focus.

Therefore, the value is in implementation, identifying the suitable underlying investment strategies to construct a truly diversified portfolio, within an appropriate fee budget.

Wealth management practices need to be suitably aligned with this value adding activity.


Happy investing.

Please read my Disclosure Statement


Global Investment Ideas from New Zealand. Building more Robust Investment Portfolios.

Past Decade of strong returns unlikely to be repeated

The current return assumption for the average US public pension fund is 7.25%, according to the National Association of State Retirement Administrators (NASRA), highlighted in a recent CFA Institute Blog: Global Pension Funds the Coming Storm.

This compares to the CFA Institute’s (CFA) article expected return for a Balanced Portfolio of 3.1% over the next 10 years.  A Balanced Portfolio is defined as 60% Equities and 40% Fixed Income.

Therefore, the article concludes that a 7.25% return assumption is “overly optimistic in a low return interest rate environment”.

The expected low return environment will place increasing pressure on growing pension liabilities and funding deficits. This is over and above the pressures of an aging population and the shift toward Defined Contribution (DC) superannuation schemes e.g. KiwiSaver.

This environment will likely require a different approach to the traditional portfolio in meeting the growing liabilities of Define Benefit (DB) Plans and in meeting investment return objectives for DC superannuation Funds such as KiwiSaver in New Zealand.

The value will be in identifying and implementing the appropriate underlying investment strategies.


Past Returns

For comparison purposes an International Balanced Portfolio, as defined above, has returned around 7.8% over the last 10 years, based on international fixed income and global sharemarket indices.

A New Zealand Balanced Portfolio has returned 10.3%, based on NZ capital market indices only.

New Zealand has had one of the best performing sharemarkets in the world over the last 10 years, returning 13.5% per annum (p.a.), this compares to the US +11.3% p.a. and China -0.7% p.a.. Collectively, global sharemarkets returned 10.2% p.a. in the 2010s.

Similarly, the NZ fixed income markets, Government Bonds, returned 5.4% p.a. last decade. The NZ 5-year Government Bond fell 4.1% over the 10-year period, boosting the returns from fixed income. Interestingly, the US 5-year Bond is only 1% lower compared to what it was at the beginning of 2010.


It is worth noting that the US economy has not experienced a recession for over ten years and the last decade was the only decade in which the US sharemarket has not experienced a 20% or more decline. How good the last decade has been for the US sharemarket was covered in a previous Post.


In New Zealand, as with the rest of the world, a Balanced Portfolio has served investors well over the last ten or more years. This reflects the strong returns from both components of the portfolio, but more particularly, the fixed income component has benefited from the continue decline in interest rates over the last 30 years to historically low levels (5000 year lows on some measures!).


Future Return Expectations

Future returns from fixed income are unlikely to be as strong as experienced over the last decade. New Zealand interest rates are unlikely to fall another 4% over the next 10-years!

Likewise, returns from equities may struggle to deliver the same level of returns as generated over the last 10-years. Particularly the US and New Zealand, which on several measures look expensive. As a result, lower expected returns should be expected.

The lower expected return environment is highlighted in the CFA article, they provide market forecasts and consensus return expectations for a number of asset classes.


As the article rightly points out, one of the best estimates of future returns from fixed income is the current interest rate.

As the graph below from the article highlights, “the starting bond yield largely determines the nominal total return over the next decade. So what you see is what you get.”


US Bond Returns vs. US Starting Bond Yields

US Bond Returns vs US Starting Bond Yields


In fact, this relation has a score of 97% out of 100%, it is a pretty good predictor.

The current NZ 10 Government Bond yield is ~1.65%, the US 10-Year ~1.90%.


Predicting returns from equity markets is more difficult and comes with far less predictability.

Albeit, the article concludes “low returns for US equities over the next 10 years.”


Expected Returns from a Balanced Portfolio

The CFA Article determines the future returns from a Balance Portfolio “By combining the expected returns from equities and bonds based on historical data, we can create a return matrix for a traditional 60/40 portfolio. Our model anticipates an annualized return of 3.1% for the next 10 years. That is well below the 7.25% assumed rate of return and is awful news for US public pension funds.”

Subsequent 10-Year Annualized Return for Traditional 60/40 Equity/Bond Portfolio

Subsequent 10 years annualized Return for Traditional 60 40 Equity Bond Portfolio.png


This is a sobering outlook as we head into the new decade.

Over the last decade portfolio returns have primarily been driven by traditional market returns, equity and fixed income “beta“. This may not be the case when we look back in ten-years’ time.


This is a time to be cautious. Portfolio strategy will be important, nevertheless, implementation of the underlying strategies and manager selection will be vitally important, more so than the last decade. The management of portfolio costs will also be an essential consideration.

It is certainly not a set and forget environment. The challenging of current convention will likely not go unrewarded.

Forewarned is forearmed.


Global Pension Crisis

The Global Pension crisis is well documented. It has been described as a Financial Climate Crisis, the risks are increasingly with you, the individual, as I covered in a previous Post.

As the CFA article notes, the expected low return environment adds to this crisis, as a result deeper cuts to government pensions and greater increases in the retirement age are likely. This will led to greater in-equality.


This is a serious issue for society, luckily there is the investment knowledge available now to help increase the probability of attaining a desired standard of living in retirement.

However, it does require a shift in paradigm and a fresh approach to planning for retirement, but not a radical departure from current thinking and practices.

For those interested, I cover this topic in more depth in my post: Designing a New Retirement System. This post has been the most read Kiwi Investor Blog post. It covers a retirement system framework as proposed by Nobel Laureate Professor Robert Merton in his 2012 article: Funding Retirement: Next Generation Design.


Lastly, the above analysis is consistent with recent calls for the Death of the Balanced Portfolio, which I have also Blogged on.

Nevertheless, I think the Balanced Portfolio is being replaced due to the evolution within the wealth management industry globally, which I covered in a previous Post: Evolution within Wealth Management, the death of the Policy Portfolio. This covers the work by the EDHEC-Risk Institute on Goals-Based Investing.


In another Posts I have covered consensus expected returns, which are in line with those outlined in the CFA article and a low expected return environment.

In my Post, Investing in a Challenging Investment Environment, suggested changes to current investment approaches are covered.

Finally, Global Economic and Market outlook provides a shorter-to-medium term outlook for those interested.


Please note, I do not receive any payment or financial benefit from Kiwi Investor Blog, and a link to my Discloser Statement is provided below.


Happy investing.

Please read my Disclosure Statement


Global Investment Ideas from New Zealand. Building more Robust Investment Portfolios.

Target Date Funds – 25 Years of US Learnings

Launched in 1994, target-date funds now boast assets of more than $2 trillion in the US, according to a recent Wealth Management.com article, Target-Date Funds Aging Gracefully

The article concludes: “Naturally it is difficult to foresee how target date funds will evolve over coming decades, as the list of potential innovations is endless, but one thing is certain: the benefits target-date funds present both to plan participants and sponsors ensure they will play a dominant role in building comfortable retirements for years to come.”

The growth Target-Date Funds (TDF) has significantly changed the Defined Contribution (DC), superannuation, industry in the US.

TDF are also referred to as Life Stages or Life Cycle strategies.


Since their launch in 1994 TDF have become to dominate DC plans. According to the Wealth Management.com article total assets in TDF mutual funds alone have grown from about $278 million at the end of 1994 to more than $1.2 trillion in the second quarter of 2019.

Considering other investments, it is estimated that $2 trillion or about 25% of total DC assets today are invested TDF.


Why the Growth?

The growth in TDF can be attributed to their appeal to those saving for retirement (Participants) and those offering investment solutions e.g. Sponsors such KiwiSaver Providers.

For the Participant, TDF remove the “burden of creating an asset allocation strategy and choosing the investments through which they would execute it.” Participants do not need to make complicated investment decisions.

For Sponsors, they can “streamline their investment offering (reducing complexity and administrative costs), while meeting their fiduciary responsibility to participants.”

Also, and of particular interest given New Zealand is currently reviewing the Default option for KiwiSaver, TDF have also experienced a significant boost from the enactment of the Pension Protection Act (PPA) in 2006.

As noted by the Wealth Management.com article “The PPA relieved plan sponsors from fiduciary responsibility for investment outcomes if they provided a suitable Qualified Default Investment Alternative (QDIA), such as TDFs, to anyone auto-enrolled in their plans. The combination of auto enrollment and safe harbor relief for plan sponsors paved the way for the wide adoption of TDFs.”


Future Growth and Innovation

The growth of funds invested into TDF is expected to grow, primarily from the ongoing innovation of the vehicle.

It is likely that the TDF will evolve into the key investment vehicle over the complete lifecycle of an investor, not only by accumulating capital for retirement (Defined Contribution Fund) but also helping generate a stable and secure income once in retirement (Defined Benefit Fund).

A recent enhancement to TDF is the addition of Guaranteed-income options. These Funds convert into a personalised investment plan for those seeking the security of a guaranteed income for life.

TDF offering guaranteed income are available now in the US, but they have not been widely embraced by either participants or plan sponsors. They do face a higher fee hurdle to be adopted. Albeit, the Wealth Management.com article notes “TDFs offering guaranteed income are likely to gain traction in the DC space. Participants contemplating decades in retirement naturally have concerns about outliving their savings, and guaranteed-income TDFs address that anxiety.”


The innovation and focus of these Funds is consistent with the framework proposed by EDHEC Risk Institute, as I outlined in the Post: A more Robust Investment Solution

They are also consistent with the Next Generation of Retirement solutions promoted by Nobel Laureate Professor Robert Merton: Funding Retirement: Next Generation Design, which was written in 2012. I summarise Professor Merton’s Paper in this Post: Designing a new Retirement System, which is the most read Kiwi Investor Blog Post.


Such considerations will greatly increase the efficiency of TDF.

These solutions are about making Finance great Again (Flexicurity in Retirement Income Solutions – making finance great again)


New Zealand Perspective

TDF would make more sense as a Default KiwiSaver solution, and stack up better relative to a Balanced Fund option (Balanced Funds not the Solution for Default Kiwi Saver Investors).

Lastly, the criticism of TDF is often due to poor design (In Defence of Target Date Funds).

An example is a large Kiwi Saver provider promoting a 65+ Life Stages Fund which is 100% investment in Cash. This is scandalous as outlined in this research by Dimensional, this research is summarised in the Post High Cash holdings a scandalous investment for someone in retirement.


Happy investing.

Please read my Disclosure Statement


Global Investment Ideas from New Zealand. Building more Robust Investment Portfolios.

The opportunity and role of active management

RBC Global Asset Management provides a strong case for the opportunity of active management and its role within a truly diversified portfolio.

As they note, there are considerable opportunities within markets for active managers to turn into reliable excess returns.

RBC’s analysis highlights that a large proportion of active share price movements, up to 75%, cannot be explained by market factors.

This is a large opportunity set for active managers. An opportunity set that is found to remain reasonably consistent over time.

The scale of the opportunity as demonstrated by RBC, if successfully captured, provides a potential source of excess returns and a true portfolio diversifier – which is a return outcome largely sourced from company/stock specific risks.

Nevertheless, active managers do need to evolve from historical practices and processes. From this perspective, the paper also provides great insights into the evaluation of a modern day active manager.

With regards to the success of active management, the Conventional Wisdom toward active management is changing. Specifically, the conventional wisdom is too negative on the value of active management.

The RBC article is well worth reading.


RBC emphasis “An active manager’s task is to capitalise on the fact that the market or index return is an average, and to use analysis and skill to identify those stocks that produce an above-average return and to avoid those that don’t.”


To capture the opportunity identified by RBC, they believe active managers need to find a way to turn share price movements into reliable excess returns.

To do this they believe that active managers must get two things right:

  1. Alpha generation: devise means of explaining and predicting the share price movements that are not explained by factors.
  2. Alpha capture: devise means of efficiently capturing alpha and turning it into reliable portfolio excess returns.

The RBC paper provides a lengthy discussion on what it likely takes to achieve this, including analysing the unique features associated with each business, including ESG factors, taking an active ownership role, and maintaining a long-term perspective.

Each company (security) has a unique performance history, which cannot all be explained by broad market factors.  Financial outcomes are partly dependent on management teams, brand, location, reputation, non-financial factors, and Culture. Analysis needs to be undertaken on the unique factors associated with each business.

Furthermore, accounting data is a poor measure of business value, there are extra financial factors, Governance, employee engagement, Health and Safety, ESG etc etc


RBC conclude “that the critical skill for stock pickers is understanding and evaluating extra-financial factors as well as assessing their impact on financial returns. Skill and expertise need to be developed to assess nuanced factors such as corporate culture, employee engagement, customer satisfaction, the business’s social licence to operate, maintenance and safety procedures, R&D effectiveness, brand and reputation, and these will vary from industry to industry and will also shift over time.”

See the article for fuller discussion on their perspective and type of analysis required by a modern day active manager.


Portfolio construction is also key, the size of portfolio positions matters.

Equity investments can be held in fractional holdings so it is possible to construct an almost infinite number of portfolios from a relatively modest number of securities.

Different combinations of securities will create portfolios with different factor exposures.   Which will cause variation in portfolio returns.

Therefore, Portfolio construction becomes the framework within which portfolio managers can assess the trade-off between “two often conflicting objectives: maximising exposure to their best investments vs. minimising exposure to unintended factor returns.“


My personal view is that many managers under estimate the value added from a solid portfolio construction approach, often it distracts value from a sound stock selection process.


One final point, the paper provides a good account of how active management has been disrupted by technology and the information revolution – computing power and access to company information. This has resulted in the rise of passive investing and factor-based investing. This has driven down fees.

The active management industry has changed dramatically, and active management has had to evolve. This is touched on within the Article.

Therefore, the Article provides insight from the perspective of manager selection and a potential lens with which to consider in evaluating modern day active managers.


The Role of Active management within a portfolio

From a Kiwi Investor Blog perspective, the active management described by RBC in the Paper “seeks to generate outperformance from stock-specific risk that lies outside the realms of factors. This is a different alpha source, hence it creates a return stream that is not correlated to factor returns.”, highlights the role active management can play within a truly diversified and robust portfolio.

Consistent with RBC, active managers can co-exist with passive and factor based strategies. Active management has a role to play within a Portfolio.

Why? Investors seek to access a wide range of investment risks and returns, seeking true portfolio diversification.

The source of risks and returns from active management that seeks to outperform from stock specific risks is a true portfolio diversifier, if done successfully.

This is consistent with many Posts on Kiwi Investor Blog around the disaggregation of investment returns.

Understanding the disaggregation of investment returns can assist in building a truly diversified and robust portfolio.

It can also help determine the appropriateness of fees being paid and if a manager is adding value.


Many institutional investors understand that true portfolio diversification does not come from investing in many different asset classes but comes from investing in different risk and return sources.  See earlier post More Asset Classes Does not Equal More Diversification.

The objective is to implement a portfolio with exposures to a broad set of different return and risk outcomes.  For example, the increasing allocation to alternative investment strategies by institutional investors globally, such as hedge fund strategies, to complement more traditional investments is evidence of this.

Essentially, and from a very broad view, investment returns can be disaggregated in to the following three parts:

  1. Market beta. Think equity market exposure NZX50 or S&P 500 indices (New Zealand and America equity market exposures respectively).
  2. Factor and Alternative hedge fund beta exposures.  See the Disaggregation of Investment Returns Post for a fuller discussion.
  3. Alpha. Alpha is what is left after beta and factors. It is the manager skill to capture the stock specific risks as outlined in RBC paper. Alpha is a risk adjusted return source.


With regards to the success of active management, the Conventional Wisdom toward active management is changing, as highlighted in this Post. The linked article in this Post is the most read from Kiwi Investor Blog.

The article undertakes a review of the most recent academic literature on active equity management and concludes by challenging the conventional wisdom of active management, “taken as a whole, our review of current academic literature suggests that the conventional wisdom is too negative on the value of active management.


Finally, the disaggregation of investment returns busts opens the active vs passive debate, the debate has moved on. It is no longer an emotive black vs white debate, risk and return sources come in many different shades. A truly diversified portfolio has as many different risk and return exposure as possible. It is from poor portfolio construction that portfolios fail.  The value is in implementation of a truly diversified portfolio.


It is evident that New Zealand portfolios need to become more diversified and that Kiwi Saver Investors are missing out.


Happy investing.

Please read my Disclosure Statement


Global Investment Ideas from New Zealand. Building more Robust Investment Portfolios.

Beginners guide to Portfolio Diversification. And why Portfolios Fail.

It is often asked if Modern Portfolio Theory failed during the Global Financial Crisis / Great Recession (GFC).

No, Modern Portfolio Theory did not fail during the GFC. Portfolio construction did.

During the GFC many investors did not have exposure to enough different asset classes and investment risks. This limited their protection from market loses.

Therefore, Investors should consider incorporating a wide range of different investment strategies as their core investment strategy. Investors should also clearly understand the sources of risk within their portfolio.

Furthermore, investors cannot necessarily rely on “what is traditionally thought of as diversification to meet their long-term goals.”

It is likely that many investors remain under-diversified today.

These are the views of a 2013 BlackRock Article, the new diversification: open your eyes to alternatives.


The discussion in 2012 with Dr Christopher Geczy is still very relevant today.

As we have seen previously, from what does portfolio diversification look like, many KiwiSaver Funds are under-diversified relative to Australian Superannuation Funds. Likewise, the Australian Future Fund is very well diversified relative to the New Zealand Super Fund.


Highlights of the BlackRock article are provided below.

They are presented to provide the rationale for seeking true portfolio diversification, as pursued by many of the largest investors worldwide, including Super Funds, Pension Funds, Foundations, Endowments, Family Officers, and Sovereign Wealth Funds. This group also includes the ultra-wealthy.

Albeit, the opportunity to have a truly diversified portfolio is open to all investors, the value is in implementation.

Currently, many New Zealand investors are missing out.


What happened during the GFC?

In short, as we all know, what happened during the GFC was a spike in financial market volatility, this led to all markets behaving in a similar fashion – technically market correlations moved to one. This reduces the benefits of diversification. As a result, many markets fell sharply in tandem.

Those markets that where already quite highly correlated became more correlated e.g. listed property with the broader share market.

As we also know, this often happens at time of market crisis, nevertheless, correlations can spike higher without a crisis.

The BlackRock article provides a comparison of market correlations prior to the GFC and correlations during the GFC.


For clarity, there are benefits from investing in different asset classes, regions, and so forth.

Nevertheless, although a traditional “Balanced Portfolio”, 60% shares / 40% Fixed Income, provides a smoother ride than an undiversified portfolio, the risks of the Balanced Portfolio are dominated by its sharemarket exposures.

It is well understood that for the Balanced Portfolio almost all the risk comes from the sharemarket exposures. On some estimates over 90% of the risk of a Balanced Portfolio comes from sharemarkets.

Therefore, investors should not only clearly understand the sources of risk, but also the magnitude of these risks within their portfolio.


What is the difference between Portfolio Diversification and Portfolio Construction?

Diversification is not as obvious as many think e.g. as outlined above in relation to listed property, a portfolio exposed to different asset classes may not be that well diversified.

As a result, and a key learning from the GFC, investors need to think in terms of risk exposures – risk diversification.

Investors should not think in terms of asset class diversification.

More asset classes does not equal more Portfolio Diversification.

This is because returns from of a range of asset classes are driven by many of the same factors. These can include: economic growth; valuation; inflation; liquidity; credit; political risk; momentum; manager skill; option premium; and demographic shifts.

So while investors have added a range of asset classes to their portfolio (such as property, infrastructure, distressed debt, and commodities) their portfolio risk remains similar at the expense of adding greater complexity and management cost.

Therefore, increasingly institutional investors accept that portfolio diversification does not come from investing in more and more asset classes. This has diminishing diversification benefits.


From a portfolio construction, and technical, perspective, this means thinking in terms of risk exposures and “getting exposure to as many different and non-correlated types of risk that they can.”

Portfolio construction = “building a portfolio based on risk exposures and not just so-called “asset classes” or “sub-classes.””


What does this look like?

Investors should seek exposure to a variety of risk exposures in proportion to their risk tolerances and individual circumstances.

The point being everyone should have a broadly diversified portfolio to the greatest extent they can. Investors should hold as many different assets and risk exposes as they possibly can.

Therefore, portfolios should likely include real assets, international investments, and long/ short investments. Alternative and Alternative investment strategies.

The real value is in implementing the portfolio construction, accessing the appropriate risk exposures efficiently.

As BlackRock emphases, Investors need to work with their financial professionals to choose and blend the risk exposures that make sense for their unique circumstances.


Low Correlated investments

If the objective is to seek a truly diversified portfolio, the exposure to low correlated assets, both in general and particularly in times of stress, is necessarily.

These exposures are largely gained via Alternative investments or Alternative Investment strategies.

“Alternatives” are a broad category, as defined by BlackRock, offering “sources of potential return and investments that provide risk exposures that, by their very nature, have a low correlation to something else in an investor’s portfolio.”

The concept of alternative investing is about going beyond what a traditional Balanced Portfolio might look like, by introducing new sources of diversification.


BlackRock provides a very good discussion on Alternatives, types of assets that would be considered alternatives and a discussion around implementation – highlighting the portfolio benefits of adding alternatives to a portfolio (improving the risk/reward profile). Also noting Alternative investments feared better during the GFC.


It is important to emphasis, as does BlackRock, that the inclusion of alternatives into the traditional portfolio is not a radical departure from the notion of managing risk and constructing portfolios. It helps in understanding what risks are being taken and broadens portfolio diversification.

The inclusion of alternative investments is common place in many institutionally managed portfolios. For further discussion, see my previous Post on adding alternatives to a portfolio, it is an Evolution not a Revolution.


BlackRock makes a final and important point, the world presents countless risks, and not all those risks can be accounted for in a traditional Balanced Portfolio. Investors need to be diversified in general, but they also need to be diversified for the extreme. If not, they may be setting themselves up for failure.

Do not become too dependent on one source of investment returns.


Summary

Investors need to clearly understand the sources of risk in their portfolios and should consider incorporating a wide range of different investment strategies and assets as their core investment strategy.

Furthermore, investors cannot necessarily rely on what is traditionally thought of as diversification to meet their long-term goals.

It was not Portfolio Theory that failed during the GFC but Portfolio Construction.

And this is where the real value lies, the ability and knowledge to implement a truly diversified portfolio.

Many investors very likely remain under-diversified today. Their portfolios do not fully reflect the key learnings from history as outlined in this Post.


In my mind, many New Zealand Investors are missing out.


Happy investing.

Please see my Disclosure Statement


Global Investment Ideas from New Zealand. Building more Robust Investment Portfolios.


Reported death of the 60/40 Portfolio

The reported death of 60/40 portfolio, may well be exaggerated, but it certainly is ailing.

As reported by Think Advisor in relation to the 60/40 Portfolio (60% listed equities / 40% fixed income):

“No less than three major firms have issued reports in the last few weeks declaring it dead or ailing: Bank of America Merrill Lynch, Morgan Stanley, and JPMorgan.” 

All three firms have similar reasons:

  • Low expected returns, particularly from Fixed Income
  • Reduced portfolio diversification benefits from Fixed Income

For example, JP Morgan: “Lower returns from bonds create a challenge for investors in navigating the late-cycle economy,” “The days of simply insulating exposure to risk assets with allocation to bonds are over.” (A risk asset example is listed equities.)


With regards to the declining diversification benefits from Fixed Income in a portfolio Bank of America make the following point: Fixed Income (Bonds) have functioned as an offset to equity market loses over the last 20 years, this may not occur in the immediate future.

Technically, fixed income has had a negative correlation to equity markets over the past 20 years, interestingly, this did not prevail in the prior 65 years.


Underpinning these views is the expectation of lower investment returns than experienced over the last 10 years. Access to JP Morgan’s Longer-term Capital Market assumptions are provided in the article.

There is no doubt we are living in challenging times and we are heading into a low return environment.  I covered in this in a previous Post: Low Return Environment Forecasted.  This Post provides an indication of the level of returns expected over the next 5 – 10 years.


What to do?

JPMorgan strategists are calling for “greater flexibility in portfolio strategy and greater precision in executing that strategy.”

I agree, to my mind, a set and forget approach won’t be appropriate in a low return environment, where higher levels of market volatility are also likely.

Naturally they are calling for a greater level of portfolio diversification and are recommending, Corporate bonds, Emerging market equities and bonds, U.S. real estate, Private equity, and Infrastructure investment.  The last three are unlisted investments.


Personally, I think the death of 60/40 Portfolio is occurring for more fundamental reasons. The construction of portfolios has evolved, more advanced approaches are available.

For those interested I covered this in more detail in a recent Post: Evolution within the Wealth Management Industry, the death of the Policy Portfolio. (The Policy Portfolio is the 60/40 Portfolio).

The current market environment might quicken the evolution in portfolio construction.


Modern day Portfolios should reflect the lessons learnt over time, particularly from the Dot Com market collapse and the Global Financial Crisis (GFC or Great Recession).

Understanding the history of Portfolio Diversification is important. Modern Portfolio Theory (MPT) was developed in the 1950s and resulted in the 60/40 portfolio.

Although MPT is still relevant today, the Post on the Short History of Portfolio Diversification highlights much more has been learnt since the 1950s.


Furthermore, we can now more easily, and more cheaply, gain greater portfolio diversification.  This includes an increasing allocation to alternative investment strategies and smarter ways to access investment returns.

This in part reflects the disaggregation of investment returns as a result of increased computer power and advancements in investment research.

As a result, Portfolios do not need to be over reliant on equities and fixed income to generate returns. A broad array of risks and return sources should be pursued.

This is particularly important for portfolios that have regular cashflows.  High listed equity allocations in these portfolios is a disaster waiting to happen e.g. Charities, Foundations, Endowments.

While those near or just entering retirement are vulnerable to Sequencing Risk and should look to diverse their portfolio’s away from listed equities.


There is still a place for active management, where real skill and truer sources of excess return are worth exploring and accessing. In fact, they complement the above developments.

There are shades of grey in investment returns, as a result the emotive active vs passive debate is out-dated.


I think KiwiSaver Investors are missing out and their portfolios should be more diversified.


Happy investing.

Please see my Disclosure Statement


Global Investment Ideas from New Zealand. Building more Robust Investment Portfolios.

What does Portfolio Diversification look like?

What does a diversified portfolio look like?

This is answered by comparing a number of portfolios, as presented below.

Increasingly Institutional investors accept that portfolio diversification does not come from investing in more and more asset classes. This has diminishing diversification benefits.   Investors are compensated for being exposed to a range of different risks.

True portfolio diversification is achieved by investing in different risk factors that drive the asset classes e.g. duration, economic growth, low volatility, value, illiquidity, and growth.

As a result, the inclusion of alternative investments is common place in many institutionally managed portfolios.


This Post draws heavily on a number of sources, including a very good article by Willis Tower Watson (WTW), Lets get the balance right.

The WTW article is extensive and covers a number of issues, of interest for this Post is a comparison between WTW Model portfolio and 30%/70% low cost Reference Portfolio (30% Cash and Fixed Income and 70% Equities).

To these portfolios I have compared a typical diversified portfolio recommended by US Advisors, sourced from the following Research Affiliates research paper.


Lastly, I have compared these portfolios to the broad asset allocations of the KiwiSaver universe.  Unfortunately I don’t have what a typical New Zealand Advisor portfolio looks like.

I have placed the data into the following Table for comparison, where Domestic reflects Australia and US respectively.

WTW Model Reference Portfolio Typical US Advisor
Domestic Cash 2.0%
Domestic Fixed Interest 13.0% 15.0% 28.0%
Global Fixed Interest 15.0%
Domestic Equities 15.0% 25.0% 35.0%
International Equities 20.0% 40.0% 12.0%
Emerging Markets 5.0% 5.0% 4.0%
Listed Property 3.0%
Global Property 3.0%
Listed Infrastructure 3.0%
Alternative Beta 8.0%
Hedge Funds 7.0% 8.0%
Private Equity 8.0% 4.0%
Unlisted Infrastructure 5.0%
Alternative Credit 8.0%
US High Yield 4.0%
Commodities / Real Estate 4.0%
Emerging Markets Bonds 1.0%
100.0% 100.0% 100.0%
Broad Asset Classes
Cash and Fixed Income 15.0% 30.0% 28.0%
Listed Equity 49.0% 70.0% 51.0%
Non Traditional 36.0% 0.0% 21.0%
100.0% 100.0% 100.0%

Non Traditional are portfolio allocations outside of cash, listed equities, and fixed income e.g. Private Equity, Hedge Funds, unlisted investments, alternative beta

The Table below comes from a previous Kiwi Investor Blog, KiwiSaver Investors are missing out, comparing Australian Pension Funds, which manage A$2.9 trillion and invest 22.0% into non-traditional assets, and KiwiSaver Funds which have 1% invested outside of the traditional assets. Data is sourced from Bloomberg and Stuff respectively.

Allocations to broad asset classes KiwiSaver Aussie Pension Funds
Cash and Fixed Interest (bonds) 49 31
Equities 48 47
Other / non-traditional assets 1 22

From my own experience, I would anticipate that a large number of Australian Pension Funds would have a larger allocation to unlisted infrastructure and direct property than outlined above.


If a picture tells a thousand words, the Tables above speak volumes.

The focus of this blog is on diversification, from this perspective we can compare the portfolios as to the different sources of risk and return.


It is pretty obvious that the Reference Portfolio and KiwiSaver Funds have a narrow source of diversification and are heavily reliant on traditional asset classes to drive performance outcome. Somewhat concerning when US and NZ equities are at historical highs and global interest rates at historical lows (the lowest in 5,000 years on some measures).

Furthermore, as reported by the Bloomberg article, the allocations to non-traditional assets is set to continue in Australia ”with stocks and bonds moving higher together, investors are searching for other areas to diversify their investments to hedge against the fragile global economic outlook. For the world’s fourth largest pension pot, that could mean more flows into alternatives — away from the almost 80% that currently sits in equities, bonds or cash.”

Globally allocations to alternatives are set to grow, as outlined in this Post.


The WTW Model portfolio has less of a reliance on listed equity markets to drive investment returns, maintaining a 49% allocation relative to the Reference Portfolio’s 70%.

Therefore, the Model Portfolio has a broader source of return drivers, 36% allocated to non-traditional investments.  As outlined below this has resulted in a similar return over the longer term relative to the Reference Portfolio with lower levels of volatility (risk).


Concerns of current market conditions aside, a heavy reliance on listed equities has a number of issues, not the least a higher level of portfolio volatility.

The Reference Portfolio and the KiwiSaver portfolios have a high allocation to equity risk. In a portfolio with a 65% allocation to equities, over 90% of the Portfolio’s total risk can be attributed to equities.

Maintaining a high equity allocation offers the prospect of higher returns, it also comes with higher volatility, and a greater chance for disappointment, as there is a wider range of future outcomes.

Although investors can experience strong performance, they can also experience very weak performance.


Comparison Return Analysis

Analysis by WTW highlights a wide variation in likely return outcomes from a high listed equity allocation.

By using 10 year performance periods of the Reference Portfolio above, since 1990, returns over a 10 year period varied from +6.4% p.a. above cash to -1.5% p.a below cash.

It is also worth noting that the 10 year return to June 2019 was the Cash +6.4% p.a. return. The last 10 years has been a very strong period of performance. The median return over all 10 year periods was Cash +2.6% p.a.


The returns outcomes of WTW Model are narrower. Over the same performance periods, 10 year return relative to Cash range from +6.2% and +0.2%.


Over the entire period, since 1990, the Model portfolio has outperformed by approximately 50bps, with a volatility of 6% p.a. versus 8% p.a. for the Reference Portfolio, with significantly lower losses when the tech bubble burst in 2002 and during the GFC. The worst 12 month return for the Reference Portfolio was -27% during the GFC, whilst the Model Portfolio’s loss was 22%


A high equity allocation is detrimental to a portfolio that has regular cashflows i.e. Endowments, Charities, and Foundations.  They need to seek a broad universe of return streams. This was covered in a previous Post, Could Buffet be wrong?

Likewise, those near or in the early stages of retirement are at risk from increased market volatility and sequencing risk, this is cover in an earlier Post, The Retirement Planning Death Zone.

For those wanting a short history of the evolution of Portfolio Diversifications and the key learnings over time, this Post may be of interest.


Let’s hope we learn from the Australian experience, where there has been a drive toward lowering costs. There is a cost to diversification, the benefits of which accrue over time.

As WTW emphasises, let’s not let recent market performance drive investment policy. The last 10 years have witnessed exceptional market returns, from which the benefits of true portfolio diversification have not been visible, nor come into play, and the low cost investment strategy has benefited. The next 10 years may well be different.


In summary, as highlighted in a previous Post, KiwiSaver Investors are missing out, their portfolios could be a lot more robust and better diversified. The risks within their portfolios could be reduced without jeopardising their long-term investment objectives, as highlighted by the WTW analysis.


Happy investing.

Please see my Disclosure Statement


Global Investment Ideas from New Zealand. Building more Robust Investment Portfolios.