KiwiSaver Balance Fund’s Strategic Asset Allocation (SAA) Analysis

A review of KiwiSaver Balanced Funds, which are soon to become the Default Option, highlights:

  • A heavy reliance on equities to drive return outcomes – there are few return engines outside of equities.
  • Limited portfolio diversification – likely resulting in higher levels of portfolio volatility across a full market cycle (which could be dampened down for the benefit of investors).
  • A high allocation to Fixed Income – which is a concern in the current market environment.

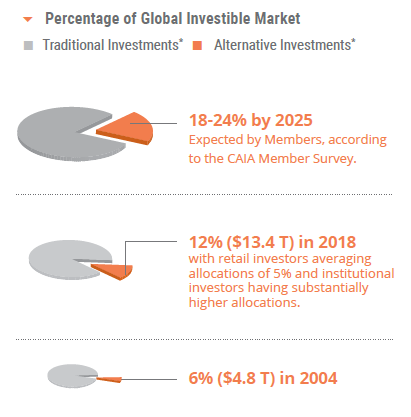
By comparison, Australian Super Funds with similar return objectives to a KiwiSaver Balance Fund have lower allocations to equities despite having higher “growth” asset allocations.  They achieve this by having higher weightings to alternative investment strategies such as Private Equity, Direct Property, Unlisted Infrastructure, Commodities, and Diversified Multi-asset Funds.

Consequently, the Australian Super Funds have lower weights to fixed income relative to their Kiwi peers. There are some nuances amongst asset class allocations of the KiwiSaver Balance Funds, these are similar to those identified from the KiwiSaver Conservative Fund analysis

I think it is fair to say that New Zealand KiwiSaver Funds need greater levels of diversification. 

Often liquidity is sighted as a reason for not investing into alternative investment strategies, to this point:

  • Portfolios often overestimate the level of liquidity they require (see here); and 
  • There are ways of increasing portfolio diversification with more liquid investment options.

Fees may also be playing a part.  Let us hope not, particularly in considering the best outcomes for customers.

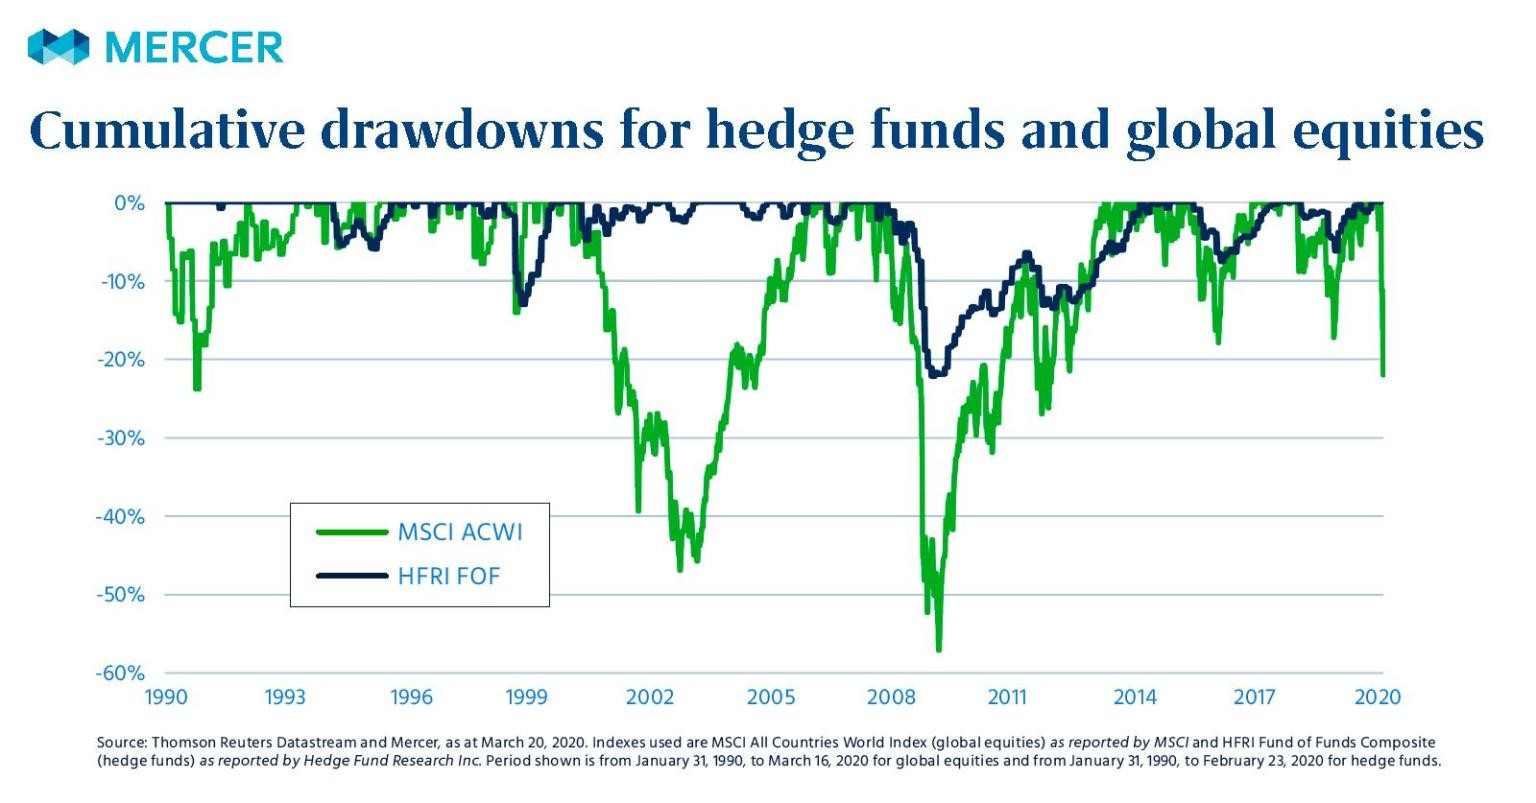
The high allocation to fixed income is also a concern, particularly at this juncture in the economic and market cycles. 

Fixed Income was recently described as a “slow moving train wreck” at a recent industry event in New Zealand, Heathcote Investment Partners’ Meet the Manager series, see Toot, toot: what to do when bonds go off the rails | Investment News NZ

The traditional roles of Fixed Income are likely to be challenged in the years ahead:

  • Returns are highly likely to be lower than those delivered from fixed income over the last 10-20 years; and
  • The risk mitigation characteristics of fixed income are also likely to be lower in the years ahead.

Purely from a risk management perspective, Kiwi investors should be looking to increase the genuine level of diversification within their portfolios – by lessening the role of equities and exploring investment options to substitute/complement fixed income allocations.

Personally, I am not convinced of moving the KiwiSaver Default Fund to a Balanced Fund option is the right solution.  My views can be found here.  It is clearly ridiculous to have a 20- and 55-year-old Default KiwiSaver investor in the same investment strategy. 

My preference would be for Target Date / Life Cycle / Life Stage type funds as the Default Options – these align more with the financial planning theory.  The criticism of these type of Funds is often incorrectly positioned, I provide a defense of Target Date Funds here.

Analysis of KiwiSaver Balanced Funds

The Table below provides average, min, and max allocations of the Strategic Asset Allocations (SSA) for 12 KiwiSaver providers, sourced from their latest Statements of Investment Policy and Objectives (SIPO). 

Most of these managers are currently Default KiwiSaver Providers.

Income Allocations
 CashNZ
Fixed Income
International
Bonds
Income
Allocations
Averages5.2%12.8%23.7%41.6%
Min1.0%6.0%18.0%39.0%
Max10.0%16.5%28.0%50.0%
Median4.5%14.0%25.3%40.0%
Growth Allocations
 NZ EquitiesInternational
Equities
Other
Equities
  AlternativesGrowth
Allocations
Averages19.1%32.8%5.0%3.2%58.4%
Min11.5%26.0%0.0%0.0%50.0%
Max29.0%40.0%8.0%6.0%61.0%
Median20.0%32.0%5.5%4.0%60.0%

Income Assets

From a top level, the managers are tightly grouped around 40% allocation to Income assets (Cash, NZ Fixed Income and International Bonds). 

A KiwiSaver Balanced Fund is very much the traditional 60/40 portfolio (60% Equities / 40% Fixed Income).

There is one Manager that is an outliner, a truly “Balanced” Fund of 50% Equities and 50% Fixed Income.  There is significant peer risk here and with no published return objective it is not possible to assess the appropriateness of its SAA.  Albeit they will likely be the best performing manager when global sharemarkets fall sharply.  However, over the longer term they are likely to struggle in keeping up with peers.

Within Income Assets

The variation within the Income Assets is consistent with analysis undertaken on the KiwiSaver Conservative Funds, see analysis here, which also includes a review of the risk drivers within Fixed Income, particularly likely variation in duration exposure. 

Growth assets

As would be expected, the Growth Allocation is reasonably tight around 40%, the flip side of the Income Allocation.

Listed equities, including New Zealand equities, international equities, and listed property and infrastructure dominate the growth allocations i.e. there are very little investments into Alternatives. See Tables below.

Of interest, on average Domestic Equities (New Zealand and Australia) make up around 36% of the core equities allocations within the KiwiSaver Funds e.g. domestic and international listed equities ex listed property and infrastructure combined.

Overall, core equities make up 52% of a Fund on average.  This is by far the dominant risk within these portfolios.  On a risk basis, the equities allocations contribute to over 90% of the risks within a “Balanced” portfolio.

Ratio of
Domestic Equities
Core
Listed Equities
Averages36.4%51.9%
Min26.0%42.0%
Max52.7%60.0%
Median35.4%51.8%

The remaining growth allocations are predominately made up of listed Property and listed Infrastructure, with smaller allocations to alternatives.  Direct Property dominates the alternative allocations, with smaller allocations to private equity and more liquid hedge fund type strategies.

Total Listed Equities
Allocation
Alternatives AllocationAlternatives share of
Growth Assets
Averages56.8%3.2%2.7%
Min50.0%0.0%0.0%
Max61.0%6.0%10.0%
Median56.0%4.0%0.0%

Below is the same Data for a broad selection of Australian “Balanced” Funds.

Ratio of
Domestic Equities
Core
Listed Equities
Averages39.8%48.5%
Min0.0%30.0%
Max51.0%62.0%
Median42.6%50.0%
Total Listed Equities
Allocation
Alternatives AllocationAlternatives share of
Growth Assets
Averages52.3%27.2%33.4%
Min30.0%8.0%9.5%
Max76.0%53.0%63.9%
Median50.0%25.0%33.3%

Australian “Balanced” Funds have an 80% allocation to Growth assets but a lower allocation to Core Equities (Australian and International Equities) than their New Zealand counterparts, 48.5% versus 51.9% on average for the Kiwi Funds.

This reflects that the Australian Funds have a higher allocation to Alternatives, which includes investment into Private Equity, Direct Property, Infrastructure, Commodities, and Diversified Multi-asset Funds.

Diversified Multi-Asset Funds

It should be noted that Diversified Multi-Asset Funds can have high allocations to listed equities, therefore some funds have a higher allocation to equities than appears based on sector allocations alone.

Diversified Multi-Asset funds offer “genuine diversification” relative to a traditional balanced fund and are more actively managed.  In addition to investing in the traditional asset classes of equities and fixed income, they also invest into an array of alternative assets, often in more specialised areas and situations.  These Funds seek breadth and depth across asset classes seeking to allocate to different return engines e.g. specialist areas of the health care industry, housing within property, renewable energy, and specialised credit opportunities.

Diversified Multi-Asset Funds offer an authentic option to increase diversification within a traditional portfolio, particularly for those investors who have constraints in relation to fees and liquidity. 

There are several well-resourced managers in Australia with long histories of adding value with these types of funds.

Is it Apples vs Apples?

There is a wide variation in the Growth/Income split between New Zealand and Australian “Balanced” Funds.

Across both risk categories of Conservative and Balanced Funds, although the Australian Funds have higher Growth allocations than the Kiwi Funds, they have a slightly lower allocation to equities.

The difference is a lower allocation to fixed income and a higher alternative allocation in Australia.  The portfolios are more diversified in Australia, this allows them to have a “higher” growth allocation.  They are also most likely better positioned for the years ahead given the current stage in the economic and fixed income market cycles.

Although there is a degree of uniformity amongst the Kiwi Funds, you cannot choose a Fund by its name alone.

A review of the return objectives for both the New Zealand and Australian reveals:

  • The Australian Funds have return objective of CPI + 3% on average, they range from 2.5% to 4%.
  • The New Zealand Funds by and large fail to publish return objectives, those that do range from 2.5% – 3%.

This indicates that the universe of Funds is not too dissimilar from a return objective perspective, and the analysis above provides some real insights for consideration and to ask why the difference?

Personally, I think all managers should publish their return objectives in a CPI+ format.  This is a valuable piece of information for the informed investor along with a Fund’s proposed risk category. 

Please read my Disclosure Statement


Global Investment Ideas from New Zealand. Building more Robust Investment Portfolios.

Investment Framework for a Rising Interest Rates Environment

Amongst the strategies to employ for the current interest rate environment is a Liability Driven Investment (LDI) approach. 

LDI provides a framework for managing retirement income outcomes in what is likely to be a rising interest rate environment over the years ahead. 

LDI places retirement planning goals at the centre of the investment approach leading to several key benefits:

  1. More stable level of income in retirement;
  2. More efficient use of capital – potentially need less retirement savings; and
  3. Better framework to make trade-off between allocation to equities and the retirement income portfolio in improving the likelihood of reaching desired standard of living in retirement.

Under LDI a more customised investment solution can be developed.

Conversely, if an investor runs with a Cash strategy, where the goal is primarily capital preservation, they will likely need additional precautionary savings to meet their income requirements over retirement.

Therefore, while an LDI strategy increases the likelihood of reaching the retirement income objectives, it also achieves this with a more efficient allocation of investment capital.

The additional capital could be used for current consumption or invested in growth assets to potentially fund a higher standard of living in retirement, or used for other investment goals e.g. endowments and legacies.

Accordingly, LDI potentially provides a better framework in which to evaluate the risk of meeting your retirement income goals in a rising interest rate environment.

Retirement Planning (mis) focus

Arguably the primary goal of retirement planning is to provide a stable and secure stream of income in retirement – income to support a desired standard of living in retirement.

However, retirement planning investment approaches often focus too heavily on accumulated wealth e.g. how much do I need to save to retire on?

This could potentially result in the wrong focus.  For example, if a New Zealander retired in 2008 with a million dollars, their annual income would have been around $80k by investing in retail term deposits.  Their income would have dramatically dropped in 2009 to approximately $35k.  That is a big drop in income!  But interest rates have fallen further, currently (Feb 2021) a million dollars invested in New Zealand Term deposits will generate around $10k.

As a result, the focus should not necessarily be on the size of the account value e.g. KiwiSaver account balance.

This reflects that volatility of capital and investment returns are not a true measure of a retiree’s investment risk.

Investment strategies that focus on capital preservation, such as holding high levels of cash and short-term fixed income strategies, are riskier and more volatile relative to the investment goal of generating a stable and secure stream of income in retirement.

Redefining the Retirement Goal

Those planning for retirement seek to secure essential (sufficient income) and aspirational goals (additional wealth accumulation) with a high probability of achieving them.

Accordingly, the goal for retirement can be split between retirement income (essential goals) and wealth accumulation (aspirational goals). 

Those saving for retirement should be focusing on more than accumulated wealth alone. Other key considerations may include a desired level of retirement spending, meeting children’s education costs, healthcare costs, and a legacy.  These can be considered as future liabilities that need to be met.

Consequently, a better measure of a retiree’s investment risk becomes uncertainty around how much spending can be sustained in retirement.

Liability Driven Investing

Liability-driven investment (LDI) strategies, otherwise known as asset-liability management (ALM), take a complete and holistic approach.

LDI explicitly includes an investor’s current and future liabilities e.g., essential and aspirational goals.

The traditional way of building portfolios focusses more on risk tolerance, return expectations, and accumulated wealth rather than achieving the investment goals outlined above.

LDI creates better portfolios, particularly when it comes to retirement needs.  A more robust portfolio is generated, and the focus is on the key investment risk; failure to meet your investment objectives.

Obviously most financial planning processes take into consideration investment and retirement goals. Nevertheless, LDI makes retirement goals the central piece of constructing a portfolio. With LDI, portfolio allocations and management of risks are relative to meeting retirement objectives.

A more customised investment solution is developed.

See here for more on LDI.

The Benefits of LDI

Dimensional Funds Advisors (DFA) undertook analysis comparing two investment strategies relative to the goal of generating a stable and secure level of income in retirement:

  1. Goals based strategy that looks to generate sufficient income in retirement to match expected spending (consumption). This is the LDI strategy.
  2. Capital preservation strategy that is invested in Cash to manage the volatility of the account balance.

The following conclusions can be drawn from the DFA analysis:

  • The LDI strategy provides a more stable stream of income in retirement;
  • The LDI strategy provides greater clarity and confidence to plan for retirement; and
  • The Cash strategy results in a high level of volatility relative to the goal of generating a stable level of income in retirement.

See here for a detailed review of the DFA Research. 

In simple terms, the LDI strategy is a long-term bond portfolio that matches the expected retirement spending/consumption goal. Effectively, the LDI strategy generates cashflows to match future expected spending.

This reduces volatility relative to retirement spending goals.

Insurance Company’s implement a similar approach in meeting (paying out) future expected liabilities (insurance claims).

DFA conclude that “any strategy that attempts to reduce volatility using short- to intermediate-term fixed income, when the goal is a long-term liability like retirement consumption, will not be as effective as the LDI strategy.”

Although cash is perceived as low risk, it is not low risk when it comes to generating a steady and secure stream of income in retirement. Likewise, short term fixed income securities, while appropriate for capital preservation, are risky if the goal is to meet future spending/consumption in retirement.

In summary a LDI strategy provides the following benefits:

  1. More stable level of income in retirement;
  2. More efficient use of capital – potentially need less retirement savings; and
  3. Better framework to make trade-off between allocation to equities and retirement income portfolio in improving the likelihood of reaching desired standard of living in retirement.

If an investor runs with a Cash strategy, where the goal is primarily capital preservation, they will likely need additional precautionary savings to meet their retirement income requirements.

Therefore, while an LDI strategy increases the likelihood of reaching the retirement income objectives, it also achieves this with a more efficient allocation of capital.

This additional capital could be used for current consumption or invested in growth assets to potentially fund a higher standard of living in retirement, or used for other investment goals e.g. endowments and legacies.

Accordingly, LDI potentially provides a better framework in which to assess the risk of meeting your retirement income goals in a rising interest rate environment.

LDI Investment Framework for Individuals

Under the LDI model there are two portfolios: the liability portfolio and a return seeking portfolio. Most investment products offered today are return seeking portfolios with some dampening down of risk (measured by volatility of returns).

LDI is used by pension funds and insurance companies where their investment objectives and portfolios are primarily reflected in the terms of their future liabilities.

“Institutional” investment approaches such as LDI, Two-portfolio separation, and being more dynamic, are finding their way into wealth management solutions.

Goals-Based Investing is the wealth management counterpart to LDI. By way of example is EDHEC Risk Institute Goal-Based Investing Approach.

EDHEC suggest investors should maintain two portfolios:

  1. Goal-hedging portfolio – this replicates future replacement income goals; and
  2. Performance-seeking portfolio – this portfolio seeks returns and is efficiently diversified across the different risk premia – disaggregation of investment returns.

And, over time the manager dynamically allocates to the hedging portfolio and performance seeking portfolio to ensure there is a high probability of meeting retirement income levels.

Nevertheless, and most importantly, the Goal Based Investment framework outlined by EDHEC focuses on the goal of generating income in retirement.

Instead of worrying about fluctuations in capital, investors investing for retirement should worry about fluctuations of income in retirement.

With regards to capital specifically, the focus should be on avoiding permanent loss of capital, rather than fluctuations in capital.

See here for more on the EDHEC Goals Based Investment approach.

Please read my Disclosure Statement


Global Investment Ideas from New Zealand. Building more Robust Investment Portfolios.

Competitor Analysis KiwiSaver Conservative Funds – the value of a good investment strategy

An analysis of KiwiSaver Conservative Funds identifies a variation in underlying asset allocations, despite there being a generic look at a higher level (Income / Growth split).

The area of most pronounced difference is within the Income asset class allocations: Cash, New Zealand Fixed Income, and International Bonds.  There are also nuances within each of these asset classes, particularly level of benchmark duration risk.

These differences will drive performance outcomes, having nothing to do with active management skill and very little in relation to fees paid.

Portfolio performance is primarily driven by portfolio construction and implementation decisions.  The value of a good investment strategy.

Within the Income asset classes, the decision on duration and credit quality will drive performance (absolute returns and relative to peers).  These decisions impact return outcomes over both the short and longer term.

A comparison to Australian Super Funds with similar objectives provides useful insights into asset allocation decisions being made in New Zealand.

Analysis of Balance and Growth KiwiSaver Funds has also been undertaken and will be provided at a later date.

Analysis of KiwiSaver Conservative Funds

The Table below provides average, min, and max allocations of the Strategic Asset Allocations of 12 KiwiSaver Providers’ Conservative Funds, sourced from their latest Statements of Investment Policy and Objectives (SIPO).

  Cash Fixed Income
NZ
Fixed Income
International
Income
Allocation
Average 15.6%22.7%39.1%77.4%
Min1.0%14.0%28.0%70.0%
Max30.0%36.0%50.0%82.0%
Median17.3%23.0%40.5%79.0%
 Listed Equities
New Zealand
Listed Equities
International
Listed
Property
AlternativesGrowth
Allocation
Average6.6%12.4%4.0%2.1%22.7%
Min4.0%9.0%0.0%0.0%18.0%
Max9.5%16.0%7.5%5.0%30.0%
Median6.3%12.5%4.0%1.6%21.0%

Income Assets

From a top level, by and large the managers are tightly grouped around 77% allocation to Income assets (Cash, NZ Fixed Income and International Bonds). 

There are a small group of four managers which are outliners, with income allocations closer to 70%.  

This group is materially different from the bulk of the managers.  They tend to have lower cash allocations and much higher equity allocations. Only one of these managers has a material weighting outside of the listed equity markets e.g. Alternatives.

Within Income Assets

The variation within Income asset class occurs at both the asset allocation and performance benchmark level.  Both of which drive performance outcomes.

As can be seen from the Table above the variation in the allocation to Cash is extreme. Ranging from 1.0% to 30.0%.

Maintaining high levels of cash does not make a portfolio less risky. High levels of cash can raise risks relative to certain investment objectives, particularly if the investor is seeking a stable and more predictable income stream in retirement.

High levels of cash increase the variation of income in retirement and is less effective in providing portfolio protection at the time of sharp sharemarket declines.  On both counts, longer maturing fixed income provides a better solution.  See here for why holding high levels of cash at retirement can be scandalous.

Given the current environment of very low interest rates and higher equity market valuations in the US and NZ, a higher weighting to cash could be warranted.

The key benefits of cash are that it is highly liquid, provides emergency funds without impacting longer-term investments, and can arguably be “dry powder” funds when sharemarkets decline sharply.  The key to the dry powder factor is having the investment discipline to act accordingly.

The allocations to Fixed Income (NZ Fixed Income and Global Bonds) are tighter, ranging from 50% – 76%, and averaging around 62%.

The allocation International Bonds is higher relative to domestic Bonds, on average making up 64% of the Fixed Income Allocations. International Bonds are the largest asset allocation weight within the portfolios of just under 40%.

Risk and Investment Management

From a risk management, and investment management perspective, a portfolio’s capital allocations to cash, NZ Fixed Income, and International Bonds are less relevant relative to the Portfolio’s duration and credit exposures.

A more accurate way of looking at risk, and managing a portfolio, is a Portfolio’s level of duration and credit exposure.

Duration is a key risk measure, and in general reflects a portfolios capital value sensitivity to changes in interest rates. Duration is measured in years.  For example, assuming your Portfolio’s duration is 6 years, if interest rates rise by 1% the portfolio will decline by 6%, all else being equal.

See here for an explanation of Duration and here for credit risk.

Generally, those with a higher allocation to International Bonds have a higher level of interest rate risk.  These portfolios would have benefited more from the significant decline in interest rates over the last 20 years.

From a high level, the range in total Portfolio duration is estimated to be:

Total Portfolio Duration
Average 4.06
Min 3.27
Max 5.01
Median 3.99

These are estimates, based on current index duration and portfolio asset allocations.  The key points are, this is a more accurate view of portfolio risk and there is a reasonable spread in duration risk amongst the managers.

From this perspective, investors must be careful in assessing the relative risk of a Conservative Fund based on asset allocations alone.

By way of example, some Managers manage to a lower duration international bond index.  Thus, despite having a higher international bond allocation these Portfolios may have lower interest rate risk (duration) than a portfolio with a lower international bond allocation but managing to a higher duration index. They may also have the same level of interest rate risk!

Therefore, what is important is how much duration risk a portfolio should have in meeting its investment objectives.

From an investment governance perspective, Investment Committees should not be debating the level of allocation to cash, international, or NZ fixed interest without first considering what is the most appropriate level of portfolio duration risk to target in meeting investment objectives.  This is a different conversation and focus.

There is evidence that at least one of managers takes such an approach, maintaining a very low allocation to cash and a high allocation to Fixed Income.  This portfolio is not necessarily riskier than the other Funds just because it has a low cash holding.

Lastly, it should be noted that the duration on the International Bond Index has almost doubled over the last 10 years.  Therefore, if portfolio allocations to international bonds have remained static over the last 10 years, the risk of this allocation has increased along with the total portfolio’s risk profile.  Unfortunately, with interest rates so low, the return prospects are less, yet the risks have increased.

For more on the unintended risks within fixed income see here

Growth asset

As would be expected, the Growth Allocation is reasonably tight around 23%, the flip side of the Income Allocation.

Listed equities, including New Zealand equities, international equities, and listed property and infrastructure dominate the growth allocations i.e. there is very little investment in Alternatives.

Direct Property dominates the Alternative allocations.

Of interest, on average Domestic equities (New Zealand and Australia) make up around 35% of the core equities allocations e.g. domestic and international listed equities ex listed property and infrastructure.

Overall, core equities make up 19% of portfolios, domestic equities are around 6.5% of a Conservative Portfolio.

Ratio of Domestic Equities
in Core Equities Allocation
Core Listed Equities
Portfolio Allocation
Average 34.5%19.0%
Min25.0%13.0%
Max47.4%22.5%
Median31.5%19.5%

The Growth allocations will be discussed in more depth when presenting the results of the Balance and Growth Fund’s allocations.

Australian Fund Comparison

The Table below presents the average, min, max, and medium asset allocations of the largest Super Funds in Australia.  This list is dominated by Industry Funds.

The list includes funds with Conservative in their name and/or have similar return objectives to the KiwiSaver Funds.  The return objectives are express as inflation plus a margin e.g. CPI + 1.0%.

The following quick observations can be made:

  1. The Australian Funds have lower allocations to Income Assets than the New Zealand Funds, this is consistent with the Australian Funds having higher CPI + return objectives.  A return objective is necessary to undertake portfolio modelling. Also, don’t always choose a Fund my its name!
  2. At the same time, the Aussie Funds have much higher Cash allocations relative to the NZ Funds.
  3. The above means the Australian Funds have much lower Fixed Income allocations.  They also only show Fixed Income, not domestic and international bonds breakdown, which is consistent with the discussion above.
  4. Interestingly, the listed equity allocation is in line with the Kiwi Funds, around 20%.  However, the weighting in Australia to domestic equities in the total core equities allocation is closer to 50%, compared to 35% in NZ.  Domestic equities make up around 9% of a Conservative Fund in Australia, compared to 6.5% in New Zealand. Albeit, the Australian Funds do have a higher risk profile.
  5. The Australian Funds have significantly higher allocations to Alternatives than the NZ Funds.  When you consider a similar core equities allocations and higher cash allocations in Australia, the higher Alternatives allocation comes at the expense of Fixed Income.
Australian
Super Funds
CashFixed IncomeIncome
Allocation
Average27.5%36.7%59.6%
Min23.0%28.5%53.0%
Max37.0%67.0%67.0%
Median25.0%30.3%58.3%
Listed Equities
Domestic
Listed Equities
International
AlternativesGrowth
Average9.1%11.1%21.8%40.4%
Min7.0%7.0%6.0%33.0%
Max11.5%17.5%29.5%47.0%
Median9.5%10.5%24.0%41.8%

The Alternatives allocation will be discussed in more depth when presenting the results of the Balance and Growth Fund’s allocations.

Please read my Disclosure Statement

 Global Investment Ideas from New Zealand. Building more Robust Investment Portfolios.

Are Investment products meeting people’s needs over their working life?

A key finding by the Australian Productivity Commission is that “Well-designed life-cycle products can produce benefits greater than or equivalent to single-strategy balanced products, while better addressing sequencing risk for members.

There are also good prospects for further personalisation of life-cycle products that will better match them to diverse member needs, which would require funds to collect and use more information on their members.

Some current MySuper life-cycle products shift members into lower-risk assets too early in their working lives, which will not be in the interests of most members.”


This is one of many findings from of the 2018 Australian Productivity Commission Inquiry Report, Superannuation: Assessing Efficiency and Competitiveness.

Mysuper is a default option in Australia, similar to the Default Options by Kiwisaver providers in New Zealand and around the world.


The above findings are from the Section 4, Are Members needs being met, of the report (pg 238). This section, 4.3, Are products meeting people’s needs over their working life?, focuses on Life Cycle Funds. (Lifecycle Funds are often referred to as target-date funds in the United States, the United Kingdom, and other countries. They are popular in the US, accounting for 25% of their saving for retirement assets, and growing.)

Life cycle Funds, also referred to as Glide Path Funds, reduce the equity allocation in favour of more conservative investments, fixed interest and cash, as the investor gets closer to retirement.


Section 4.3 concludes “the Commission now recognises the value of well-designed MySuper life-cycle products, and the potentially significant gains that could arise from further personalisation.”

As covered in the report, they highlight that the poorer products currently on offer “requires some cleaning.”


Two areas of Section 4.3 are of interest to me.


The relative attractiveness of Lifecycle Funds

The report covers the varying views on Lifecycle Funds.

On this the Commission notes that the underperformance of some Lifecycle Funds does not “repudiate the principle of varying the management of risk as a person ages.”

Importantly, the “costs and benefits of life-cycle products depend on their design and on the characteristics of fund members (for example, the size of their balance).”

They note “the determinant of the variation between life-cycle products is the glide path from growth to defensive assets as the member ages”

“The lowest average retirement balances occur for life-cycle products with accelerated transitions to defensive assets as the member ages.”


As noted by several submissions, Lifecycle Funds can provide better outcomes if they maintain a higher growth allocation in the earlier years of saving for retirement. They also offer additional benefits in market downturns, particularly closer to retirement, they produce less poor outcomes than a standard single-strategy product, such as a Balanced Fund i.e. they manage sequencing risk better.


The criticism of Lifecycle Funds is often associated with poor design, as covered in this Post.


Increased Customisation of the Investment Solution

It is important to appreciate that not one investment product can meet all investor’s needs.  It does not make sense for a 29 year old and a 50 year to be in the same Default Fund.

This is an attractive feature of Lifecycle Fund offerings, they can be more tailored to the investor.

Specifically, they can be tailored for more than just age, such as Balance size, and this can in the majority of cases result in better outcomes for those saving for retirement. As outlined in this research article by Rice Warner.  Tailored investment solutions boost retirement savings outcomes.


On this point the Commission’s Report notes “There is significant scope for more personalised MySuper products”…

Specifically there is the scope to customise the investment strategy of Lifecycle Funds beyond age.

The report outlined a submission that observed that “… data and technology provide the opportunity for giant advancements in the design of personalised lifecycle strategies. Such strategies could account for: age, balance, contribution rate (which entails non-contribution due to career breaks etc), gender, expected returns, [and] risk.”

“Ultimately, individualised product design could also take into account other member characteristics, such as household assets, income from any partner and the potential capacity to extend a working life if there are adverse asset price shocks.”


The following two submissions in relation to Lifecycle Funds by David Bell and Aaron Minney are well worth reading for those wanting a greater understanding and appreciation of broader topics associated with Lifecycle Funds.

These submissions are also well worth reading by those interested in designing effective investment solutions for those saving for retirement.


Happy investing.

Please see my Disclosure Statement


Global Investment Ideas from New Zealand. Building more Robust Investment Portfolios.


Tailored Investment solutions boost superannuation outcomes – Lifecycle Funds outperform Balanced Funds

A greater level of customisation leads to better investment outcomes for investors.

For example, Multifactor Lifecycle Funds that focus on age and size of account balances are best placed to last the distance as we live for longer in retirement, compared to a Balanced Fund and Lifecycle Funds that focus on age alone.

Multifactor Lifecycle Funds:

  1. Generate higher expected lifetime income relative to a Balanced Fund (70% equities and 30% Fixed Income and Cash); and
  2. Outperform a Balanced Fund over 90% of the time based on a numerous number of different market and economic scenarios.

These are the key findings of the Rice Warner’s research paper: Lifecycle Design – To and Through Retirement.

Lifecycle Funds, also referred to as Glide Path Funds, Target Date Funds, or Lifestages Funds, reduce the equity allocation in favour of more conservative investments, fixed interest and cash, as the investor approaches retirement.


Rice Warner found that somebody aged 30 with an opening balance of $26,000 and invested in a Multifactor Lifecycle Fund had a 91.8% chance of outperforming a Balanced Fund by the time of retirement at age 63.

Their research also found that by investing in a Multifactor Lifecycle Fund the expected retirement income is up to 35% higher than that expected from a Balanced Fund (Source: Australian AFR The product that can boost super by 35pc).

For somebody aged 60 with an account balance of $118,300, a Multifactor Lifecycle Fund had a 72.4 per cent chance of outperforming a Balanced Fund.

Lastly, Second Generation Lifecycle Funds, which reduce their growth allocation later, outperformed a Balanced Fund 91.2% of the time. A Multifactor Lifecycle Fund outperforms a Second Generation Lifecycle Fund 84.6% of the time.


A key conclusion from the Rice Warner research is that Lifecycle strategies that use factors in addition to age, such as superannuation account balance size, provide the ability to better tailor a portfolio to enhance outcomes for those saving for retirement. Therefore, they often outperform other investment strategies.


They achieve this by adopting a more growth-oriented stance while an investor has a long investment horizon and shifting to defensive assets when the investor’s investment horizon grows short.

Importantly, an individual’s investment horizon is a function of not only age but also the size of their superannuation account. This is an important concept, the rationale is provided in the section below – The Benefits of a Multifactor Lifecycle Fund.


A summary of the Rice Warner analysis is provided below, along with key Conclusions and Implications for those aged 30 and 60.

A copy of the Rice Warner analysis can be found here.


To my mind, there is going to be an increased customisation of investment solutions available for those saving for retirement that will consider factors beyond age e.g. account size, salary, and assets outside of Super.  Some are available already.

Technology will enable this, Microsoft and BlackRock are well advanced in collaborating, BlackRock and Microsoft want to make retirement investing as easy as ordering an Uber.


In relation to Lifecycle Funds, they are subject to wide spread criticism.

Some of this criticism is warranted, nevertheless, often the criticism is the result of the poor design of the Fund itself, rather than concept of a Lifecycle Fund itself. This is highlighted in the Rice Warner research, where the first Generation of Lifecycle Funds de-risk to early.

I covered the criticism of Lifecycle Funds in a previous Post, in the defence of Lifecycle Funds.


Lifecycle Funds can be improved upon. For example a more sophisticated approach to the management of the Cash and Fixed Interest allocation, this is well documented by the research undertaken by Dimensional Funds Advisors which I covered in a previous Post.


In my opinion, all investments strategies would benefit from a greater focus on tangible investment goals, this will lead to a more robust investment solution.

A Goals based investing approach is more robust than the application of “rule of thumbs”, such as the 4% rule and adjusting the growth allocation based purely as a function of age.

Goals based investing approaches provide a better framework in which to assess the risk of not meeting your retirement goals.

Greater levels of customisation are required, which is more relevant in the current investment environment.


Rice Warner – The benefits of Multifactor Lifecycle Funds

Investment literature indicates that an investor’s investment horizon is a key determinant of an appropriate investment strategy.

The consequence of longer investment horizons allows an investor to take on more risk because even if there is a severe market decline there is time to recover the losses.

Furthermore, and an important observation, Rice Warner’s analysis suggests that as we enter retirement investment horizon is a function of age and size of the superannuation account balance.

A retiree with a larger account balance has in effect a longer investment horizon. They are in a better position to weather any market volatility.

This reflects, that those with a small account size typically withdraw a greater proportion of their total assets each year, indicative of largely fixed minimum cost of living, resulting in a shorter investment horizon.


A very big implication of this analysis is that an investor’s investment horizon is “not bounded by the date that they choose to retire (though this point is relevant). This is as a member is likely to hold a substantial proportion of their superannuation well into the retirement phase, unless their balance is low.”

“One consequence of this is that investment strategies which consider this retirement investment horizon may deliver better outcomes for members – both to and through retirement. This is because as a member’s account balance grows, sequencing risk becomes less relevant allowing higher allocations to growth assets.”

For those wanting a better understanding of sequencing risk, please see my earlier Post.


Rice Warner conclude, Lifecycle strategies that use factors in addition to age, such as superannuation account balance size, provide the ability to better tailor a portfolio to provide enhanced outcomes for those saving for retirement. Therefore, they often outperform other investment strategies.

Thus, the title of their research Paper, Lifecycle Design – To and Through Retirement, more often than not investors should still hold a relatively high allocation to growth assets in retirement.  They should be held to the day of retirement and throughout retirement.

The research clearly supports this, a higher growth asset allocations should be held to and through retirement.  In my mind this is going to be an increasingly topically issue given the current market environment.


Rice Warner Analysis

Rice Warner considered several investment strategies applied to various hypothetical members throughout their lifetime.

They assess the distribution of outcomes of the investment strategies to establish whether adjustments can be made to provide members with better outcomes overtime.

Rice Warner considered:

  1. Balanced Strategy which adopts a fixed 70% allocation to Growth assets.
  2. High Growth strategy which adopts a fixed 85% allocation to Growth assets.
  3. First-generation Lifecycle (Lifecycle 1 (Age)) with a focus on defensive assets and de-risking at young ages.
  4. Second-generation Lifecycle (Lifecycle 2 (Age)) with a focus on growth assets and de-risking at older ages.
  5. Multi-dimensional Lifecycle (Lifecycle (Age and Balance)) which adopts a high allocation to growth assets unless a member is at an advanced age and has a low balance.

Six member profiles selected to capture low, moderate, and high wealth members at ages 30 and 60.

Rice Warner then considered the distribution of expected lifetime income under a range of investment scenarios using a stochastic model.

This allowed for a comparison of the income provided to members under each strategy in a range of investment situations for comparative purposes.


Conclusions

Rice Warner Conclude:

  • Investment horizon is a critical driver in setting an appropriate investment strategy. Investment strategies should take into consideration a range of investment horizon, both before and after retirement.
  • Adopting high allocations to growth assets is not inherently a poor strategy, even in cases where members are approaching retirement. These portfolios will typically provide:
    • Improved outcomes in cases where members are young, or investment performance is strong;
    • Marginally weaker outcomes where members are older and investment performance is weak.
  • Second-generation Lifecycle investment strategies (focused on growth assets and late de-risking) will typically outperform first generation strategies (which are focused on defensive assets and de-risking when a member is young).
  • Growth-oriented constant strategies will typically outperform First-generation Lifecycle strategies, except where investment performance is poor.
  • Designing Lifecycle strategies that use further factors in addition to age (such as balance) provide the ability to better tailor a portfolio to provide enhanced outcomes by:
    • Adopting a more growth-oriented stance while a member has a long investment horizon.
    • Shifting to defensive assets when a member’s investment horizon grows short.


Implications

Overall the results, aged 30:

  • High Growth strategies can provide significant scope for outperformance with minimal risk of underperformance relative to a Balanced Fund due to the members’ long investment horizon.
  • First-generation Lifecycle strategies will typically underperform each of the other strategies considered except where investment outcomes are poor for a protracted period. This underperformance is a result of the defensive allocation of these strategies being compounded over the member’s long investment horizon.
  • Second-generation Lifecycle can mitigate the risk faced by the members over their lifetime, albeit at the cost of a reduced expected return on their portfolio relative to a portfolio with a higher constant allocation to growth assets.
  • Lifecycle strategies which adjust based on multiple factors are able to manage the risk and return trade-off inherent to investments in a more effective way than single strategies or Lifecycle strategies only based on age. This is a result of the increased tailoring allowing the portfolio to adopt a more aggressive stance when members are young and thereby accumulate a high balance and extend their investment horizon further. This leads to this portfolio often outperforming the other strategies considered.


For those aged 60

  • High Growth strategies can provide significant outperformance in strong investment conditions. This comes at the cost of a modest level of underperformance in a poor investment scenario (a reduction in total lifetime income for members ranging between 2% and 5% relative to a Balanced fund).
  • First-generation Lifecycle strategies will underperform in neutral or strong market conditions due to their lack of growth assets. In cases where investment performance is poor these strategies outperform the other strategies considered particularly for those with low levels of wealth (due to their short investment horizons).
  • Two-dimensional Lifecycles provide enhanced risk management (but not necessarily better expected performance) by providing:
    • Protection for members who are vulnerable to sequencing risk with short investment horizons (low and moderate wealth profiles) by adopting a Balanced stance.
    • High allocations to growth for members whose investment horizon is long (high wealth profiles).


Good luck, stay healthy and safe.


Happy investing.

Please see my Disclosure Statement


Global Investment Ideas from New Zealand. Building more Robust Investment Portfolios.


CAIA Survey Results – The attraction of Alternative Investments and future trends

Alternative Investments have doubled as a share of global asset markets since 2003.

They have moved from 6% or $4.8 trillion of the global investment universe in 2003 to over $13.4 trillion, or 12% of the global investment universe in 2018.


CAIA Association members expect alternatives to grow to between 18% and 24% of the global investible universe by 2025.

Further growth is expected, based on the combination of very low interest rates, the shortfall in superannuation accounts to meet future retirement obligations, the maturing of emerging markets, and structural shifts in capital formation e.g. companies are remaining private for longer.

Private equity and venture capital are expected to benefit most from the future growth in alternative investments.

Private debt and real asset allocations are also expected to grow.

Although future growth in liquid alternatives is expected, hedge fund growth is anticipated to trail.


Manager selection is key to success within the alternatives universe given the dispersion in manager performance.


These are the key findings of the recently published CAIA Association report, The Next Decade of Alternative Investments: From Adolescence to Responsible Citizenship.

The assessments and predictions of the survey are based on the results of a comprehensives survey of over 1,000 CAIA members.

CAIA = Chartered Alternative Investment Analyst, the Association website can be accessed here.


The Attraction of Alternatives

CAIA members expect alternatives to grow to between 18 – 24% of the global investible universe by 2025, as highlighted in the following graph from the CAIA report.

Percentage of Global Investible Market CAIA

Of note, Retail investors have around 5% of their investments in alternatives, institutional investors have substantially higher allocations.

This is significant, it is increasingly becoming apparent that continuing to invest in cash, fixed income, and developed market sharemarket alone is unlikely to generate the returns necessary to meet future retirement obligations.

Those saving for retirement have several options, including:

  1. Reducing their expectations as to the standard of living they wish to have in retirement;
  2. Increase their level of savings = work longer and/or forgo current consumption for a higher level of consumption in retirement; and
  3. Find new sources of returns.


From a portfolio perspective, the introduction of alternative investments, including hedge funds, liquid alternatives, private equities, and real assets can provide new sources of returns.

Investing outside of the developed markets, with appropriate exposures to emerging market currencies, fixed income, and equities can also provide new sources of return for many portfolios. The current environment offers several potential opportunities outside the developed and traditional fixed income markets.


In relation to alternatives, they are generally added to portfolios for two primary reasons:

  • Enhance Returns e.g. private equity and venture capital
  • Diversification – e.g. hedge funds and liquid alternative to reduce portfolio declines at time of severe sharemarket market fails as currently experienced.

Inflation hedging and yield enhancements are other reasons for allocated toward alternatives.

The following graph presents the rationale for investing in alternatives based on the CAIA Members surveyed.

Rationale for investing in Alternatives CAIA


As an indication to how much institutional investors have invested in alternatives, US Pension Funds increased their allocation to alternatives from 8.7% to 15.7% over the period 2001 and 2009.

Since 2009 they have increased their alternative allocations to 27%. The largest allocations include Private Equity, Real Estate, and hedged funds.


Interestingly, more than 50% of CAIA Association Members expect to have a greater allocation to private equity and venture capital in 2025 than they current hold.

According to CAIA, this is consistent with a Prequin survey that most investors are likely to continue to grow allocations to private equity and private debt over the next five years.


Manager Selection

As the Graph below from the CAIA report highlights there is a wide dispersion of manager performance in a number of strategies, particularly private equity, venture capital, infrastructure, and hedge funds.

By contrast, manager performance dispersion within public equities (listed markets) and global fixed income managers is relatively tight.

Therefore, avoiding underperforming managers is a key success factor when investing in alternatives.

Manager Performance Dispersion CAIA


Future Trends

Hedge Funds and Liquid Alternatives

Portfolio diversification was the key rationale for including hedge funds, managed futures, and liquid alternatives in a portfolio amongst more than half the CAIA members surveyed.

Lessening the impact of severe equity markets declines on portfolios was a motivating factor “over 92% believe that hedge funds will outperform global equity during times of weakening stock prices.”

As the report emphasises, “This script played out dramatically in the first quarter of 2020 and is reinforced through history: volatility of returns on hedge fund indices is approximately half that of global stock market indices.”

Assets managed by hedge funds has plateaued over recent years. “Among CAIA Members, two-thirds of those who allocate to hedge funds have an allocation of less than 10%, while more than one-quarter have an allocation exceeding 15%………….. only 37% of CAIA Members who currently allocate to hedge funds expect to have a higher allocation in 2025 than they do today.”

Growth has been experienced across liquid alternatives. Assets allocated to liquid alternatives have grown to $900 billion, up from $200 billion in 2008. Liquid alternatives have grown from 12% of hedge fund assets in 2008 to over 22% today.

With the growth in liquid alternatives, which tend to be more transparent, provide greater levels of liquidity, and cheaper fees compared to hedged funds, it is of little surprise that hedge fund fees have declined as noted in the CAIA report.


A comparison of the performance and characteristics of liquid alternatives compared to hedged funds, undertaken by Vanguard, can be found here.


Private Equity and Venture Capital

As noted above, more than 50% of CAIA Association Members expect to have a greater allocation to private equity and venture capital in 2025.

The change in capital markets, with companies remaining private for longer, and the increased globalisation of capital are underlying trends expected to boost the investment into these types of strategies.

By way of example, the CAIA report highlight that in “2012 over two-thirds of venture capital investments were made in North American companies. By the end of 2016, over 45% of portfolio companies were in Asia, while only one-third of investments were made in North American firms.”

The growing trend of Emerging Market company’s requirements for capital will see an increased asset allocation to these regions by private equity and venture capital.

Considerations in determining an optimal private equity portfolio allocation are covered in this Kiwi Investor Blog Post.


Real Assets

The survey highlighted that there are several reasons for investing in real assets. By way of example, Real estate and infrastructure are invested in for the following reasons, offering diversification, an inflation hedge, and as a source of income.

The report noted that investments in real assets has increased from $2.7 trillion to $4.3 trillion from 2004 to 20188.

Those CAIA Members who invest in real estate and infrastructure, the majority have an allocation of less than 10% of assets. However, nearly one-third have an allocation above 10% and nearly 90% expect to have an allocation in 2025 that is greater than or equal to what they currently hold.


The benefits of real assets are noticeable in different economic environments, like stagflation and stagnation, and particularly for those investments where objectives are linked to inflation. In a previous Post I provide an outline of the characteristics of different real assets and the benefits they bring to a Portfolio.


The CAIA Report has a very good case study on climate change and real assets, highlighting the impact of increased Environment, Social, and Governance (ESG) integration within investor portfolio will in their view be transformative for the real asset classes e.g. Real Estate and Infrastructure carbon-neutrality and stranded assets within the Natural Resources sector.


There is also an interesting section on Private Debt, which has experienced a dramatic increase in assets, reflecting historically low interest rates and regulatory changes that have caused banks to reduce lending to risker parts of the economy. Allocations to private debt are expected to grow.


The CAIA also unveil a four-point call to action for the industry:

  1. Commit to Education
  2. Embrace Transparency
  3. Advocate Diversification
  4. Democratise but protect


The CAIA report is well worth reading.


Happy investing.

Please see my Disclosure Statement


Global Investment Ideas from New Zealand. Building more Robust Investment Portfolios.

Sharemarket crashes – what works best in minimising losses, market timing or diversification?

The best way to manage periods of severe sharemarket declines, as recently experienced, is to have a diversified portfolio, it is impossible to time these episodes.

A 2018 paper by AQR evaluated the effectiveness of diversifying investments during sharemarket drawdowns using nearly 100 years of market data.

They analysed the potential benefits and costs of shifting away from equities, including into investments that are diversifying (i.e. are lowly correlated to equities) and investments that provide a market hedge (i.e. expected to outperform in bad times).

To diversify a portfolio AQR recommends adding return sources that make money on average and have a low correlation to equities i.e. their returns are largely independent of the performance of sharemarkets.

They argue that diversification should be true both in normal times and when most needed: during tough periods for equities.

Furthermore, as AQR emphasis, “diversification is not the same thing as a hedge.” Although “hedges”, e.g. Gold, may make money at times of sharemarket crashes, there is a cost, investments with better hedging characteristics tend to do worse on average over the longer term.

Therefore, alternative investments are more compelling relative to the traditional asset classes in diversifying a portfolio, they provide the benefits of diversification and on average over time their returns tend to keep up with sharemarket returns.


The analysis highlights that the funding source can matter just as much as the new diversifying investment. Funding from equities reduces drawdown losses, however, longer term returns are on average lower when compared to funding the allocation proportionally from the 60/40 equity/fixed income split.


Portfolio diversification is harder to achieve in practice than in theory. It involves adding new “risks” to a portfolio. Risks that have their own return profile largely independent of other investment strategies within a Portfolio.

Unfortunately, portfolio diversification does not eliminate the risk of experiencing investment losses.


Any new lowly correlated investment should be vigorously assessed and well understood before added to a portfolio.

The success of which largely rests with manager selection.


A summary of the AQR analysis is provided below, first, the following section discusses the challenges and characteristics of achieving portfolio diversification.


The challenges and characteristics of Portfolio Diversification

AQR advocate that diversification is a better solution to mitigating the pain of severe sharemarket falls than trying to time markets.

Specifically, they recommend adding return sources that make money on average and have a low correlation to equities.


Lowly correlated assets can be tremendously valuable additions to a portfolio.

Lowly correlated means returns that are not influenced by the other risks in the portfolio e.g. hedge funds and liquid alternative strategy returns are largely driven by factors other than sharemarket and fixed income returns.

Therefore, although diversifying strategies can lose money in large sharemarket drawdowns, this does not mean they are not portfolio diversifiers. The point being, is that on “average” they do not suffer when equities do.

Unfortunately, portfolio diversification does not eliminate the risk of experiencing investment losses.


In contrast, a hedge is something you would expect to do better than average exactly when other parts of the portfolio are suffering. Although this sounds attractive, hedges come with a cost. This is discussed further below.


Adding diversifying strategies to any portfolio means adding new risks.

The diversifying strategies will have their own risk and return profile and will suffer periods of underperformance – like any investment.

Therefore, as AQR note, implementing and maintaining portfolio diversification is harder in practice than in theory.

Portfolio diversification in effect results in adding new risks to a portfolio to make it less risky.  Somewhat of a paradox.

This can be challenging for some to implement, particularly if they only view the risk of an investment in isolation and not the benefits it brings to the total portfolio.

Furthermore, adding more asset classes does not equal more diversification, as outlined in this Post.


Background

Most portfolios are dominated by sharemarket risk. Even a seemingly diversified balanced portfolio of 60% equities and 40% fixed income is dominated by equity risk, since equities tend to be a much higher-risk asset class. Although equities have had high average returns historically, they are subject to major drawdowns such that the overall “balanced” portfolio will suffer too.   The Balance Portfolio is riskier than many appreciated, as outlined in this Post.


A major sharemarket drawdown is characterised as a cumulative fall in value of 20% or more. Recent examples include the first quarter of 2020, the Global Financial Crisis (2008/09) and Tech Bust (1999/2000). Based on the AQR analysis of almost 100 year of data, drawdowns worse than 20% have happened 11 times since 1926 — a little over once per decade on average. The average peak-to-trough has been -33%, and on average it took 27 months to get back to pre-drawdown levels (assuming investors stayed invested throughout – there is considerable research that indicates they don’t stay the course and earn less than market returns over the investment cycle).


AQR’s analysis highlights that using market valuations as a signal to time market drawdowns has not always been fruitful. Market valuations has rarely been a good signal to tactically change a portfolio to avoid a market drawdowns.

However, it is worth noting AQR are not against the concept of small tactical tilts within portfolios based on value or other signals such as momentum, best expressed as “if market timing is a sin, we have advocated to “sin a little””.

Nevertheless, market timing is not a “panacea” for large sharemarket drawdowns.


Diversification Benefits

The AQR analysis highlights that diversification outside of equities and fixed income can benefit portfolios, for example the inclusion of Style strategies (long/short risk premium across several different asset classes) and Trend following. Both of which are found to be lowly correlated to equities and provide comparable returns over market cycles.

Interestingly, the benefits of diversification vary from where the source of funds is taken to invest into the diversifying strategies.

AQR look at the impact on the portfolio of making an allocation from a 60/40 portfolio to the diversifying strategies. They consider two approaches:

  1. Funding the allocation all equities; and
  2. Funding from a combination of equities and fixed income, at a 60/40 ratio.

They evaluate a 10% allocation from the funding source to the new investments and consider both the impact on returns during equity drawdowns as well as the impact on returns on average over the entire 1926–2017 period.

The analysis highlights that the funding source can matter just as much as the new diversifying investment.

Funding from equities reduces the drawdown losses, however there is a trade-off, longer term returns are on average lower when compared to funding the allocation proportionally to the 60/40 equity / fixed income split.

When allocating to other traditional asset classes as a means of diversification e.g. Cash and Fixed Income, there is also a trade-off between a lower portfolio drawdown and lower average returns over time.


Therefore, alternatives offer a more compelling case relative to the traditional asset classes in diversifying a portfolio, given they provide the benefits of diversification and on average over time their returns tend to keep up with sharemarket returns.


The Cost of Hedging

As noted above Hedging is different to adding diversifying strategies to a portfolio.

Hedges may include assets such as Gold, defensive strategies – which hedge against market falls, and Put Option strategies.

The AQR analysis found that over the past 30 years the defensive strategies provided positive returns on average during sharemarket drawdowns and almost no periods with meaningful negative performance.

This is attractive for investors who are purely focused on lessening the negative impacts of sharemarket drawdowns.

However, there is a trade-off – “the strategies that are more defensively orientated tend to have lower average returns.”

The cost of avoiding the sharemarket drawdown is lower portfolio performance over time.


AQR Conclude

AQR conclude “As with everything in investing, there is no perfect solution to addressing the risk of large equity market drawdowns. However, we find using nearly a century of data that diversification is probably (still) investors’ best bet. This is not to say that diversification is easy.”

“Investors should analyze the return and correlation profiles of their diversifying investments to prepare themselves for the range of outcomes that they should expect during drawdowns and also over the long term.”


Happy investing.

Please see my Disclosure Statement


Global Investment Ideas from New Zealand. Building more Robust Investment Portfolios.


Hedge Funds vs Liquid Alternatives – both bring diversification benefits to a traditional portfolio says Vanguard

Vanguard recently concluded that investors should carefully consider liquid alternatives and hedge funds.

Their research highlighted that they both bring portfolio diversification benefits to a traditional portfolio of equities and fixed income.

They suggest “that liquid alternatives are often viable options for investors who value the regulatory protections, ease of access, and lower costs they provide”, when compared to hedge funds.

Although hedge funds and liquid alternatives deliver valuable portfolio diversification benefits, “it is crucial that investors assess funds on a standalone basis, as the benefits from any alternative investment allocation will be dictated by the specific strategy of the manager(s).”

The most important feature in gaining the benefits of hedge funds and liquid alternatives is manager selection.

This reflects the wide dispersion of returns and investment approaches within the categories of hedge fund and liquid alternatives.


The Vanguard Report undertakes an extensive analysis and comparison of the performance and characteristics of hedge funds and liquid alternatives.

The comparison of hedge funds and liquid alternative is particularly useful to those new to the subject.

For the more technically advanced, there is an in-depth performance analysis comparing the drivers of performance between hedge funds and liquid alternative strategies. Vanguard ran a seven-factor model and a customised regression model to identify the drivers of returns.


Benefits of Hedge Funds and Liquid Alternatives

Vanguard’s analysis highlights that hedge funds and liquid alternatives provide diversification benefits to a traditional portfolio of equities and fixed income. As noted above, capturing these benefits is heavily reliant on manager selection.

It is important to note that the diversification benefits of the different hedge funds and liquid alternatives strategy types vary over time, they have time varying sensitivity to equity markets and fixed income.

It is also worth highlighting that hedge fund and liquid alternative strategies do not provide a “hedge” to equity markets and fixed income markets.

Therefore they do not always provide a positive return when equity markets fall. Albeit, they do not decline as much at times of market crisis, as we have recently witnesses. Technically speaking their drawdowns (losses) are smaller relative to equity markets.

As evidenced in the Graph below provided by Mercer.

Mercer drawdown graph


Blending Alternative investment strategies can smooth the ride

Vanguard note that an additional layer of portfolio diversification can be attained by combining different hedge funds and alternative strategies.

Vanguard’s analysis suggested global macro (including managed futures) and the market neutral strategies are the best diversifiers when combined with other hedge fund and liquid alternative strategies.

Their research highlighted that combining multi-strategy hedge fund and liquid alternatives with a few other strategy types provided additional portfolio diversification benefits.

Again they highlight the importance of undertaking fund-by-fund basis analysis to better capture these diversification benefits – i.e. manager selection is important


Framework for Manager Selection

Vanguard suggest a framework for manager selection

  1. Identify your investment objective for including hedge funds and liquid alternatives. Investors have an array of objectives, which may include return enhancement, portfolio diversification and risk reduction, and inflation protection.
  2. Before selecting a manager determine a suitable strategy type(s). This is undertaken in consideration of investment objective(s) and any constraints. This could take into consideration risk and fee budgets, tolerance for level of leverage, and operational implementation issues. Ideally you would want to identify a number of strategy types so as to gain the diversification benefits from having a blended investment solution.
  3. Undertake manager selection within the strategy types. Undertake research as to the benefits of a particular manager and their ability to consistently deliver return outcomes consistent with the overarching investment objectives within the strategy type.
  4. Maintain a policy of regular review and monitoring of the manager and strategies in meeting desired investment objectives.


Liquid Alternatives are often the Prudent Option

The report highlights that investors will place varying degrees of value on the relative benefits of hedge funds and liquid alternatives.

Vanguard note that liquid alternatives may provide valuable portfolio construction benefits for investors who are not interested in undertaking the additional due diligence required for, or paying the costs associated with, investing in hedge funds.

They conclude that liquid alternatives maybe a viable option. Compared to hedge funds liquid alternative often have:

  • Lower fee structure that are easier to understand;
  • Greater transparency of underlying holdings; and
  • Greater liquidity i.e. easier access to getting your money back.


Performance Comparison

The Vanguard analysis reveals that hedge funds have performed better than liquid alternatives. They have also performed better on a risk adjusted basis.

However, the dispersion of returns between hedge fund managers is greater.

Vanguard undertook extensive performance analysis of hedge funds and liquid alternative returns, using factor analysis. Vanguard ran a seven-factor model and a customised regression model.

This analysis highlighted that liquid alternatives have more consistent factor exposures than hedge funds. Their returns are driven more by market factors such as value, momentum, low volatility, credit, quality, and liquidity.

Different factors drove the returns of different liquid alternative strategies – thus the diversification benefits of combining different strategy types.

Conversely, hedge funds are driven more by manager skill, returns are less sensitive to market factor returns.


To Conclude

Liquid alternatives provide an exposure to more “generic” hedge fund strategies – “hedge fund beta” exposures that have been found to be relatively stable over time. The market sensitivities vary across the different strategy types.

Investing in hedge funds, provides access to more unique return sources (alpha). Albeit this is harder to identify. Therefore, manager selection is even more important, given the larger dispersion of returns amongst hedge fund strategies and managers.

However, both the hedge fund alpha and the liquid alternative beta can provide diversification benefits to a traditional portfolio. Therefore, both can play a role in a portfolio.

Individual preferences and constraints will largely drive allocations to each.

Appropriate due diligence and focus on returns after fees will increase the likelihood of capturing the portfolio diversification benefits.

Manager selection is key.


Stay safe and healthy.


Happy investing.

Please see my Disclosure Statement


Global Investment Ideas from New Zealand. Building more Robust Investment Portfolios.


We will get through this – coronavirus

One of the better discussions available on the coronavirus is the CFA Institute interview between Laurence B. Siegel and Andrew “Drew” Senyei, MD.

The most important point to take away is the concluding remark “the advances in medical knowledge and molecular biology, especially in the last decade, and with the full focus of the world on this one challenge — we will get through this.”

The discussion is wide ranging and will help in providing clarity on several issues e.g. the importance of testing, how the virus impacts on the body, and the trade-off between preventing or slowing the spread of the disease at all costs versus the cost on the economy and people’s mental health, including what testing is required to get people back to work.


The interview begins by acknowledging that although our knowledge of the virus is increasing there is still lots to learn about it. It is evident that this coronavirus is different from previous coronaviruses.

One important unknown is how lethal it is. This relates to the case fatality rate (CFR). This is the number of people who die of the disease, expressed as a percentage of the number of people who have it.

As you may be aware, there are a number of problems in measuring this currently:

  • More testing is needed to know how many people who have had it, especially asymptomatic patients – tested positive for the virus but showed no symptoms.
  • The reporting of deaths has also been problematic, did they die because of the virus or was there an underlying ailment e.g. cancer or heart disease. The difference between died with and died from.

The best estimate currently is that the CFR of the coronavirus is higher than the flu, but it is unlikely to be as high as SARS.

Also, the CFR for the coronavirus is likely to fall as further testing is undertaken, this was the experience with SARS.

The experience on the cruise ship, The Diamond Princess, provides an insight into the likely CFR, and interestingly, over half those tested were asymptomatic. This is discussed in more detail in the article.

The issue of incomplete statistics is highlighted in comparing the outcomes between Italy and South Korea. This comes down to the level of testing and the variations in the way different countries are testing.

Social distancing is having a positive impact. Particularly from protecting the health care system. Ideally, we want “the density of new cases presenting in any geographic area at any given time to be as low as possible and over as long a time period as possible to prevent a surge on the health care system.”

There is a great discussion around the issues with testing. There are a lot of variables.  At the risk of sounding repetitive we need lots of testing, “We need to know how much of the disease is out there so we can have the health care resources and physicians to respond to that surge, where and if it occurs.”


Economic Trade-off

The latter half of the article covers the issue of the trade-off between preventing or slowing the spread of the disease at all costs versus the cost on the economy and people’s mental health.

The argument being, should we ease up relatively quickly on policies that discourage work and income and social interaction, otherwise we will severely injure the economic life.

Is there an optimum or balance between the two extremes?


Initially, given the unknows, erring on the side of caution would appear appropriate.

Nevertheless, there is an argument for considering “a rational middle ground and that is: We have to first understand if this is peaking. And remember when you look at new case rates, you’re actually lagging by two weeks.”

Understanding more about the virus will help in getting the economy back up and running.  More testing is needed.

“I would look at those [new case rates], and then at hospitalizations and intensive care utilization, and see if that’s peaking because that is the most pressing problem. Then I would look at the rates by population density and see where the wave is happening more locally and usher resources there.”

The discussion comes back to more but different testing, to get a better sense of who’s had the infection, who’s over it, and who’s protected at least for a while.

This is an interesting discussion and highlights a likely path to getting people back to work. .

The key is to identify those individuals already immune and not likely to get infected or infect others back to work.

Protecting the elderly is important, therefore it is suggested “to look at the density of the elderly and make sure resources are adequate for that particular region — not just equipment and supplies, but personnel.”

Senyei concludes “I would invest really heavily in the basic biology and in vaccine development which is two years out. I think you’re going to need a vaccine and you’ll probably need a new vaccine like you do for the flu every year. This virus will mutate.”

“Now all that takes money, time, and coordination — but people are working on it and I think, if we did that, we could sort of get back to the economy being an economy.”

As highlighted above, they conclude by acknowledging that we will get through this.


Stay safe and healthy.


Happy investing.

Please see my Disclosure Statement


Global Investment Ideas from New Zealand. Building more Robust Investment Portfolios.


Balanced Fund Bear Market and the benefits of Rebalancing

Balanced Funds are on track to experience one of their largest monthly losses on record.

Although this largely reflects the sharp and historical declines in global sharemarkets, fixed income has also not provided the level of portfolio diversification witnessed in previous Bear markets.

In the US, the Balanced Portfolio (60% Shares and 40% Fixed Income) is experiencing declines similar to those during the Global Financial Crisis (GFC) and 1987.

In other parts of the world the declines in the Balance Portfolio are their worst since the   1960s.

As you will be well aware the level of volatility in equity markets has been at historical highs.

After reaching a historical high on 19th February the US sharemarket, as measured by the S&P 500 Index, recorded:

  • Its fastest correction from a peak, a fall of 10% but less than 19%, taking just 6 days; and
  • Its quickest period to fall into a Bear market, a fall of greater than 20%, 22 days.

The S&P 500 entered Bear market territory on March 12th, when the market fell 9.5%, the largest daily drop since Black Monday in October 1987.

The 22 day plunge from 19th February’s historical high into a Bear market was half the time of the previous record set in 1929.

Volatility has also been historical to the upside, including near record highest daily positive returns and the most recent week was the best on record since the 1930s.


Volatility is likely to remain elevated for some time. The following is likely needed to be seen before there is a stabilisation of markets:

  • The Policy response from Governments and Central Banks is sufficient to prevent a deepening of the global recessions;
  • Coronavirus infection rates have peaked; and
  • Cheap valuations.

Although currently there are cheap valuations, this is not sufficient to stabilise markets. Nevertheless, for those with a longer term perspective selective and measured investments may well offer attractive opportunities.

Please seek professional investment advice before making any investment decision.

For those interested, my previous Post outlined one reason why it might be the right thing for someone to reduce their sharemarket exposure and three reasons why they might not.


The Impact of Market Movements and Benefits of Rebalancing

My previous Post emphasised maintaining a disciplined investment approach.

Key among these is the consideration of continuing to rebalance an investment Portfolio.

Regular rebalancing of an investment portfolio adds value, this has been well documented by the research.  The importance and benefits of Rebalancing was covered in a previous Kiwi Investor Blog Post which may be of interest: The balancing act of the least liked investment activity.

Rebalancing is a key investment discipline of a professional investment manager. A benefit of having your money professionally managed.

Assuming sharemarkets have fallen 25%, and no return from Fixed Income, within a Balanced Portfolio (60% Shares and 40% Fixed Income) the Sharemarket allocation has fallen to 53% of the portfolio.

Therefore, portfolios are less risky currently relative to longer-term investment objectives. A disciplined investment approach would suggest a strategy to address this issue needs to be developed.


As an aside, within a New Zealand Balanced Portfolio, if no rebalancing had been undertaken the sharemarket component would have grown from 60% to 67% over the last three years, reflecting the New Zealand Sharemarket has outperformed New Zealand Fixed Income by 10.75% per year over the last three years.

This meant, without rebalancing, Portfolios were running higher risk relative to long-term investment objectives entering the current Bear Market.

Although regular rebalancing would have trimmed portfolio returns on the way up, it would also have reduced Portfolio risk when entering the Bear Market.

As mentioned, the research is compelling on the benefits of rebalancing, it requires investment discipline. In part this reflects the drag on performance from volatility. In simple terms, if markets fall by 25%, they need to return 33% to regain the value lost.


Investing in a Challenging Investment Environment

No doubt, you will discuss any current concerns you have with your Trusted Advisor.

In a previous Post I reflected on the tried and true while investing in a Challenging investment environment.

I have summarised below:


Seek “True” portfolio Diversification

The following is technical in nature and I will explain below.

A recent AllAboutAlpha article referenced a Presentation by Deutsche Bank that makes “a very compelling case for building a more diversified portfolio across uncorrelated risk premia rather than asset class silos”.

For the professional Investor this Presentation is well worth reading: Rethinking Portfolio Construction and Risk Management.

The Presentation emphasises “The only insurance against regime shifts, black swans, the peso problem and drawdowns is to seek out multiple sources of risk premia across a host of asset classes and geographies, designed to harvest different features (value, momentum, illiquidity etc.) of the return generating process, via a large number of small, uncorrelated exposures


We are currently experiencing a Black Swan, an unexpected event which has a major effect.

In a nutshell, the above comments are about seeking “true” portfolio diversification.

Portfolio diversification does not come from investing in more and more asset classes. This has diminishing diversification benefits over the longer term and particularly at time of market crisis.

True portfolio diversification is achieved by investing in different risk factors (also referred to as premia) that drive the asset classes e.g. duration (movements in interest rates), economic growth, low volatility, value, and market momentums by way of example.

Investors are compensated for being exposed to a range of different risks. For example, those risks may include market risk (e.g. equities and fixed income), smart beta (e.g. value and momentum factors), alternative, and hedge fund risk premia. And of course, “true alpha” from active management, returns that cannot be explained by the risk exposures just outlined.

There has been a disaggregation of investment returns.

US Endowment Funds and Sovereign Wealth Funds have led the charge on true portfolio diversification, along with the heavy investment into alternative investments and factor exposures.

They are a model of world best investment management practice.


Therefore, seek true portfolio diversification this is the best way to protect portfolio outcomes and reduce the reliance on sharemarkets and interest rates to drive portfolio outcomes.  As the Deutsche Bank Presentation says, a truly diversified portfolio provides better protection against large market falls and unexpected events e.g. Black Swans.

True diversification leads to a more robust portfolio.


Customised investment solution

Often the next bit of  advice is to make sure your investments are consistent with your risk preference.

Although this is important, it is also fundamentally important that the investment portfolio is customised to your investment objectives and takes into consideration a wider range of issues than risk preference and expected returns and volatility from investment markets.

For example, level of income earned up to retirement, assets outside super, legacies, desired standard of living in retirement, and Sequencing Risk (the period of most vulnerability is either side of the retirement age e.g. 65 here in New Zealand).

Also look to financial planning options to see through difficult market conditions.


Think long-term

I think this is a given, and it needs to be balanced with your investment objectives as outlined above.

Try to see through market noise and volatility.

It is all right to do nothing, don’t be compelled to trade, a less traded portfolio is likely more representative of someone taking a longer term view.

Remain disciplined.


There are a lot of Investment Behavioural issues to consider at this time to stop people making bad decisions, the idea of the Regret Portfolio approach may resonate, and the Behavioural Tool Kit could be of interest.


AllAboutAlpha has a great tagline: “Seek diversification, education, and know your risk tolerance. Investing is for the long term.”

Kiwi Investor Blog is all about education, it does not provide investment advice nor promote any investment, and receives no financial benefits. Please follow the links provided for a greater appreciation of the topic in discussion.


And, please, build robust investment portfolios. As Warren Buffet has said: “Predicting rain doesn’t count. Building arks does.” ………………….. Is your portfolio an all-weather portfolio?


Stay safe and healthy.


Happy investing.

Please see my Disclosure Statement


Global Investment Ideas from New Zealand. Building more Robust Investment Portfolios.