I would like to share this blog post by AMP Capital New Zealand, Four pillars for generating income | AMP Capital, which looks at the four main pillars of an investment framework to deliver a stable and sustainable level of income over time.
The Post challenges some of the conventional wisdoms underpinning the management of traditional portfolios.
The basis of the framework is a goal orientated investment approach.
For those wishing to understand more around Goal Based Investing, this Wikipedia page, which I have contributed to, Goal-based investing may be of interest. The Wikipedia page includes:
A description of Goal Based Investing (GBI)
A comparison of GBI to traditional portfolio theory
We need to change the conversation on investment management fees. The debate on fees needs to be based on facts rather than myths. Despite often being framed in this way, the debate on investment management fees is not black versus white.
What matters is not the fee level, but the manager’s ability to deliver a satisfactory outcome to investors after fees. Either way, it is no good paying high fees or the lowest possible fees if your investment objectives have not been achieved. Therefore, amongst the key questions to ask are, are you satisfied with the investment outcomes after the fees you have paid? – have your investment objectives or retirement goals been achieved?
After fee returns are important. Therefore, higher fee investment strategies should not necessarily be avoided if they can assist in meeting your investment objectives. In the current investment environment, the use of higher fee investment strategies may be necessary to achieve your investment objectives.
Therefore, Investors should focus on given the investment outcomes have I minimised the fees paid.
In my mind, this would be consistent with the FMA’s value for money focus. (FMA is New Zealand’s Regulatory)
At the same time, fees should not be the overriding concern and investors must analyse fees in the overall context of managing their portfolios appropriately.
Investment management fee Myths
The 5 most common myths about investment management fees are:
Fees should be as low as possible
Incentive fees are always better than fixed fees
High water marks always help investors
Hedge Funds are where the alpha is. They deserve their high fees
You can always separate alpha from beta, and pay appropriate fees for each
Although all the myths are important, the myth that fees should be as low as possible probably resonates most with investors.
Investment management fees for active management are higher than index management and involve a wealth transfer from the investor to the investment manager. This is a fact.
However, the paper is clear, investors should look to maximise excess returns (they term alpha) after fees. Another way of looking at this, for a given level of excess returns, fees should be minimised. This is an important concept when considering the discussion below around broadening the discussion on fees.
The paper also notes, investors should pay higher fees to those managers that are more consistent. For example, if two managers provide the same level of excess return, but one does so by taking less risk, investors should pay higher fees to this manager (the manager who achieves the same excess return but with lower risk – technically speaking, this is the manager with the higher information ratio).
In summary, the take-outs on the myth fees should be as low as possible:
Fees must remain below expected excess returns e.g., a manager that charges active fees but only delivers enhanced index returns should be avoided.
Managers who consistently add value warrant higher fees.
The paper on the five fee myths is wide ranging. It also provides insights into the key elements of the fee negotiation game and determining the conditions under which higher fees should be paid.
Key conclusions from the article, particularly after addressing Myth 4 & 5:
most investment strategies offer a combination of cheaply accessible market index returns (beta) and active management excess returns (alpha). While many institutional investors look to separate beta and alpha for most investors this is too limiting and difficult. Many talented investment managers appear in investment strategies which include both beta and excess returns (alpha).
Investors should consider fees before deciding on an investment strategy, not look at an investment strategy and then consider fees.
At the same time, fees should not be the overriding concern.
High fee investment strategies are worthwhile if they deliver sufficient return and lower risk.
Investors must analyse fees in the overall context of managing their portfolios appropriately.
A framework for Changing the discussion on fees
Despite it often framed this way, the debate on fees is not black versus white.
From this respective, understanding the disaggregation of investment returns can help in broaden the debate on fees and also help determine the appropriateness of fees being paid.
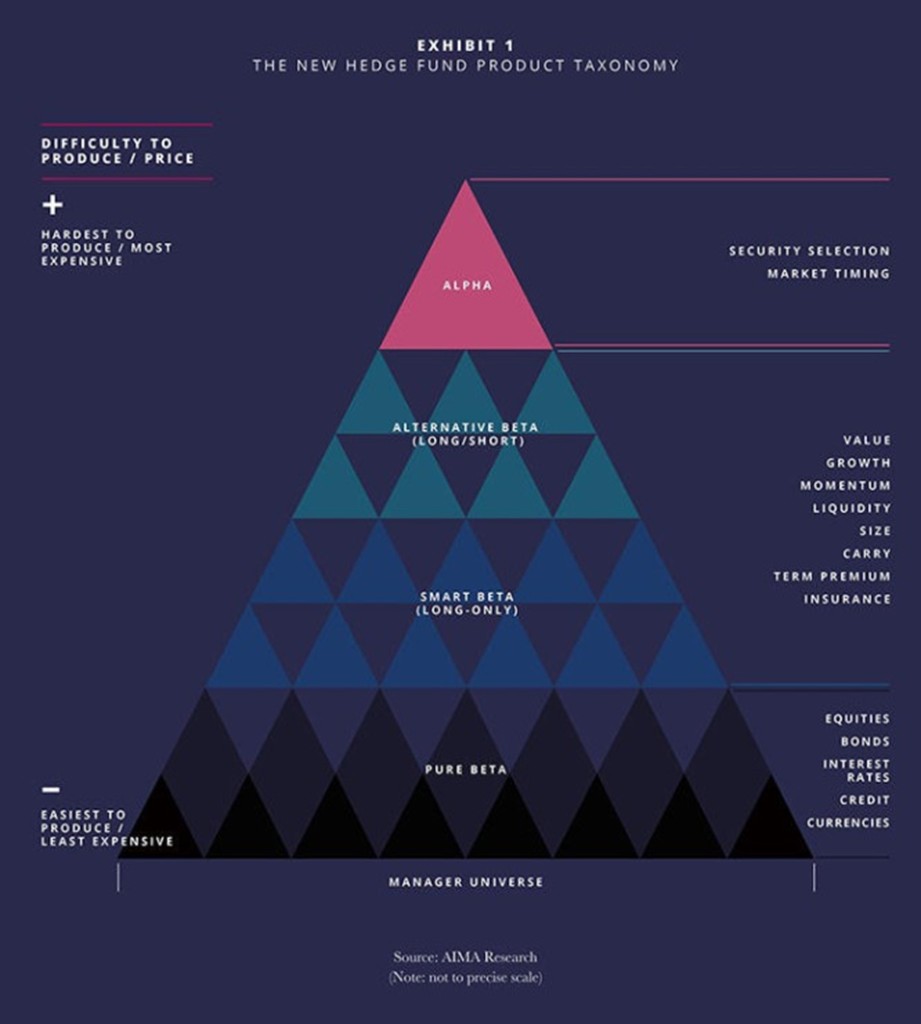
From a broad view, investment returns can be disaggregated in to the following three parts:
Market beta. Think equity market exposures to the NZX50 or S&P 500 indices (New Zealand and America equity market exposures respectively). Market Index funds provide market beta returns i.e. they track the returns of the market e.g. S&P 500 and NZX50. Beta is cheap, as low as 0.01% for large institutional investors.
Factor betas and Alternative hedge fund beta exposures. Of the sources of investment returns these are a little more ambiguous and contentious than the others. This mainly arises from use of terminology and the number of investable factors that are rewarding. My take is as follows, Factor betas and Alternative hedge fund beta fit between market betas (above) and alpha (explained below).
Factor Beta exposures. These are the factor exposures for which I think there are a limited number. The common factors include value, momentum, low volatility, size, quality/profitability, carry. They are often referred to as Smart beta.
Alternative hedge fund betas. Many hedge fund returns are sourced from well understood investment strategies. Therefore, a large proportion of hedge fund returns can be explained by common hedge fund risk exposures, also known as hedge fund beta or alternative risk premia or risk premia. Systematic, or rule based, investment strategies can be developed to capture a large portion of hedge fund returns that can be attributed to a hedge fund strategy (risk premia) e.g. long/short equity, managed futures, global macro, and arbitrage hedge fund strategies. The alternative hedge fund betas do not capture the full hedge fund returns as a portion can be attributed to manager skill, which is not beta and more easily accessible, it is alpha.
Alpha is what is left after all the betas. It is manager skill. Alpha is a risk adjusted measure. In this regard, a manager outperforming an index is not necessarily generating alpha. The manager may have taken more risk than the index to generate the excess returns and/or they may have an exposure to one of the factor betas or hedge fund betas which could have been captured more cheaply to generate the excess return. In short, what is often claimed as alpha is often explained by a factor or alternative hedge fund beta outlined above. Albeit, there are some managers than can deliver true alpha. Nevertheless, it is rare.
These broad sources of return are captured in the diagram below, provided in a hedge fund industry study produced by the AIMA (Alternative Investment Management Association).
The disaggregation of return framework is useful for a couple of important investment considerations. We can use this framework to determine:
Appropriateness of the fees paid. Obviously for market beta low fees are paid e.g. index fund fees. Fees increase for the factor betas and then again for the alternative hedge fund betas. Lastly, higher fees are paid to obtain alpha, which is the hardest to produce.
If a manager is adding value – this was touched on above. Can a manager’s outperformance, “alpha”, be explained by “beta” exposures, or is it truly unique and can be put down to manager skill.
The consideration of this framework is consistent with the observations from the article above covering the 5 myths of Investment Management Fees.
Lastly, personally I think a well-diversified portfolio would include an exposure to all of the return sources outlined above, at the very least.
Many institutional investors understand that true portfolio diversification does not come from investing in many different asset classes but comes from investing in different risk factors. See More Asset Classes Does not Equal More Diversification.
From this perspective, the objective is to implement a portfolio with exposures to a broad set of different return and risk outcomes.
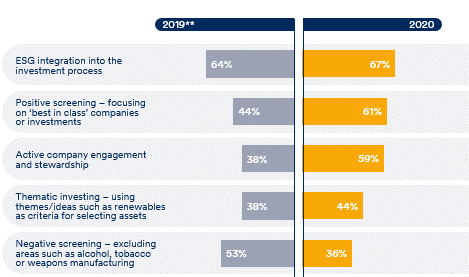
Active engagement and stewardship have leapt in importance as a way for asset managers to drive sustainable change. This is a key conclusion of a study undertaken by Schroders in 2020.
Schroders conclude “The results suggest that engagement and voting are now increasingly being viewed as an important aspect of achieving change, rather than simply divesting.”
Their study found that nearly 60% of “institutions said active company engagement and stewardship was a key approach to integrating sustainability.” This is a significant rise on 38% a year ago.
The survey also highlighted:
ESG Integration into the investment process and positive screening (focusing on the best in class companies) are the top two important drivers for asset managers to drive sustainable change;
Positive screening has also grown sharply in importance, from 44% of survey respondence to 61%; and
Conversely Negative Screening has fallen in importance (53% to 36%).
Source: Schroders
Investors noted signs of successful engagement included:
Transparent reporting;
Tangible outcomes; and
Consistently voting against companies in order to drive change.
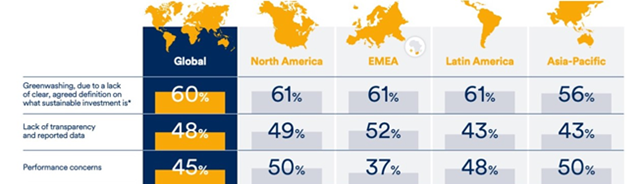
Greenwashing, poor data, and increased Regulation
Greenwashing, as described by Schroders “‘a lack of clear, agreed sustainable investment definitions’” was seen as the most significant obstacle to investor’s sustainable investment intentions. 60% of those surveyed found green-washing as one of the most significant obstacles impeding their sustainable investing intentions.
The lack of transparency and reported data was also raised as an issue restricting the ability to invest sustainably.
Both measures increased in importance on last year, while performance concerns continued to decline. 45% of investors cited performance as concern in relation to investing sustainably.
Source: Schroders
These results were recently picked up in an Alternative Investment Management Association (AIMA) article, which focused on the increased integration of ESG into Hedge Fund’s investment processes. Hedge funds start integrating ESG (aima.org).
In relation to green-washing, AIMA notes that regulators are also concerned about green-washing, noting the introduction of the Sustainable Finance Disclosure Regulation (SFDR) rule in the European Union. The SFDR came into effect on March 10 of this year, aimed at ensuring financial firms such as fund managers, insurers, and banks providing financial products and services comprehensively disclose just how committed to sustainability they truly are.
The AIMA notes “The EU rules will also create a taxonomy as regulators look to facilitate greater consistency in terms of what can be classified as being a sustainable economic activity.”
The AIMA also noted more global investors are now prioritising ESG, and it is something which hedge funds need to respond to. Although they felt the US was behind the rest of the world, particularly Europe (I would add Australian and New Zealand as well), this was changing.
By way of example, the AIMA article highlighted “that several high profile US institutions – including the likes of CALPERS and Wespath – have signed up to the UN-backed Net Zero Asset Owner Alliance, a consortium comprised of 30 of the world’s largest investors – all of whom have committed to reduce carbon emissions linked to the companies they invest in by 29% within the next four years.”
Failure to transition towards net zero is widely seen as a important risk management issue for companies. Arguably, companies failing to adapt or transition towards net zero will see their businesses and valuations suffer.
Lastly, AIMA highlighted the concerns over the quality of ESG data being disclosed by managers to their investors.
“One of the primary problems is that there are no harmonised ESG data standards. Instead, there are many different ESG standards and protocols, all of which have their own characteristics. With different managers subscribing to different ESG standards, the reports they produce for clients are often inconsistent and even contradictory. Similarly, ratings agencies will often have their own bespoke methods of collecting data from companies they are scoring. ……… Without a common data collection methodology, the ratings agencies’ scoring processes will be fragmented.”
Key Engagement Issues
The survey by Schroders found environmental issues remained the most important engagement issue for investors.
In total, 68% of investors globally said they expected investing sustainably to grow in importance over the next five years.
“Driving this focus were institutions looking to align their investments with their own corporate values, responding to regulatory and industry pressure, and, positively, the belief that investing sustainably can drive higher returns and lower risk.”
The Schroder study included 650 institutional investors encompassing $25.9 trillion in assets.
The greatest risk to the global economy is that economic activity surprises on the upside in 2021.
Currently consensus forecasts are for the global economy to grow 5.8% in 2021, lead higher by the US 5.7%, China 8.5%, and India 9.4%.
Global economic consensus forecasts are likely to move higher as the year progresses, reflecting:
economic activity surprises on the upside post COVID-19 vaccination reopening,
which will be supported by very low interest rates and the expected continuation of accommodative policy by central banks for some time to come, and
the very large government spending packages being rolled out. For example, the recently proposed $2.2 trillion spending package on infrastructure and other benefits over the next 10 years by President Biden in the USA, this is addition to $1.9tn spending stimulus he announced earlier in the year (American Rescue Plan).
The size of the US government spending program is huge, $5 trillion in measures have been announced since March 2020, over 80% of this will be “spent” by the end of 2021. This does raise economic risks for the future and $2 trillion in tax increases is being planned.
Concerns over inflation overdone……………for the time being.
Global interest rates have moved higher over the first three months of 2021 due to optimism over the rollout of the COVID-19 vaccine, better than expected economic data, the highest level of US government spending outside of war times, and the US Federal Reserves’ commitment to maintaining easy policy settings until higher inflation is sustainable.
Arguably interest rates have risen on a growth scare, rather than an inflation scare.
For the time being inflation is not a major issue and is probably not likely to be so for some time given “under-employment” (spare capacity) within the US, and global, economy.
Inflation in the US is expected to spike in the months ahead, this will reflect base effects from the shock to measures of inflation 12 months ago.
Albeit the risks to inflation are rising and higher inflation is likely to be an issue by the middle of the current decade, resulting in central banks raising interest rates.
From a portfolio construction perspective, investors with a longer-term view should reduce portfolio duration and start considering the allocation to inflation linked bonds and real assets (such as property and infrastructure).
Either way, the outlook for fixed income is not encouraging in either the short or longer term, and particularly relative to returns experienced over the last 10-20 years.
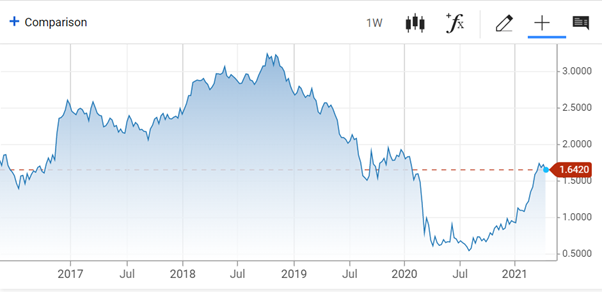
In the US, the 10-year government bond yield recently reached its highest level since January 2020, trading at 1.77%, this compares to 0.62% a year ago and a low of 0.55% in August of 2020.
In New Zealand, the 10-year Government Bond yield finished March 2021 at 1.76%, the highest month end level since May 2019, and over 1% higher than the May 2020 low of 0.6%.
US 10-Year Government Bond Yield
Source: CNBC
Vaccine and Economic Data
By the end of the first Quarter of 2021 61% of the population had received their first vaccine shot in Israel, this compares to 46% in the UK, 30% in the US and 12.6% across Europe.
The daily pace of new doses administered is approximately 1.5m in the European Union, 2.8m in the US, and 0.5m in the UK.
Economic data has surprised on the upside, particularly in the US where the reopening of the economy is accelerating economic activity:
The number employed in the US grew by 916k in March, well above consensus forecasts. The unemployment rate dropped to 6.0%, from 6.2%, with an increase in the participation rate restricting a larger decline in the unemployment rate.
US Consumer confidence also increased by a much larger amount in March than anticipated.
Expectations for US manufacturing activity increased by more than expected and reached the highest level since 1983.
A measure for US services sector activity also exceeded expectations.
Likewise, measures of economic activity in the Euro Zone and China have recorded stronger than expected numbers.
European measures of expected manufacturing activity are at all-time highs.
China’s industrial profits have grown by 179% from last year, reflecting the low base of 2020 but also the very strong increase in revenues and profits over the last 12 months.
While China is further advanced in its economic recovery, Europe lags both China and the US, nevertheless, the ongoing vaccine roll out and an increase in government spending should see the Euro Zone’s economy strengthen over the second half of 2021.
The US Federal Reserve (Fed), unsurprisingly, has upgraded their economic forecasts significantly reflecting the above factors, specifically larger than expected government spending and the improving public health situation.
The Fed also see inflation temporarily rising above 2% in the near term and then to settle to around 2% until 2023, they see the risks to inflation as balanced.
Market Performance
The above environment has been good for global equity markets, but not so good for global fixed income markets.
Base effects are also impacting Global Equity Market returns, as highlighted in the Table below.
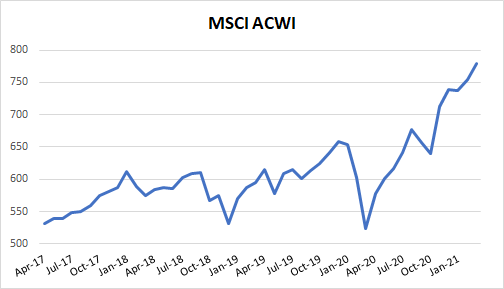
As can be seen, global equities have returned nearly 50% over the last year, in part reflecting markets reached their lows in March 2020 amidst the global COVID-19 pandemic.
MSCI ACWI
MSCI EM
12 Months
48.7%
53.0%
6 Months
18.6%
20.6%
3 Months
5.5%
4.0%
1 Month
3.3%
-0.9%
Source MSCI
The strength of the rebound since last year is very evident in the following graph.
Source: MSCI
Emerging markets have outperformed developed markets over the last year despite underperforming over the first quarter of 2021.
Over the first three months of 2021, European markets climbed 8.7%, the US 5.8%, Australia +4.3% and New Zealand fell 4.0%.
In the fixed income markets, the NZ Government Bond Index fell 3.2% for the March Quarter, Aussie fixed income declined 3.5%. Smaller declines were experience in global fixed income.
As a general trend, value continued to outperform momentum and the financial and energy sectors did well. The Real Estate and Utilities sectors tended to lag the broader market.
The US dollar has been stronger relative to most currencies recently, reflecting firmer US economic growth and rising bond yields.
Commodity prices have also been strong, the Dow Jones Commodity Index return 8.4% over the first three months of 2021.
A review of KiwiSaver Balanced Funds, which are soon to become the Default Option, highlights:
A heavy reliance on equities to drive return outcomes – there are few return engines outside of equities.
Limited portfolio diversification – likely resulting in higher levels of portfolio volatility across a full market cycle (which could be dampened down for the benefit of investors).
A high allocation to Fixed Income – which is a concern in the current market environment.
By comparison, Australian Super Funds with similar return objectives to a KiwiSaver Balance Fund have lower allocations to equities despite having higher “growth” asset allocations. They achieve this by having higher weightings to alternative investment strategies such as Private Equity, Direct Property, Unlisted Infrastructure, Commodities, and Diversified Multi-asset Funds.
Consequently, the Australian Super Funds have lower weights to fixed income relative to their Kiwi peers. There are some nuances amongst asset class allocations of the KiwiSaver Balance Funds, these are similar to those identified from the KiwiSaver Conservative Fund analysis.
I think it is fair to say that New Zealand KiwiSaver Funds need greater levels of diversification.
Often liquidity is sighted as a reason for not investing into alternative investment strategies, to this point:
Portfolios often overestimate the level of liquidity they require (see here); and
There are ways of increasing portfolio diversification with more liquid investment options.
Fees may also be playing a part. Let us hope not, particularly in considering the best outcomes for customers.
The high allocation to fixed income is also a concern, particularly at this juncture in the economic and market cycles.
The traditional roles of Fixed Income are likely to be challenged in the years ahead:
Returns are highly likely to be lower than those delivered from fixed income over the last 10-20 years; and
The risk mitigation characteristics of fixed income are also likely to be lower in the years ahead.
Purely from a risk management perspective, Kiwi investors should be looking to increase the genuine level of diversification within their portfolios – by lessening the role of equities and exploring investment options to substitute/complement fixed income allocations.
Personally, I am not convinced of moving the KiwiSaver Default Fund to a Balanced Fund option is the right solution. My views can be found here. It is clearly ridiculous to have a 20- and 55-year-old Default KiwiSaver investor in the same investment strategy.
My preference would be for Target Date / Life Cycle / Life Stage type funds as the Default Options – these align more with the financial planning theory. The criticism of these type of Funds is often incorrectly positioned, I provide a defense of Target Date Funds here.
Analysis of KiwiSaver Balanced Funds
The Table below provides average, min, and max allocations of the Strategic Asset Allocations (SSA) for 12 KiwiSaver providers, sourced from their latest Statements of Investment Policy and Objectives (SIPO).
Most of these managers are currently Default KiwiSaver Providers.
Income Allocations
Cash
NZ Fixed Income
International Bonds
Income Allocations
Averages
5.2%
12.8%
23.7%
41.6%
Min
1.0%
6.0%
18.0%
39.0%
Max
10.0%
16.5%
28.0%
50.0%
Median
4.5%
14.0%
25.3%
40.0%
Growth Allocations
NZ Equities
International Equities
Other Equities
Alternatives
Growth Allocations
Averages
19.1%
32.8%
5.0%
3.2%
58.4%
Min
11.5%
26.0%
0.0%
0.0%
50.0%
Max
29.0%
40.0%
8.0%
6.0%
61.0%
Median
20.0%
32.0%
5.5%
4.0%
60.0%
Income Assets
From a top level, the managers are tightly grouped around 40% allocation to Income assets (Cash, NZ Fixed Income and International Bonds).
A KiwiSaver Balanced Fund is very much the traditional 60/40 portfolio (60% Equities / 40% Fixed Income).
There is one Manager that is an outliner, a truly “Balanced” Fund of 50% Equities and 50% Fixed Income. There is significant peer risk here and with no published return objective it is not possible to assess the appropriateness of its SAA. Albeit they will likely be the best performing manager when global sharemarkets fall sharply. However, over the longer term they are likely to struggle in keeping up with peers.
Within Income Assets
The variation within the Income Assets is consistent with analysis undertaken on the KiwiSaver Conservative Funds, see analysis here, which also includes a review of the risk drivers within Fixed Income, particularly likely variation in duration exposure.
Growth assets
As would be expected, the Growth Allocation is reasonably tight around 40%, the flip side of the Income Allocation.
Listed equities, including New Zealand equities, international equities, and listed property and infrastructure dominate the growth allocations i.e. there are very little investments into Alternatives. See Tables below.
Of interest, on average Domestic Equities (New Zealand and Australia) make up around 36% of the core equities allocations within the KiwiSaver Funds e.g. domestic and international listed equities ex listed property and infrastructure combined.
Overall, core equities make up 52% of a Fund on average. This is by far the dominant risk within these portfolios. On a risk basis, the equities allocations contribute to over 90% of the risks within a “Balanced” portfolio.
Ratio of Domestic Equities
Core Listed Equities
Averages
36.4%
51.9%
Min
26.0%
42.0%
Max
52.7%
60.0%
Median
35.4%
51.8%
The remaining growth allocations are predominately made up of listed Property and listed Infrastructure, with smaller allocations to alternatives. Direct Property dominates the alternative allocations, with smaller allocations to private equity and more liquid hedge fund type strategies.
Total Listed Equities Allocation
Alternatives Allocation
Alternatives share of Growth Assets
Averages
56.8%
3.2%
2.7%
Min
50.0%
0.0%
0.0%
Max
61.0%
6.0%
10.0%
Median
56.0%
4.0%
0.0%
Below is the same Data for a broad selection of Australian “Balanced” Funds.
Ratio of Domestic Equities
Core Listed Equities
Averages
39.8%
48.5%
Min
0.0%
30.0%
Max
51.0%
62.0%
Median
42.6%
50.0%
Total Listed Equities Allocation
Alternatives Allocation
Alternatives share of Growth Assets
Averages
52.3%
27.2%
33.4%
Min
30.0%
8.0%
9.5%
Max
76.0%
53.0%
63.9%
Median
50.0%
25.0%
33.3%
Australian “Balanced” Funds have an 80% allocation to Growth assets but a lower allocation to Core Equities (Australian and International Equities) than their New Zealand counterparts, 48.5% versus 51.9% on average for the Kiwi Funds.
This reflects that the Australian Funds have a higher allocation to Alternatives, which includes investment into Private Equity, Direct Property, Infrastructure, Commodities, and Diversified Multi-asset Funds.
Diversified Multi-Asset Funds
It should be noted that Diversified Multi-Asset Funds can have high allocations to listed equities, therefore some funds have a higher allocation to equities than appears based on sector allocations alone.
Diversified Multi-Asset funds offer “genuine diversification” relative to a traditional balanced fund and are more actively managed. In addition to investing in the traditional asset classes of equities and fixed income, they also invest into an array of alternative assets, often in more specialised areas and situations. These Funds seek breadth and depth across asset classes seeking to allocate to different return engines e.g. specialist areas of the health care industry, housing within property, renewable energy, and specialised credit opportunities.
Diversified Multi-Asset Funds offer an authentic option to increase diversification within a traditional portfolio, particularly for those investors who have constraints in relation to fees and liquidity.
There are several well-resourced managers in Australia with long histories of adding value with these types of funds.
Is it Apples vs Apples?
There is a wide variation in the Growth/Income split between New Zealand and Australian “Balanced” Funds.
Across both risk categories of Conservative and Balanced Funds, although the Australian Funds have higher Growth allocations than the Kiwi Funds, they have a slightly lower allocation to equities.
The difference is a lower allocation to fixed income and a higher alternative allocation in Australia. The portfolios are more diversified in Australia, this allows them to have a “higher” growth allocation. They are also most likely better positioned for the years ahead given the current stage in the economic and fixed income market cycles.
Although there is a degree of uniformity amongst the Kiwi Funds, you cannot choose a Fund by its name alone.
A review of the return objectives for both the New Zealand and Australian reveals:
The Australian Funds have return objective of CPI + 3% on average, they range from 2.5% to 4%.
The New Zealand Funds by and large fail to publish return objectives, those that do range from 2.5% – 3%.
This indicates that the universe of Funds is not too dissimilar from a return objective perspective, and the analysis above provides some real insights for consideration and to ask why the difference?
Personally, I think all managers should publish their return objectives in a CPI+ format. This is a valuable piece of information for the informed investor along with a Fund’s proposed risk category.
There are several options available for investors who are relying on fixed income investments to generate income in the current extremely challenging environment – characterised by low short-term rates and rising longer-term interest rates.
Short-term fixed income funds and private debt funds are two examples. Both seek to deliver a healthy return above cash and term deposits. They achieve this in a variety of ways, chiefly by gaining exposure to different investment risks.
In addition, active management is an important source of return from short-tern fixed income funds. And exposure to the illiquidity premium is a source of “excess” returns in relation to private debt funds.
Crucial to success in the current environment is an investor’s perception and measurement of risk.
In measuring risk, investor focus should be on avoiding permanent loss of capital, rather than volatility of capital and investment returns.
So long as permanent loss of capital is appropriately managed, investors should be prepared to accept a higher volatility of capital from their fixed income investments, along with less liquidity.
Such an approach will likely result in higher and more consistent levels of income in retirement.
Short-term fixed income funds
Short-term fixed income funds are actively managed fixed income funds that seek to take advantages of opportunities in short-term fixed income and credit markets to generate returns above cash and term deposits.
Although short-term fixed income funds target a lower average portfolio duration, they are often able to invest in securities that have up to 5 years until they mature. (Duration is a measure of a security and portfolio’s sensitivity to movements in interest rates. The higher a portfolio’s duration the more volatile it will be. A portfolio rises in value when interest rates fall and decreases in value when interest rates rise. Duration is measured in years.)
The target duration on “short-term fixed income funds” can vary materially, from less than 1 year and up to a maximum of three years.
Likewise, credit quality can vary significantly between different funds, ranging from high quality investment grade exposures to sub-investment grade (High Yield). On a more technical note, and often not considered, the credit duration of these funds can also vary, particularly in relation to the maximum term of credit security invested in. Like interest rate duration, credit duration is measured in years and the higher the credit duration the more volatile will be the security or portfolio.
Some of the short-term fixed income funds can also invest into inflation-linked securities, an additional diversifying source of return and risk exposure for a portfolio. And maybe a valuable addition to portfolios in the years ahead.
Funds also differ in the countries they invest into, from domestic markets (e.g. New Zealand and Australia) to internationally, including the emerging markets.
Therefore, there is a very broad spectrum of Funds in this category and fund selection should be undertaken relative to risk tolerances and any investment mandate constraints where applicable e.g. limits on credit quality.
In my mind, a broad investment mandate is better. This provides more opportunity for a manager to add value and manage portfolio risks – should they have the skill, resources, and capabilities to do so.
Lastly, short-term fixed income funds are generally highly liquid, and more liquid than term deposits.
My approach would be to implement as broad an investment strategy as possible given the constraints of fees, risk tolerance, and access to appropriate vehicles.
There are a number of these funds in the marketplace. For a Kiwi Investor, a strategy denominated in New Zealand dollar terms should be preferred.
Private Debt Funds
For those investors with a longer-term investment horizon and can maintain within their portfolio illiquid investments, Private Debt Funds offer the potential to boost returns, not only in the current investment environment, in the future as well.
Typically, the term “private debt” is applied to debt investments which are not financed by banks (non-bank lending) and are not issued or traded in an open market.
Private debt falls into a broader category termed ‘alternative debt’ or ‘alternative credit’, and is used interchangeably with ‘direct lending’, ‘private lending’ and ‘private credit’.
Within the private debt market, investors lend to investee entities – be they corporate groups, subsidiaries, or special purpose vehicles established to finance specific projects or assets – in the same way that banks lend to such entities.
Private debt investments are often used to finance business growth and provide working capital.
Private Debt Funds invest in loans to a wide range of borrowers such as public and private companies, infrastructure providers, property developers, and project finance groups.
Private Debt has been one of the fastest-growing asset classes. Part of this growth reflects a change in debt markets since the Global Financial Crisis (GFC) and a corresponding demand from investors, attracted by the return potential and a broader set of credit investment opportunities to invest in.
Illiquidity Risk Premium
To generate returns over cash and term deposits investors need to take on more risk.
Arguably the most efficient way to take on more risk is to invest into a diversified range of risk premiums. The best known risk premiums are value, growth, momentum, and to a lesser extent low volatility. Equity markets, interest rates, and credit are also risk premiums. Good active managers will add value over and above, or independently, of all these premiums.
There is also an illiquidity risk premium, which is often underrepresented in portfolios.
The illiquidity premium is the additional compensation to investors for not being able to access their capital for a specific period.
As a result, illiquid investments, such as Private Debt, should offer a “premium” in the form of higher yield expectations.
These higher relative yields could be a helpful in boosting income in the current environment and in the future.
Measuring Risk
“Risk means, more things can happen than will happen”, Elroy Dimson.
An investor’s perception and measurement of risk are important in managing an investment portfolio.
Perception toward risk is critical. For example, often, adding new “risks” to a portfolio leads to a less risky portfolio.
Most importantly, in managing investment risks, the ability to think in terms of probabilities is important. This involves understanding and appreciating the likelihood/chance of an event occurring and then the expected impacts of that event occurring to all parts of the portfolio.
In relation to measurement of risk, investor focus should be on avoiding permanent loss of capital, rather than measuring risk as fluctuations in capital and returns.
Warren Buffett understands this concept of risk very well. And, it has not done him any harm implementing this approach to risk!
Accordingly, investors would do better thinking along these lines in relation to risk.
So long as permanent loss of capital is appropriately managed, investors should prepare to accept a higher volatility of capital from their fixed income investments and less liquidity.
Such an approach will likely result in higher and more consistent levels of income in retirement.
Amongst the strategies to employ for the current interest rate environment is a Liability Driven Investment (LDI) approach.
LDI provides a framework for managing retirement income outcomes in what is likely to be a rising interest rate environment over the years ahead.
LDI places retirement planning goals at the centre of the investment approach leading to several key benefits:
More stable level of income in retirement;
More efficient use of capital – potentially need less retirement savings; and
Better framework to make trade-off between allocation to equities and the retirement income portfolio in improving the likelihood of reaching desired standard of living in retirement.
Under LDI a more customised investment solution can be developed.
Conversely, if an investor runs with a Cash strategy, where the goal is primarily capital preservation, they will likely need additional precautionary savings to meet their income requirements over retirement.
Therefore, while an LDI strategy increases the likelihood of reaching the retirement income objectives, it also achieves this with a more efficient allocation of investment capital.
The additional capital could be used for current consumption or invested in growth assets to potentially fund a higher standard of living in retirement, or used for other investment goals e.g. endowments and legacies.
Accordingly, LDI potentially provides a better framework in which to evaluate the risk of meeting your retirement income goals in a rising interest rate environment.
Retirement Planning (mis) focus
Arguably the primary goal of retirement planning is to provide a stable and secure stream of income in retirement – income to support a desired standard of living in retirement.
However, retirement planning investment approaches often focus too heavily on accumulated wealth e.g. how much do I need to save to retire on?
This could potentially result in the wrong focus. For example, if a New Zealander retired in 2008 with a million dollars, their annual income would have been around $80k by investing in retail term deposits. Their income would have dramatically dropped in 2009 to approximately $35k. That is a big drop in income! But interest rates have fallen further, currently (Feb 2021) a million dollars invested in New Zealand Term deposits will generate around $10k.
As a result, the focus should not necessarily be on the size of the account value e.g. KiwiSaver account balance.
This reflects that volatility of capital and investment returns are not a true measure of a retiree’s investment risk.
Investment strategies that focus on capital preservation, such as holding high levels of cash and short-term fixed income strategies, are riskier and more volatile relative to the investment goal of generating a stable and secure stream of income in retirement.
Redefining the Retirement Goal
Those planning for retirement seek to secure essential (sufficient income) and aspirational goals (additional wealth accumulation) with a high probability of achieving them.
Accordingly, the goal for retirement can be split between retirement income (essential goals) and wealth accumulation (aspirational goals).
Those saving for retirement should be focusing on more than accumulated wealth alone. Other key considerations may include a desired level of retirement spending, meeting children’s education costs, healthcare costs, and a legacy. These can be considered as future liabilities that need to be met.
Consequently, a better measure of a retiree’s investment risk becomes uncertainty around how much spending can be sustained in retirement.
Liability Driven Investing
Liability-driven investment (LDI) strategies, otherwise known as asset-liability management (ALM), take a complete and holistic approach.
LDI explicitly includes an investor’s current and future liabilities e.g., essential and aspirational goals.
The traditional way of building portfolios focusses more on risk tolerance, return expectations, and accumulated wealth rather than achieving the investment goals outlined above.
LDI creates better portfolios, particularly when it comes to retirement needs. A more robust portfolio is generated, and the focus is on the key investment risk; failure to meet your investment objectives.
Obviously most financial planning processes take into consideration investment and retirement goals. Nevertheless, LDI makes retirement goals the central piece of constructing a portfolio. With LDI, portfolio allocations and management of risks are relative to meeting retirement objectives.
A more customised investment solution is developed.
Dimensional Funds Advisors (DFA) undertook analysis comparing two investment strategies relative to the goal of generating a stable and secure level of income in retirement:
Goals based strategy that looks to generate sufficient income in retirement to match expected spending (consumption). This is the LDI strategy.
Capital preservation strategy that is invested in Cash to manage the volatility of the account balance.
The following conclusions can be drawn from the DFA analysis:
The LDI strategy provides a more stable stream of income in retirement;
The LDI strategy provides greater clarity and confidence to plan for retirement; and
The Cash strategy results in a high level of volatility relative to the goal of generating a stable level of income in retirement.
See here for a detailed review of the DFA Research.
In simple terms, the LDI strategy is a long-term bond portfolio that matches the expected retirement spending/consumption goal. Effectively, the LDI strategy generates cashflows to match future expected spending.
This reduces volatility relative to retirement spending goals.
Insurance Company’s implement a similar approach in meeting (paying out) future expected liabilities (insurance claims).
DFA conclude that “any strategy that attempts to reduce volatility using short- to intermediate-term fixed income, when the goal is a long-term liability like retirement consumption, will not be as effective as the LDI strategy.”
Although cash is perceived as low risk, it is not low risk when it comes to generating a steady and secure stream of income in retirement. Likewise, short term fixed income securities, while appropriate for capital preservation, are risky if the goal is to meet future spending/consumption in retirement.
In summary a LDI strategy provides the following benefits:
More stable level of income in retirement;
More efficient use of capital – potentially need less retirement savings; and
Better framework to make trade-off between allocation to equities and retirement income portfolio in improving the likelihood of reaching desired standard of living in retirement.
If an investor runs with a Cash strategy, where the goal is primarily capital preservation, they will likely need additional precautionary savings to meet their retirement income requirements.
Therefore, while an LDI strategy increases the likelihood of reaching the retirement income objectives, it also achieves this with a more efficient allocation of capital.
This additional capital could be used for current consumption or invested in growth assets to potentially fund a higher standard of living in retirement, or used for other investment goals e.g. endowments and legacies.
Accordingly, LDI potentially provides a better framework in which to assess the risk of meeting your retirement income goals in a rising interest rate environment.
LDI Investment Framework for Individuals
Under the LDI model there are two portfolios: the liability portfolio and a return seeking portfolio. Most investment products offered today are return seeking portfolios with some dampening down of risk (measured by volatility of returns).
LDI is used by pension funds and insurance companies where their investment objectives and portfolios are primarily reflected in the terms of their future liabilities.
“Institutional” investment approaches such as LDI, Two-portfolio separation, and being more dynamic, are finding their way into wealth management solutions.
EDHEC suggest investors should maintain two portfolios:
Goal-hedging portfolio – this replicates future replacement income goals; and
Performance-seeking portfolio – this portfolio seeks returns and is efficiently diversified across the different risk premia – disaggregation of investment returns.
And, over time the manager dynamically allocates to the hedging portfolio and performance seeking portfolio to ensure there is a high probability of meeting retirement income levels.
Nevertheless, and most importantly, the Goal Based Investment framework outlined by EDHEC focuses on the goal of generating income in retirement.
Instead of worrying about fluctuations in capital, investors investing for retirement should worry about fluctuations of income in retirement.
With regards to capital specifically, the focus should be on avoiding permanent loss of capital, rather than fluctuations in capital.
See here for more on the EDHEC Goals Based Investment approach.
An analysis of KiwiSaver Conservative Funds identifies a variation in underlying asset allocations, despite there being a generic look at a higher level (Income / Growth split).
The area of most pronounced difference is within the Income asset class allocations: Cash, New Zealand Fixed Income, and International Bonds. There are also nuances within each of these asset classes, particularly level of benchmark duration risk.
These differences will drive performance outcomes, having nothing to do with active management skill and very little in relation to fees paid.
Portfolio performance is primarily driven by portfolio construction and implementation decisions. The value of a good investment strategy.
Within the Income asset classes, the decision on duration and credit quality will drive performance (absolute returns and relative to peers). These decisions impact return outcomes over both the short and longer term.
A comparison to Australian Super Funds with similar objectives provides useful insights into asset allocation decisions being made in New Zealand.
Analysis of Balance and Growth KiwiSaver Funds has also been undertaken and will be provided at a later date.
Analysis of KiwiSaver Conservative Funds
The Table below provides average, min, and max allocations of the Strategic Asset Allocations of 12 KiwiSaver Providers’ Conservative Funds, sourced from their latest Statements of Investment Policy and Objectives (SIPO).
Cash
Fixed Income NZ
Fixed Income International
Income Allocation
Average
15.6%
22.7%
39.1%
77.4%
Min
1.0%
14.0%
28.0%
70.0%
Max
30.0%
36.0%
50.0%
82.0%
Median
17.3%
23.0%
40.5%
79.0%
Listed Equities New Zealand
Listed Equities International
Listed Property
Alternatives
Growth Allocation
Average
6.6%
12.4%
4.0%
2.1%
22.7%
Min
4.0%
9.0%
0.0%
0.0%
18.0%
Max
9.5%
16.0%
7.5%
5.0%
30.0%
Median
6.3%
12.5%
4.0%
1.6%
21.0%
Income Assets
From a top level, by and large the managers are tightly grouped around 77% allocation to Income assets (Cash, NZ Fixed Income and International Bonds).
There are a small group of four managers which are outliners, with income allocations closer to 70%.
This group is materially different from the bulk of the managers. They tend to have lower cash allocations and much higher equity allocations. Only one of these managers has a material weighting outside of the listed equity markets e.g. Alternatives.
Within Income Assets
The variation within Income asset class occurs at both the asset allocation and performance benchmark level. Both of which drive performance outcomes.
As can be seen from the Table above the variation in the allocation to Cash is extreme. Ranging from 1.0% to 30.0%.
Maintaining high levels of cash does not make a portfolio less risky. High levels of cash can raise risks relative to certain investment objectives, particularly if the investor is seeking a stable and more predictable income stream in retirement.
High levels of cash increase the variation of income in retirement and is less effective in providing portfolio protection at the time of sharp sharemarket declines. On both counts, longer maturing fixed income provides a better solution. See here for why holding high levels of cash at retirement can be scandalous.
Given the current environment of very low interest rates and higher equity market valuations in the US and NZ, a higher weighting to cash could be warranted.
The key benefits of cash are that it is highly liquid, provides emergency funds without impacting longer-term investments, and can arguably be “dry powder” funds when sharemarkets decline sharply. The key to the dry powder factor is having the investment discipline to act accordingly.
The allocations to Fixed Income (NZ Fixed Income and Global Bonds) are tighter, ranging from 50% – 76%, and averaging around 62%.
The allocation International Bonds is higher relative to domestic Bonds, on average making up 64% of the Fixed Income Allocations. International Bonds are the largest asset allocation weight within the portfolios of just under 40%.
Risk and Investment Management
From a risk management, and investment management perspective, a portfolio’s capital allocations to cash, NZ Fixed Income, and International Bonds are less relevant relative to the Portfolio’s duration and credit exposures.
A more accurate way of looking at risk, and managing a portfolio, is a Portfolio’s level of duration and credit exposure.
Duration is a key risk measure, and in general reflects a portfolios capital value sensitivity to changes in interest rates. Duration is measured in years. For example, assuming your Portfolio’s duration is 6 years, if interest rates rise by 1% the portfolio will decline by 6%, all else being equal.
See here for an explanation of Duration and here for credit risk.
Generally, those with a higher allocation to International Bonds have a higher level of interest rate risk. These portfolios would have benefited more from the significant decline in interest rates over the last 20 years.
From a high level, the range in total Portfolio duration is estimated to be:
Total Portfolio Duration
Average
4.06
Min
3.27
Max
5.01
Median
3.99
These are estimates, based on current index duration and portfolio asset allocations. The key points are, this is a more accurate view of portfolio risk and there is a reasonable spread in duration risk amongst the managers.
From this perspective, investors must be careful in assessing the relative risk of a Conservative Fund based on asset allocations alone.
By way of example, some Managers manage to a lower duration international bond index. Thus, despite having a higher international bond allocation these Portfolios may have lower interest rate risk (duration) than a portfolio with a lower international bond allocation but managing to a higher duration index. They may also have the same level of interest rate risk!
Therefore, what is important is how much duration risk a portfolio should have in meeting its investment objectives.
From an investment governance perspective, Investment Committees should not be debating the level of allocation to cash, international, or NZ fixed interest without first considering what is the most appropriate level of portfolio duration risk to target in meeting investment objectives. This is a different conversation and focus.
There is evidence that at least one of managers takes such an approach, maintaining a very low allocation to cash and a high allocation to Fixed Income. This portfolio is not necessarily riskier than the other Funds just because it has a low cash holding.
Lastly, it should be noted that the duration on the International Bond Index has almost doubled over the last 10 years. Therefore, if portfolio allocations to international bonds have remained static over the last 10 years, the risk of this allocation has increased along with the total portfolio’s risk profile. Unfortunately, with interest rates so low, the return prospects are less, yet the risks have increased.
For more on the unintended risks within fixed income see here.
Growth asset
As would be expected, the Growth Allocation is reasonably tight around 23%, the flip side of the Income Allocation.
Listed equities, including New Zealand equities, international equities, and listed property and infrastructure dominate the growth allocations i.e. there is very little investment in Alternatives.
Direct Property dominates the Alternative allocations.
Of interest, on average Domestic equities (New Zealand and Australia) make up around 35% of the core equities allocations e.g. domestic and international listed equities ex listed property and infrastructure.
Overall, core equities make up 19% of portfolios, domestic equities are around 6.5% of a Conservative Portfolio.
Ratio of Domestic Equities in Core Equities Allocation
The Table below presents the average, min, max, and medium asset allocations of the largest Super Funds in Australia. This list is dominated by Industry Funds.
The list includes funds with Conservative in their name and/or have similar return objectives to the KiwiSaver Funds. The return objectives are express as inflation plus a margin e.g. CPI + 1.0%.
The following quick observations can be made:
The Australian Funds have lower allocations to Income Assets than the New Zealand Funds, this is consistent with the Australian Funds having higher CPI + return objectives. A return objective is necessary to undertake portfolio modelling. Also, don’t always choose a Fund my its name!
At the same time, the Aussie Funds have much higher Cash allocations relative to the NZ Funds.
The above means the Australian Funds have much lower Fixed Income allocations. They also only show Fixed Income, not domestic and international bonds breakdown, which is consistent with the discussion above.
Interestingly, the listed equity allocation is in line with the Kiwi Funds, around 20%. However, the weighting in Australia to domestic equities in the total core equities allocation is closer to 50%, compared to 35% in NZ. Domestic equities make up around 9% of a Conservative Fund in Australia, compared to 6.5% in New Zealand. Albeit, the Australian Funds do have a higher risk profile.
The Australian Funds have significantly higher allocations to Alternatives than the NZ Funds. When you consider a similar core equities allocations and higher cash allocations in Australia, the higher Alternatives allocation comes at the expense of Fixed Income.
Australian Super Funds
Cash
Fixed Income
Income Allocation
Average
27.5%
36.7%
59.6%
Min
23.0%
28.5%
53.0%
Max
37.0%
67.0%
67.0%
Median
25.0%
30.3%
58.3%
Listed Equities Domestic
Listed Equities International
Alternatives
Growth
Average
9.1%
11.1%
21.8%
40.4%
Min
7.0%
7.0%
6.0%
33.0%
Max
11.5%
17.5%
29.5%
47.0%
Median
9.5%
10.5%
24.0%
41.8%
The Alternatives allocation will be discussed in more depth when presenting the results of the Balance and Growth Fund’s allocations.
The most recent Monthly Financial Markets Commentary and Performance is for March 2021.
David vs Goliath
GameStop dominated headlines over the last week of January and distracted market participants from key fundamentals.
In a sign of our times, encouraged via social media platform Reddit retail investors brought into GameStop, one of the most heavily shorted stocks in the market. This led to a “short-squeeze”. As the stock price of GameStop rose, rising by over 1,500% in January, short-sellers had to buy back the stock to cover their loses, pushing the stock price higher. Loses from the short-squeeze are estimated to have totaled $6 billion at one stage, mainly incurred by hedge funds.
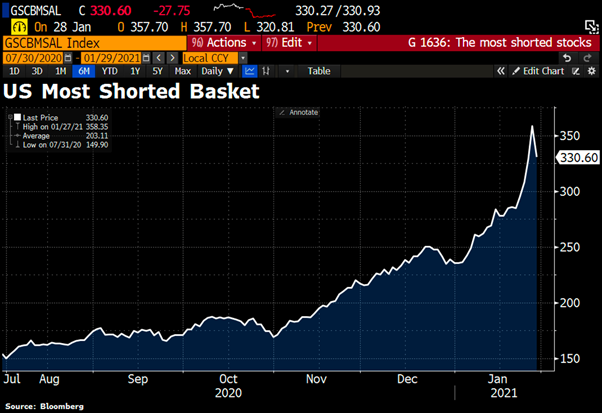
A Goldman Sachs’ index of the most heavily shorted stocks rose close to 30% in January, ouch! This is the index’s best monthly return since 2008, a painful month for short sellers. See graph below.
The GameStop short-squeeze is considered one of the largest in US history and resulted in increased market volatility.
Another Goldman Index of the most popular hedge funds stocks fell by over 5% in a week as hedge funds sold stock positions to cover losses on their shorts, double ouch!!
The events surrounding GameStop are not expected to derail global equities markets, which are best characterised as at the early stages of a new bull market run. Pull backs and corrections can be expected along the way.
Economic Fundamentals
The GameStop event detracted from developments earlier in the month and improving fundamentals in relation to the fight against the Coronavirus.
The US Democratic party took control of the US Senate by the slimmest of margins after winning both seats in the Georgia run-off elections held in early January. They now control the Presidency, Senate, and House of Representatives.
President Biden released his $1.9 trillion (over 8% of the economy) Covid-19 Relief package, this is in addition to the $900 billion of spending approved by Congress in December. The plan includes $1,400 in additional direct payments to individuals (raising checks to $2000) and aid to small businesses.
Although there are political risks around getting the complete packaged passed, a significant percentage of the package is likely to be passed into law. This will represent a sizable stimulus for the US economy in the months ahead.
The extra spending along with ultra-low interest rates argues well for the global and US economy in 2021 and 2022.
Interest rates are likely to remain low for some time. Many Central Banks, for example the US Federal Reserve and Reserve Bank of Australia, are unlikely to raise interest rates until annual inflation has run above 2% for some time. This is not expected to occur until late 2024.
Over the later part of January, the daily rate of global coronavirus cases and hospitalisations began to decline, particularly in the US, Europe, and Japan.
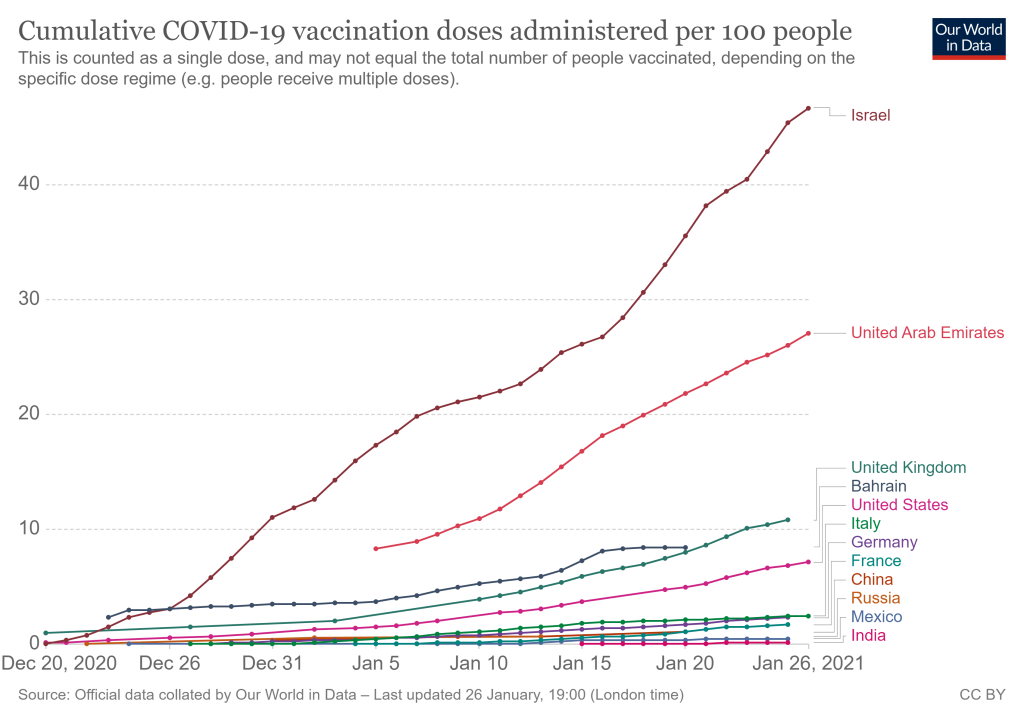
At the same time the global vaccine rollout continues to gather pace, approximately 4.5 million vaccine doses are being administrated daily.
In total, more than 100 million vaccine doses had been administrated in 56 countries by early February 2021. Israel is leading with over 57% of their population vaccinated. America has vaccinated over 32 million people, 9.6% of their population. The UK has reached 14% of their population.
Goldman Sachs predict: The UK is expected to vaccinate 50% of its population in March, with the US and Canada following in April. The EU, Japan, and Australia reach this 50% threshold in May.
Once the vaccine rollout gathers speed the reopening of economies will accelerate around the world.
Economic data
Although global economic activity slowed over the last few months of 2020, due to rising covid-19 cases and associated lock down measures, the global economy is on track for a V-shaped recover. The US and China are leading the way. Europe is at risk of a double dip recession.
The consensus forecast for world economic growth in 2021 is just over 5%, and approximately 4.0% for 2022. The global economy shrank by around 4.0% in 2020.
For the first time in over 10 years, we are likely to see strong and synchronised global economic growth over the years ahead.
The Chinese economy rose 6.5% in the last quarter of 2020 from a year earlier. A strong outcome to finish the year and resulted in the Chinese economy growing 2.5% last year, the only major economy to report positive economic growth for 2020. Albeit this is the country’s weakest annual economic expansion since the late 1970s.
Based on first estimates the US economy grew 4.0% (annualised rate) over the 2020 December Quarter, which is below consensus forecasts and down on the 33.4% annualised rate in the third quarter of last year.
The Euro area economy contracted 0.7% over the final three months of 2020, this was a little bit better than expected.
Economic activity in New Zealand and Australia is exceeding expectations. Most notable was the surprise fall in New Zealand’s unemployment to 4.9%, levels not seen since 2017 and much lower than the 5.6% anticipated. The export and housing sectors drove employment growth.
Market Performance
Reflecting the volatility arising from the GameStop short-squeeze the US sharemarket fell 1.0% in January. In the US smaller sized companies continued to outperform.
International sharemarket benchmarks performed a little better than the US market. Markets across Asia performing well, particularly China (+4.8%). Latin American markets underperformed.
Overall, Emerging Markets continued to outperform Developed Markets, EM markets returning over 3.0% in January.
The Australian and New Zealand sharemarkets eked out positive returns, +0.3% and 0.1% respectively.
Commodities performed well, +4.8%, oil outperformed in January (+7.5%) and the price of Gold fell (-2.5%).
By and large fixed income underperformed in January, particularly longer dated securities as interest rates drifted higher. In New Zealand, the Government Bond Index fell 0.3% and Australia’s -0.7%.
Regulatory approval of Covid-19 vaccine and commencement of global immunisation program
Democrat Party’s eventual control of Presidency, Senate, and House of Representatives will provide further support to the US economy from an increase in government spending
US Federal Reserve’s decision to adopt a more flexible “average inflation targeting” policy
In recent months there has been a tug of war between rising Covid-19 infections and the development, approval, and initial distribution of a Covid-19 vaccine.
Increasingly the roll out of the vaccine will win this battle, helped by increased spending in the US and ultra-low interest rates around the world. This is supportive of global economic activity and sharemarkets in 2021.
Key Risks
The Covid-19 vaccines are less effective than anticipated, particularly given existence of different strains
The US Federal Reserve change their policy settings earlier than expected
US consumers are cautious preferring to save rather than spend more of their $2,000 government handout
There is the risk that global economic activity surprises on the upside in 2021
Portfolio Considerations
Prefer equities over fixed income on a 12 – 18 months time horizon
Shorten duration exposures of portfolios
Emerging markets, cyclicals, and value to outperform
Any sharemarket pull-back should be seen as an opportunity to add too equities
Start preparing portfolios for a period of higher inflation
Effective and efficient implementation of investment strategies key.
Vaccine Roll Out
A successful vaccine has been developed in record time, less than one year. The previous record for the fastest time to develop a vaccine occurred in the late 1960s when it took four years to develop a vaccine for the mumps.
More than 68 million vaccine doses had been administrated in 56 countries by late January 2021. The daily rate is approximately 3.4 million doses a day. Israel is leading with 43% of their population vaccinated. America has given out 23.5 million doses, 7.1% of their population.
A World Health Organisation linked plan is in place to administer 2 billion vaccine doses globally in the first half of 2021. Expectations are for large portions of the population to be vaccinated by the middle of 2021.
Goldman Sachs forecast: The UK is expected to vaccinate 50% of its population by the end of March, with the US and Canada following in April. The EU, Japan, and Australia reach the 50% threshold in May.
These targets are likely given the expected ramping up of vaccine production over the months ahead and despite a slower start to the vaccine roll out than expected in some countries.
Albeit virus cases and deaths have reached new records and new variants of the virus have emerged in the UK, Ireland, and South Africa. This wave of infections across the world, particularly in Europe and the UK, has resulted in renewed lockdowns and ongoing restrictions on activities.
As a result, global economic activity is expected to be weaker over the last quarter of 2020, after a strong rebound in the third quarter of last year. This weakness is expected to flow over into the New Year, 2021, given the above and that it has been a harsh northern winter. This is reflected in recent economic data. For example, the US economy expanded at a 4% annualised rate in the fourth quarter of 2020, which was below expectations and down from the record 33.4% annualised rate in the previous three months.
However, once the vaccine rollout gathers speed the reopening of economies will accelerate around the world.
Democrats win Georgia Senate elections
The outlook for 2021 is positive and received a boost following the Democrats taking control of the US Senate by the slimmest of margins after winning both seats in the Georgia run-off elections held in early January.
President Biden has released his $1.9 trillion (over 8% of the economy) Covid-19 Relief package, this is in addition to the $900 billion of spending approved by Congress in December. The plan includes $1,400 in additional direct payments to individuals (raising cheques to $2000) and aid to small businesses.
The relief package aims to provide economic support until the threat of the pandemic has receded.
There are political risks around getting the complete packaged passed in to law. Albeit, a sizeable percentage of the package is likely to be passed into law, which will represent a sizable stimulus for the US economy.
The extra spending along with ultra-low interest rates argues well for the global and US economy.
Interest rates are likely to remain low for some time.
US Federal Reserve Policy Position
The US Federal Reserve (Fed) will now seek to achieve average inflation of 2% over time. Instead of targeting a 2% inflation rate, the Fed will allow higher inflation “for some time” to offset below 2% periods of inflation.
They will also target “broad and inclusive employment”, where employment is placed ahead of inflation in terms of policy priority.
This is a dramatic change in policy and has implications for financial markets now and in the future.
The key short-term impact, interest rates in the US are expected to remain lower for longer. Specifically, the Fed will likely keep the Feds Fund Rate at the currently level of 0.25% until after there has been a period of inflation above 2%. And this is not likely to happen until late 2024 – early 2025.
Longer-term, the risks to containing inflation have increased. Likewise, longer-term interest rates will likely drift upward in anticipation of higher inflation and as the Fed scales back on other areas of their Policy response, such as the buying of fixed income securities (tapering of Quantitative Easing Policy).
With regards to US inflation, core consumer prices have risen 1.6% over the last year in the USA.
Although inflation is expected to be well contained over the next few years, the risks of higher inflation in the future are mounting, particularly given the size of the government spending being undertaken in the US.
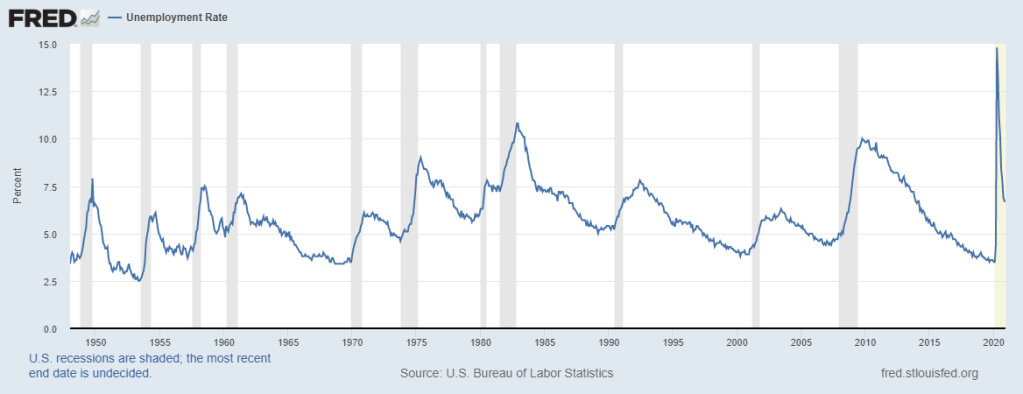
Although there might be some volatility in the inflation rate over 2021, reflecting the extreme disruption to the economy last year, core inflation is set to remain low given the level of spare capacity within the economy. By way of example, as presented in the graph below, US unemployment remains high despite a breathtaking recovery over the second half of 2020. The US unemployment rate is currently 6.7%. This compares to 14.8% at the end of April 2020 and 3.5% at the beginning of the year.
Nevertheless, the global economic environment is transforming to a more reflationary phase. This compares to the deflationary environment that has dominated the global economy since 2008 and the Global Financial Crisis (GFC).
As outlined in this Kiwi Investor Blog Post, investors are well advised to consider preparing their portfolios for the potential of a higher inflation environment.
Economic Outlook
The global economy is poised to rebound strongly in 2021, primarily driven by the factors outlined above, vaccine roll out, ultra-low interest rates, and government spending measures.
For the first time in over 10 years, we are likely to see strong and synchronised global economic growth over the years ahead.
The consensus forecast for world economic growth in 2021 is just over 5%, and approximately 4.0% in 2022. The global economy shrank 4.2% in 2020.
The V shape economic recovery is well on track around the world.
Given the Democrats win in Georgia as outlined above, economic growth forecasts for the US have been revised upwards recently on an expected increase in government spending. Consensus forecasts are for just over 4.0% growth in 2021, after a decline of 3.5% in 2020.
Many areas of the US economy are expected to perform well in 2021, including consumer spending, a rebound in capital expenditures, a strong housing market, and inventory rebuilding. Given above potential economic growth this year the level of unemployment should decline, reducing the slack in the US labour market.
The US economy has remained resilient in the face of the pandemic, with businesses learning to adapt to restrictions on activities. There is little evidence of economic scaring that would have negative longer-term impacts on economic activity.
This argues well for the US and risks to economic activity in 2021 could well be to the upside.
The Chinese economy rose 6.5% in the last quarter of 2020 from a year earlier. A strong outcome to finish the year and resulted in the Chinese economy growing 2.5% last year, the only major economy to report positive economic growth for 2020. Albeit this is the country’s weakest annual economic expansion since the late 1970s.
China is more advanced in its economic cycle post Covid relative to the rest of the world. The rebound in the economy is being driven by industrial production, exports, retail sales, and investment into fixed assets. Like the rest of the world, economic activity remains weak in tourist related industries, such as hotels and catering.
Around the rest of the world the Eurozone is expected to grow around 4.6% in 2021 after the sharp -7% contraction in 2020. The UK economy, which suffered one of the sharpest declines in 2020, estimated to have contracted by -11.2%, is on track to rebound in 2021 with over 5% GDP growth. The Japanese economy is expected to grow by around 2.5% in 2021.
The New Zealand economy expanded a stronger than expected 14% in the third quarter of 2020. This follows a historical 11% contraction in the second quarter. The economy is 2.2% smaller compared to a year ago. Construction and retail trade led the recovery following the second quarter lockdown. Accordingly, there has been an improvement in business confidence.
Inflation in the final quarter of 2020 was 0.5%, which was stronger than expected. Annual inflation was unchanged at 1.4%. The quarterly result in part reflects strong demand in some areas (e.g. accommodation and air travel) due to pent up demand following lockdown, supply issues in other sectors, and rising prices for housing construction.
Some volatility in inflation data can be expected in the quarters ahead, and Central Banks, such as the Reserve Bank of New Zealand, will look through this volatility.
In relation to New Zealand, a strong rise in house prices over the last three months of 2020 has reduced the likelihood of negative cash rates.
This turn of events has witnessed a steady appreciation of the New Zealand dollar (Kiwi) over the last quarter. The Kiwi is currently trading at around 72 cents versus the US dollar, compared to 67 cents at the end of September (+6%), and is 18% higher compared to 60 cents at the end of April 2020.
Brief Market and Portfolio Positioning Comments
Global equities climbed over 17% in the December 2020 Quarter, to finish the year 16.9% higher than at the end of 2019.
The US sharemarket ended the year at historical highs. The S&P500 returned 18.4% in 2020 and is over 70.0% higher from its yearly lows in late March.
The New Zealand sharemarket also finished the year strongly, rising 16.3% in the last quarter of the year, returning 14.7% in 2020. This is the Index’s ninth consecutive year of positive returns. The benchmark has more than quadrupled since the end of 2011, and more than doubled since 2015 (benchmark returns are based on S&P Dow Jones Index data).
The Australian sharemarket returned 13.7% over the last three months of 2020, eking out 1.4% for the year.
Information Technology and Consumer Discretionary tended to be the better performing sections, Energy and Real Estate sectors the worst.
Growth factor outperformed Value by a wide margin in 2020, as is has for some time. In the US, growth returned 33.5% and value 1.4% for the 12 months period.
Nevertheless, this hides a sharp reversal in market fortunes over the last quarter of 2020, in the US value returned 14.5% and growth 10.7%, enhanced value returned 24.6% for the period.
This reversal in market leadership has some legs and likely has further to run, given the economic backdrop outlined above.
Likewise, cyclicals and the energy sectors will benefit from stronger global growth and the releasing of pent-up demand as economies open-up following the roll out of the vaccine.
After 10-years of underperforming Development Markets, Emerging Markets are better placed to benefit from an increase in global manufacturing. These markets recently reached historical highs; surpassing levels last seen in 2007.
Within portfolios duration should be reduced.
The ultra-low interest rate environment presents challenges for investors in the years ahead. Over reliance on cash, fixed income, and equities to generate portfolio returns could lead to disappointing outcomes. Investors should look to increasingly diversify outside of the traditional asset class. This Post by Kiwi Investor Blog provides access to discussions on different portfolio investment strategies than could be considered in meeting the challenges ahead.
Global sharemarkets have performed strongly in recent months and are susceptible to a pull back.
Given the economic backdrop outlined above, this would provide an opportunity to consider adding to equity positions.