Monthly Financial Markets Commentary and Performance – January 2021

The most recent Monthly Financial Markets Commentary and Performance is for March 2021.

David vs Goliath

  • GameStop dominated headlines over the last week of January and distracted market participants from key fundamentals.
  • In a sign of our times, encouraged via social media platform Reddit retail investors brought into GameStop, one of the most heavily shorted stocks in the market.  This led to a “short-squeeze”.  As the stock price of GameStop rose, rising by over 1,500% in January, short-sellers had to buy back the stock to cover their loses, pushing the stock price higher.  Loses from the short-squeeze are estimated to have totaled $6 billion at one stage, mainly incurred by hedge funds.
  • A Goldman Sachs’ index of the most heavily shorted stocks rose close to 30% in January, ouch!  This is the index’s best monthly return since 2008, a painful month for short sellers. See graph below.
  • The GameStop short-squeeze is considered one of the largest in US history and resulted in increased market volatility. 
  • Another Goldman Index of the most popular hedge funds stocks fell by over 5% in a week as hedge funds sold stock positions to cover losses on their shorts, double ouch!!
  • The events surrounding GameStop are not expected to derail global equities markets, which are best characterised as at the early stages of a new bull market run.  Pull backs and corrections can be expected along the way.

Economic Fundamentals

  • The GameStop event detracted from developments earlier in the month and improving fundamentals in relation to the fight against the Coronavirus.
  • The US Democratic party took control of the US Senate by the slimmest of margins after winning both seats in the Georgia run-off elections held in early January.  They now control the Presidency, Senate, and House of Representatives.
  • President Biden released his $1.9 trillion (over 8% of the economy) Covid-19 Relief package, this is in addition to the $900 billion of spending approved by Congress in December.  The plan includes $1,400 in additional direct payments to individuals (raising checks to $2000) and aid to small businesses. 
  • Although there are political risks around getting the complete packaged passed, a significant percentage of the package is likely to be passed into law.  This will represent a sizable stimulus for the US economy in the months ahead.
  • The extra spending along with ultra-low interest rates argues well for the global and US economy in 2021 and 2022.
  • Interest rates are likely to remain low for some time.   Many Central Banks, for example the US Federal Reserve and Reserve Bank of Australia, are unlikely to raise interest rates until annual inflation has run above 2% for some time.  This is not expected to occur until late 2024.
  • Over the later part of January, the daily rate of global coronavirus cases and hospitalisations began to decline, particularly in the US, Europe, and Japan.
  • At the same time the global vaccine rollout continues to gather pace, approximately 4.5 million vaccine doses are being administrated daily.
  • In total, more than 100 million vaccine doses had been administrated in 56 countries by early February 2021.  Israel is leading with over 57% of their population vaccinated.  America has vaccinated over 32 million people, 9.6% of their population.  The UK has reached 14% of their population.
  • Goldman Sachs predict: The UK is expected to vaccinate 50% of its population in March, with the US and Canada following in April. The EU, Japan, and Australia reach this 50% threshold in May.
  • Once the vaccine rollout gathers speed the reopening of economies will accelerate around the world.

Economic data

  • Although global economic activity slowed over the last few months of 2020, due to rising covid-19 cases and associated lock down measures, the global economy is on track for a V-shaped recover.  The US and China are leading the way.  Europe is at risk of a double dip recession.
  • The consensus forecast for world economic growth in 2021 is just over 5%, and approximately 4.0% for 2022.  The global economy shrank by around 4.0% in 2020.
  • For the first time in over 10 years, we are likely to see strong and synchronised global economic growth over the years ahead.
  • The Chinese economy rose 6.5% in the last quarter of 2020 from a year earlier.  A strong outcome to finish the year and resulted in the Chinese economy growing 2.5% last year, the only major economy to report positive economic growth for 2020.  Albeit this is the country’s weakest annual economic expansion since the late 1970s.
  • Based on first estimates the US economy grew 4.0% (annualised rate) over the 2020 December Quarter, which is below consensus forecasts and down on the 33.4% annualised rate in the third quarter of last year.
  • The Euro area economy contracted 0.7% over the final three months of 2020, this was a little bit better than expected.
  • Economic activity in New Zealand and Australia is exceeding expectations.  Most notable was the surprise fall in New Zealand’s unemployment to 4.9%, levels not seen since 2017 and much lower than the 5.6% anticipated.  The export and housing sectors drove employment growth.

Market Performance

  • Reflecting the volatility arising from the GameStop short-squeeze the US sharemarket fell 1.0% in January.  In the US smaller sized companies continued to outperform.
  • International sharemarket benchmarks performed a little better than the US market. Markets across Asia performing well, particularly China (+4.8%).  Latin American markets underperformed.
  • Overall, Emerging Markets continued to outperform Developed Markets, EM markets returning over 3.0% in January.
  • The Australian and New Zealand sharemarkets eked out positive returns, +0.3% and 0.1% respectively.
  • Commodities performed well, +4.8%, oil outperformed in January (+7.5%) and the price of Gold fell (-2.5%).
  • By and large fixed income underperformed in January, particularly longer dated securities as interest rates drifted higher.  In New Zealand, the Government Bond Index fell 0.3% and Australia’s -0.7%.

Please read my Disclosure Statement


Global Investment Ideas from New Zealand. Building more Robust Investment Portfolios.

Virus vs Vaccine and spending – Quarterly Economic and Financial Markets Commentary January 2021 – Kiwi Investor Blog

Key Developments over the Quarter

  • Regulatory approval of Covid-19 vaccine and commencement of global immunisation program
  • Democrat Party’s eventual control of Presidency, Senate, and House of Representatives will provide further support to the US economy from an increase in government spending
  • US Federal Reserve’s decision to adopt a more flexible “average inflation targeting” policy

In recent months there has been a tug of war between rising Covid-19 infections and the development, approval, and initial distribution of a Covid-19 vaccine.

Increasingly the roll out of the vaccine will win this battle, helped by increased spending in the US and ultra-low interest rates around the world.  This is supportive of global economic activity and sharemarkets in 2021.

Key Risks

  • The Covid-19 vaccines are less effective than anticipated, particularly given existence of different strains
  • The US Federal Reserve change their policy settings earlier than expected
  • US consumers are cautious preferring to save rather than spend more of their $2,000 government handout
  • There is the risk that global economic activity surprises on the upside in 2021

Portfolio Considerations

  • Prefer equities over fixed income on a 12 – 18 months time horizon
  • Shorten duration exposures of portfolios
  • Emerging markets, cyclicals, and value to outperform
  • Any sharemarket pull-back should be seen as an opportunity to add too equities
  • Start preparing portfolios for a period of higher inflation

Effective and efficient implementation of investment strategies key.

Vaccine Roll Out

A successful vaccine has been developed in record time, less than one year.  The previous record for the fastest time to develop a vaccine occurred in the late 1960s when it took four years to develop a vaccine for the mumps.

More than 68 million vaccine doses had been administrated in 56 countries by late January 2021.  The daily rate is approximately 3.4 million doses a day.  Israel is leading with 43% of their population vaccinated.  America has given out 23.5 million doses, 7.1% of their population. 

A World Health Organisation linked plan is in place to administer 2 billion vaccine doses globally in the first half of 2021. Expectations are for large portions of the population to be vaccinated by the middle of 2021. 

Goldman Sachs forecast: The UK is expected to vaccinate 50% of its population by the end of March, with the US and Canada following in April. The EU, Japan, and Australia reach the 50% threshold in May.

These targets are likely given the expected ramping up of vaccine production over the months ahead and despite a slower start to the vaccine roll out than expected in some countries.

Albeit virus cases and deaths have reached new records and new variants of the virus have emerged in the UK, Ireland, and South Africa.  This wave of infections across the world, particularly in Europe and the UK, has resulted in renewed lockdowns and ongoing restrictions on activities.

As a result, global economic activity is expected to be weaker over the last quarter of 2020, after a strong rebound in the third quarter of last year. This weakness is expected to flow over into the New Year, 2021, given the above and that it has been a harsh northern winter. This is reflected in recent economic data. For example, the US economy expanded at a 4% annualised rate in the fourth quarter of 2020, which was below expectations and down from the record 33.4% annualised rate in the previous three months.

However, once the vaccine rollout gathers speed the reopening of economies will accelerate around the world.

Democrats win Georgia Senate elections

The outlook for 2021 is positive and received a boost following the Democrats taking control of the US Senate by the slimmest of margins after winning both seats in the Georgia run-off elections held in early January.

President Biden has released his $1.9 trillion (over 8% of the economy) Covid-19 Relief package, this is in addition to the $900 billion of spending approved by Congress in December.  The plan includes $1,400 in additional direct payments to individuals (raising cheques to $2000) and aid to small businesses. 

The relief package aims to provide economic support until the threat of the pandemic has receded.

There are political risks around getting the complete packaged passed in to law.  Albeit, a sizeable percentage of the package is likely to be passed into law, which will represent a sizable stimulus for the US economy.

The extra spending along with ultra-low interest rates argues well for the global and US economy. 

Interest rates are likely to remain low for some time.

US Federal Reserve Policy Position

The US Federal Reserve (Fed) will now seek to achieve average inflation of 2% over time.  Instead of targeting a 2% inflation rate, the Fed will allow higher inflation “for some time” to offset below 2% periods of inflation. 

They will also target “broad and inclusive employment”, where employment is placed ahead of inflation in terms of policy priority.

This is a dramatic change in policy and has implications for financial markets now and in the future.

The key short-term impact, interest rates in the US are expected to remain lower for longer.  Specifically, the Fed will likely keep the Feds Fund Rate at the currently level of 0.25% until after there has been a period of inflation above 2%.  And this is not likely to happen until late 2024 – early 2025.

Longer-term, the risks to containing inflation have increased.  Likewise, longer-term interest rates will likely drift upward in anticipation of higher inflation and as the Fed scales back on other areas of their Policy response, such as the buying of fixed income securities (tapering of Quantitative Easing Policy).

With regards to US inflation, core consumer prices have risen 1.6% over the last year in the USA.

Although inflation is expected to be well contained over the next few years, the risks of higher inflation in the future are mounting, particularly given the size of the government spending being undertaken in the US.

Although there might be some volatility in the inflation rate over 2021, reflecting the extreme disruption to the economy last year, core inflation is set to remain low given the level of spare capacity within the economy.  By way of example, as presented in the graph below, US unemployment remains high despite a breathtaking recovery over the second half of 2020. The US unemployment rate is currently 6.7%. This compares to 14.8% at the end of April 2020 and 3.5% at the beginning of the year.

Nevertheless, the global economic environment is transforming to a more reflationary phase. This compares to the deflationary environment that has dominated the global economy since 2008 and the Global Financial Crisis (GFC).

As outlined in this Kiwi Investor Blog Post, investors are well advised to consider preparing their portfolios for the potential of a higher inflation environment.

Economic Outlook

The global economy is poised to rebound strongly in 2021, primarily driven by the factors outlined above, vaccine roll out, ultra-low interest rates, and government spending measures.

For the first time in over 10 years, we are likely to see strong and synchronised global economic growth over the years ahead.

The consensus forecast for world economic growth in 2021 is just over 5%, and approximately 4.0% in 2022.  The global economy shrank 4.2% in 2020.

The V shape economic recovery is well on track around the world.

Given the Democrats win in Georgia as outlined above, economic growth forecasts for the US have been revised upwards recently on an expected increase in government spending. Consensus forecasts are for just over 4.0% growth in 2021, after a decline of 3.5% in 2020.

Many areas of the US economy are expected to perform well in 2021, including consumer spending, a rebound in capital expenditures, a strong housing market, and inventory rebuilding. Given above potential economic growth this year the level of unemployment should decline, reducing the slack in the US labour market.

The US economy has remained resilient in the face of the pandemic, with businesses learning to adapt to restrictions on activities.  There is little evidence of economic scaring that would have negative longer-term impacts on economic activity. 

This argues well for the US and risks to economic activity in 2021 could well be to the upside.

The Chinese economy rose 6.5% in the last quarter of 2020 from a year earlier.  A strong outcome to finish the year and resulted in the Chinese economy growing 2.5% last year, the only major economy to report positive economic growth for 2020.  Albeit this is the country’s weakest annual economic expansion since the late 1970s.

China is more advanced in its economic cycle post Covid relative to the rest of the world.  The rebound in the economy is being driven by industrial production, exports, retail sales, and investment into fixed assets.  Like the rest of the world, economic activity remains weak in tourist related industries, such as hotels and catering.

Around the rest of the world the Eurozone is expected to grow around 4.6% in 2021 after the sharp -7% contraction in 2020.  The UK economy, which suffered one of the sharpest declines in 2020, estimated to have contracted by -11.2%, is on track to rebound in 2021 with over 5% GDP growth. The Japanese economy is expected to grow by around 2.5% in 2021.

The New Zealand economy expanded a stronger than expected 14% in the third quarter of 2020.  This follows a historical 11% contraction in the second quarter.  The economy is 2.2% smaller compared to a year ago.  Construction and retail trade led the recovery following the second quarter lockdown.  Accordingly, there has been an improvement in business confidence.

Inflation in the final quarter of 2020 was 0.5%, which was stronger than expected.  Annual inflation was unchanged at 1.4%.  The quarterly result in part reflects strong demand in some areas (e.g. accommodation and air travel) due to pent up demand following lockdown, supply issues in other sectors, and rising prices for housing construction.

Some volatility in inflation data can be expected in the quarters ahead, and Central Banks, such as the Reserve Bank of New Zealand, will look through this volatility.

In relation to New Zealand, a strong rise in house prices over the last three months of 2020 has reduced the likelihood of negative cash rates. 

This turn of events has witnessed a steady appreciation of the New Zealand dollar (Kiwi) over the last quarter.  The Kiwi is currently trading at around 72 cents versus the US dollar, compared to 67 cents at the end of September (+6%), and is 18% higher compared to 60 cents at the end of April 2020.

Brief Market and Portfolio Positioning Comments

  • Global equities climbed over 17% in the December 2020 Quarter, to finish the year 16.9% higher than at the end of 2019.
  • The US sharemarket ended the year at historical highs.  The S&P500 returned 18.4% in 2020 and is over 70.0% higher from its yearly lows in late March.
  • The New Zealand sharemarket also finished the year strongly, rising 16.3% in the last quarter of the year, returning 14.7% in 2020.  This is the Index’s ninth consecutive year of positive returns.  The benchmark has more than quadrupled since the end of 2011, and more than doubled since 2015 (benchmark returns are based on S&P Dow Jones Index data).
  • The Australian sharemarket returned 13.7% over the last three months of 2020, eking out 1.4% for the year. 
  • Information Technology and Consumer Discretionary tended to be the better performing sections, Energy and Real Estate sectors the worst.
  • Growth factor outperformed Value by a wide margin in 2020, as is has for some time.  In the US, growth returned 33.5% and value 1.4% for the 12 months period.
  • Nevertheless, this hides a sharp reversal in market fortunes over the last quarter of 2020, in the US value returned 14.5% and growth 10.7%, enhanced value returned 24.6% for the period.
  • This reversal in market leadership has some legs and likely has further to run, given the economic backdrop outlined above.
  • Likewise, cyclicals and the energy sectors will benefit from stronger global growth and the releasing of pent-up demand as economies open-up following the roll out of the vaccine.
  • After 10-years of underperforming Development Markets, Emerging Markets are better placed to benefit from an increase in global manufacturing.  These markets recently reached historical highs; surpassing levels last seen in 2007.
  • Within portfolios duration should be reduced.
  • The ultra-low interest rate environment presents challenges for investors in the years ahead.  Over reliance on cash, fixed income, and equities to generate portfolio returns could lead to disappointing outcomes.  Investors should look to increasingly diversify outside of the traditional asset class.  This Post by Kiwi Investor Blog provides access to discussions on different portfolio investment strategies than could be considered in meeting the challenges ahead.

Global sharemarkets have performed strongly in recent months and are susceptible to a pull back. 

Given the economic backdrop outlined above, this would provide an opportunity to consider adding to equity positions.

Please read my Disclosure Statement


Global Investment Ideas from New Zealand. Building more Robust Investment Portfolios.

The Value of Financial Advice

Getting the right financial advice can deliver more than just better investment outcomes. It can result in increased peace of mind heading into retirement, lower stress in a relationship or even higher happiness levels.

The research is clear cut, people who receive Financial advice are generally happier and are likely have a higher level of wealth at the point of retirement.

Even for those who receive limited advice on specific elements of their financial situation can experience material benefits.

Analysis supporting these conclusions can be found in a recent research paper by the Australian Financial Services Council, which was prepared by Rice Warner, Titled “Future of Advice”.

The paper covers several topics, with the aim of advancing the public policy debate on Australian financial services.  Albeit the Australian focus, there are key learnings for all.

This is an important issue; the personal and broader economic impacts are material.  The benefits of sound financial advice should be championed more widely.

In addition to analysing the current landscape for Financial Advice within Australia the report covers:

  • The need for Advice, and size of the Australian market
  • The Value of Advice, both tangible and intangible benefits
  • A proposed model which seeks simplification, affordability, accessibility and quality of Advice.

I may Post some of the other topics, this short Post focusses on the Value of Financial Advice.

The Value of Financial Advice

In summary, Rice Warner conclude: “We show that people who receive advice are generally happier, with an improved peace of mind.

On a macro level, we set out that advice leads to higher wealth which in turn leads to lower dependency on government benefits such as the Age Pension.”

The Australian Age Pension is designed to provide income support to older Australians who need it, while encouraging pensioners to maximise their overall incomes. The Age Pension is paid to people who meet age and residency requirements, subject to a means test.

Rice Warner divide the benefits of Financial Advice into two categories for the individual:

  • Quantifiable financial benefits – Tangible Value
  • Intangible value – the non-quantifiable and non-financial benefits provided through advice relationships.

They also consider the economic value, the benefits which flow to the broader economy, through greater use of Financial Advice.

Tangible Benefits

Firstly Rice Warner note the plethora of pre-existing research on the benefits of Financial Advice, they provide the following examples:

  • Russell Investments estimated in 2018 that a full suite of adviser services could be worth up to 3% per annum to an investor.
  • The FSC estimated in 20117 that the provision of savings advice would lead to an individual being between $29,000 and $91,000 better off at the point of retirement. In this research individuals who received advice at a young age received greater value.
  • Survey-based research conducted in 2014 demonstrated that investors who received advice over: – Four to six years accumulated 60% more assets than those individuals who had no advice. – Periods exceeding 15 years accumulated 290% more assets than other comparable households.

They also undertook their own analysis, considering three levels of advice: No Advice; Advice where additional contributions to super and additional personal wealth savings; Asset Allocation Advice (advice in relation to Super Fund only).

They also considered five different member profiles, based on age and level of starting wealth.

They concluded:

  • For average Australians, advice will likely add value to both an individual’s superannuation and their personal wealth. For most, this value will be greatest in the personal wealth component of their wealth portfolio due to the strong existing default structures within superannuation in Australia.
  • Asset allocation advice provides the greatest cumulative increase in funds at retirement when this advice is taken at younger ages. This is because younger individuals have a greater investment period over which to compound the benefits of higher rates of return.
  • Irrespective of level of wealth, for an individual aged 40, approximately half the value of the full advice scenario is derived from simple advice in respect of savings.
  • Individuals who occupy low socio-economic wealth bands are expected to gain more from advice than those who are wealthy. This reflects the tendency of these individuals to: – Save less of their disposable income (in proportional terms). – Allocate assets to safe but low-yielding asset classes (such as Cash and Term Deposits).

The implications of this analysis is that those who seek Financial Advice will likely have a higher level of wealth at the point of retirement.

Rice Warner’s results “suggest that taking limited advice on specific elements of one’s financial situation can lead to material benefits. For example, taking advice on savings, or the construction of portfolios for an individual’s private wealth.”

Intangible Benefits

Rice Warner sum it up succinctly “Financial Advice can maximise the upside, and limit and minimise the downside, of financial decisions. However, simply focusing on a potential monetary value-add ignores other aspects such as the comfort of being secure. We also need to consider the behavioural aspects of consumer decision making in respect of advice. Their perceived need for advice is what drives the market. Consumers need to have a recognition of the need for advice, a willingness to engage with advisers and a willingness to pay. Their willingness to engage will depend on their perception of the potential for favourable outcomes, but it will also depend on their perception of risk – and the cost.”

Ricer Warner note the intangible benefits of Financial Advice include:

  • People who are advised have greater levels of overall happiness.
  •  People who are advised have greater piece of mind.
  • Taking advice can lead to improved relationships due to the alleviation of money-related issues.
  • People who are advised may have better health.

I have re-created the following Table from their report which outlines the research that supports these benefits.

AreaPaperFinding
Greater levels of happinessIOOF white paperIndividuals who are advised have 13% greater levels of overall personal happiness than non-advised individuals.
Greater levels of happinessAdvice and Limited Advice Report by Investment TrendsAcross individuals who use a financial planner as their main source of advice:  87% said their adviser made a positive or significantly positive difference to their life. 89% said their most recent discussion with their financial planner was valuable or very valuable.
Improved peace of mindIOOF white paperSurveys of advised clients suggested that advice lead to: 21% more peace of mind with regards to their financial future. 20% increased feelings of security regarding their day to day finances.
Improved peace of mindMLC Wealth Submission – RIRSurveys of advised clients suggested that advice lead to: 79.4% of clients being instilled with improved peace of mind. 81.5% of clients feeling that Financial Advice has left them more confident about making decisions
Improved RelationshipsIOOF white paperSurveys of advised clients suggested that advice led to: 19% less likely to have arguments with loved ones about money.21% less likely to have their personal relationships impacted due to concerns about money
Improved healthIOOF white paperConsumers who do not receive professional ongoing advice are 22 per cent more likely to have their sleep disrupted due to concerns about money than non-advised clients.

The Rice Warner report can be found here.

New Zealand Experience

In New Zealand the Financial Services Council has conducted research into the value of Financial Advice: “The good news is, the value of advice does clearly outweigh the cost. Those who are advised are delivered a 4% increase in investment returns, about 52% more in their KiwiSaver and save 3.7% more for their retirement than those who are unadvised.

Their report can be found here.  And is also covered in this article by NZ Adviser online.

Please read my Disclosure Statement

Global Investment Ideas from New Zealand. Building more Robust Investment Portfolios.

Source Agile Finance Radio


Thinking of the Upside – Dream a Little – Promoted New Zealand as a Tourist Destination – Tongariro Alpine Crossing

With the roll out of the covid-19 vaccine started around the world, it is time to think about the upside…… and to start dreaming a little.

Over the next few months, I would like to help promote New Zealand as a great destination to visit once international travel recommences (hopefully within the next year).  We live in a wonderful, clean, and diverse country.

This is a departure from what is an Investment focused Blog (which I will do occasionally and have done in the past).

Investment related Posts will continue uninterrupted however.

For my offshore followers start planning a trip down under, dream a little.  It would be great to see you.

For those here in New Zealand, as you will know, it is a great to time to see New Zealand and support the local tourism industry, as many of you have been this summer.

Tongariro Alpine Crossing

The Tongariro Alpine Crossing is one of New Zealand’s, if not the worlds, most popular one day walks.

The landscape and scenery are very different to other parts of New Zealand, as you will see from future Posts.

For more information on the Tongariro Alpine Crossing and the Tongariro National Park see below.

The crossing is a short, on average 6-8 hours, walk through a volcanic landscape, including crossing large craters and calderas, seeing emerald lakes, steam rising from mountain sides, and the smell of sulphur (luckily not for long!).  The track covers 19.4km (12 mile).

Photo below, starting out, looking up toward Mt Ngauruhoe, elevation 2,291m (7,516 ft).  Mount Ngauruhoe – Wikipedia

It may look familiar to Lord of the Rings fans, Mount Doom.

Photo below is looking back toward the start of the track at the Mangatepopo Carpark, which is at a 1,120m elevation. 

The track climes the Mangatepopo valley to the saddle between Mount Tongariro and Mount Ngauruhoe.

The highest point on the track is at the Red Crater, see below, at 1,886m. The trek finishes at the Ketetahi carpark, 750m elevation – overall you do more down hill than up hill!

Below, views on the way up! Spectacular, an old lava field.

Views near the top, looking toward the South Island.

Can almost touch it and near the half way point, after crossing the south crater.

Landscape and views from near the top. Red Crater, big photo below.

Views of the Blue lake (in the distance) and first sighting of the Emerald Lakes (smaller photo on right below).

And the Emerald Lakes, strong smell of sulphur here.

Heading down, after crossing the central crater and walking alongside the Blue Lake.  In the photo below Lake Taupo is in the distance.  Lake Rotoaira is the small lake in the foreground.

Background Tongariro Alpine Crossing

As mentioned above, the Crossing is 19.4km trek.  

It is a point to point hike, there are several companies that provide shuttle services to make your day easier.

They will pick you up in National Park (small town nearby), dropping you off at Mangatepopo carpark, start of walk, collect you at the end of the days walk from the Ketetahi carpark, and return you to National Park. A very good service.

For further information on Tongariro Alpine Crossing, Tongariro Alpine Crossing Track | National Park | Walks & Hiking | Shuttle | World Heritage (tongarirocrossing.org.nz)

and

Tongariro Alpine Crossing Summer brochure (doc.govt.nz)

The Tongariro Alpine Crossing is situated in the Tongariro National Park.

Tongariro became a National Park in 1887 and boasts dual World Heritage status.  It is New Zealand’s oldest National Park.

In 1990 the Park was recognised as a World Heritage Site for its outstanding natural values.

In 1993, Tongariro National Park became the first place in the world to be listed as a World Heritage Site for the spiritual and cultural values the landscape possesses for the indigenous people in the area.

The Park includes three active volcanoes Tongariro, Ngauruhoe and Ruapehu.

For more information: Tongariro National Park – Wikipedia

I hope you get to visit the Tongariro National Park, the surrounding towns, landmarks, attractions, and have time to complete the Tongariro Alpine Crossing. Please read up on the crossing and prepare accordingly. It is an alpine crossing and caution should be taken, a watchful eye on the weather is particularly important.

My 13 year old son and I completed the crossing in 4hrs, 40 minutes, including the odd stop and a lunch break. Teenage boys tend to be in a hurry!

Please read my Disclosure Statement


Global Investment Ideas from New Zealand. Building more Robust Investment Portfolios.

Most read Kiwi Investor Blog Posts in 2020

The most read Kiwi Investor Blog Posts in 2020 have been relevant to the current environment facing investors.  They have also focused on building more robust portfolios.

The ultra-low interest rate environment and sobering low return forecasts present a bleak outlook for the Traditional Balanced Portfolio (60% Equities and 40% Fixed Income.)  This outlook for the Balanced Portfolio was a developing theme in 2020, which gained greater prominence as the year progressed.

In essence, there are two themes that present a challenge for the Traditional Balanced Portfolio in the years ahead:

  1. That fixed income and equities (mainly US equities) are expensive, so now may not be a great time to invest too heavily in these markets; and
  2. With interest rates at very low levels, there is increasing doubt that fixed income can still effectively protect equity portfolios in a severe market decline in ways they have done historically.

My highest read Posts address the second theme above.

The Balance Portfolio has served investors well in recent years.  Although equities and fixed income still have a role to play in the future, there is more that can be done.

The most read Kiwi Investor Blog Posts outline strategies that are “more that can be done”.

I have no doubt investors are going to have to look for alternative sources of returns and new asset classes outside equities and fixed income over the years ahead.  In addition, investors will need to prepare for a period of higher inflation. 

Not only will this help in increasing the odds of meeting investment return objectives; it will also help protect portfolios in periods of severe sharemarket declines, thus reducing portfolio volatility.

The best way to manage periods of severe sharemarket declines, as experienced in the first quarter of 2020, is to have a diversified portfolio.  It is impossible to time these episodes.

Arguably the most prudent course of action for an investor to pursue in the years ahead is to take advantage of modern investment strategies that deliver portfolio diversification benefits and to employ more advanced portfolio construction techniques.  Both of which have been successfully implemented by large institutional investors for many years.

From my perspective, maintaining an array of diversification strategies is preferred, investors should diversify their diversifiers.

The most read Kiwi Investor Blog Posts in 2020 were:

Posts closely following were Understanding the impact of Volatility on your Portfolio and Optimal Private Equity Allocation.

Thank you all for you continued support and all the best for the year ahead.

Please read my Disclosure Statement


Global Investment Ideas from New Zealand. Building more Robust Investment Portfolios.

Monthly Financial Markets Commentary and Performance– December 2020

The latest monthly commentary, for March 2021, can be found here.

Cautious Optimism

  • Caution optimism prevailed across markets and economies as the global annus horribilis ended.  Wishing you all an annus mirabilis for 2021 (a wonderful year).
  • Global markets finished the year buoyed by the commencement of the Covid-19 vaccines roll out, ultra-low interest rates, and finally a new US government spending package.
  • Global equities climbed 4.9% in December and are 16.9% higher than at the end of 2019.  Who would have thought that was possible after the near 30% declines earlier in the year? 
  • The US sharemarket ended the year at historical highs.  The S&P500 returned 18.4% in 2020 and is almost 70.0% higher from its yearly lows in late March.
  • The New Zealand sharemarket also finished the year strongly, rising 5.5% in December, returning 14.7% in 2020.  This is the Index’s ninth consecutive year of positive returns.  The benchmark has more than quadrupled since the end of 2011, and more than doubled since 2015! (benchmark returns are based on S&P Dow Jones Index data).
  • The Australian sharemarket returned 1.2% in December, eking out 1.4% for the year.  The Information Technology sector posted a 9.5% gain in December and 57.8% for the twelve months period.  The energy sector lost 27.6% for the year, and utilities fell 16.7% over the same period. These sector relative performance outcomes have been experienced internationally, along with the momentum and growth factors outperforming value over the last twelve months.  Although growth and momentum outperformed value in December they have trailed value over the last three months of 2020.  In Australia, value returned 18.1% over the last quarter of 2020, momentum and growth returned 7.8% and 10.1% respectively.
  • The V shape economic recovery is well on track around the world.  The New Zealand economy expanded a stronger than expected 14% in the third quarter of 2020.  This follows a historical 11% contraction in the second quarter.  The economy is 2.2% smaller compared to a year ago.  Construction and retail trade led the recovery following the second quarter lockdown.  As the Kiwi Bank economics team highlighted, 95% of New Zealand’s economy is doing well, but the other 5%, primarily the tourism and education sectors, are not, and we should spare a thought for them.  The peak over the Kiwi summer period, December – March, will be a test for them. 
  • As mentioned above, the USA has instigated additional government spending to combat COVID-19.  The relief package is worth around $900 billion, 4% of the economy.  It was larger than many expected and includes $600 personal payments to most Americans, along with additional unemployment benefits, and further support for businesses.  This package should help to support US economic activity over the first quarter of 2021.
  • Japan also announced additional economic stimulus measures in early December, this includes around 30 trillion Yen in additional spending to prevent the spread of COVID-19, transform the economy post the pandemic, and enhance infrastructure.  The Japanese economy grew 5.3% in the July – September period, after declining 8.3% in the second quarter.
  • Chinese industrial profits have grown 15% over the last year and exports are booming.  Over the twelve months ending November Chinese exports have grown 21%, the highest level of annual growth in almost 10 years. 
  • European manufacturing activity has been stronger than expected, suggesting fourth quarter economic activity is going to be higher than anticipated. 
  • Likewise, US manufacturing has been resilient at a time of rising COVID-19 cases.
  • In Australia, Consumer sentiment has reached its highest level in 10 years.
  • The UK and Europe have agreed on a post-Brexit Free Trade Agreement that will result in zero tariffs and quotas on goods that comply with rules of origin.  Terms on trade in services have also been reached, which are flexible reflecting the closeness of business activities.

The Year ahead

  • Although economic activity is expected to moderate in the fourth quarter of 2020, given rising COVID-19 cases, complicated by the northern hemisphere winter, consensus expectations are for just over 5% global economic growth in 2021, led higher by Europe, UK, China, and India.
  • After a sluggish start to the year the global economy should accelerate due to the rollout of the vaccines, and mass immunisation reduces the virus threat, the continued accommodative central bank policy settings of ultra-low interest rates, and government spending packages.
  • More than 12 million vaccine doses have been administrated in 30 countries so far.  Israel is leading with 10.5% of their population vaccinated.  America has given out 4.3 million doses, 1.3% of their population.  A World Health Organisation linked plan is in place to administer 2 billion vaccine doses globally in the first half of 2021.
  • The US Federal Reserve’s (Fed) adoption of a flexible average inflation targeting will see global interest rates remain low for some time.  The Fed is not expected to raise interest rates until 2025.
  • In this environment, global equities are more than likely to outperform in the year ahead, global bond yields rise moderately, and the US dollar weakens further.  Emerging markets are well placed in this environment, the value factor will benefit from greater economic certainty in 2021, and commodities such as oil may also find greater support.
  • In America, Georgia Senate run-off elections in mid-January provide a short-term focal point for markets.  The result will determine control of the US Senate.  A switch to a Democratic party-controlled Senate will likely see changes to US tax policies in the months ahead.
  • Inflation, although anticipated not to be an issue over the next few years, will become more of a threat in later years. 
  • Investors should prepare themselves for the risk of higher inflation as outlined in these Kiwi Investor Blog Posts: Preparing your Portfolio for a period of higher inflation and Asset Allocations decisions for the conundrum of inflation or deflation


Source: Man

Please read my Disclosure Statement

Global Investment Ideas from New Zealand. Building more Robust Investment Portfolios.

Investment strategies for the year(s) ahead – how to add value to a portfolio

At this time of the year there are a plethora of economic and market forecasts for next year.  This Post is not one of them.

Outlined below are several investment strategies investors should consider in building more robust portfolios for the years ahead and to increase the odds of meeting their investment objectives.

These strategies directly address the current investment environment and the developing theme over 2020 that the traditional Balanced portfolio, of 60% equities and 40% fixed income, is facing several head winds, and likely to disappoint from a return perspective in the decade ahead.

A recent FT article captures this mood, titled: Investors wonder if the 60/40 portfolio has a future | Financial Times

In the article they make the following comment “The traditional 60/40 portfolio — the mix of equities and bonds that has been a mainstay of investment strategy for decades — is at risk of becoming obsolete as some investors predict years of underperformance by both its component parts.”

I first Posted about the potential demise of the Balanced Portfolio in 2019, see here, and again in early 2020, see here.   These Posts provide background as too why many investment professionals are questioning the likely robustness of the Balance Portfolio in the years ahead given the current investment environment.

In essence, there are two themes presented for the bleak outlook for the Balanced Portfolio.

The first is that fixed income and equities (mainly US equities) are expensive, so now may not be a great time to invest in these markets.

The second theme is that with interest rates at very low levels, there is doubt that fixed income can still effectively protect equity portfolios in a severe market decline in ways they have done historically.

For more on the low expected return environment, first Theme, see these Posts here and here.  This Post also outlines that although markets fell sharply in March 2020, forecast future returns remain disappointing.

The strategies discussed below address the second theme, the expected reduced effectiveness of fixed income to protect the Balance Portfolio at the time of severe sharemarket declines.

The Balance Portfolio has served investors well.  Although equities and fixed income still have a role to play in the future, there is more that can be done.

The strategies outlined below are “the more that can be done“, they aim to improve the risk and return outcomes for the Balance Portfolio in the years ahead.

For the record, I anticipate the global economy to continue to repair next year, experiencing above average growth fuelled by the roll out of the Covid-19 vaccines and underpinned by extraordinary low interest rates and generous government spending programs.  Global equities will continue to perform well in this environment, the US dollar will weaken further, commodity prices will move higher, value and emerging markets to outperform.

The Case for holding Government Bonds

Before looking at some of the strategies to improve on the Balance Portfolio, it goes without saying there is a role for equities in most portfolios.  The case for and against US equities are found here and here respectively.

There is also a role for holding Fixed Income securities, primarily government bonds.

This Post reviews some of the reasons why owning government bonds makes good sense in today’s investment and economic climate. It also brings some balance to present discussions around fixed income and the points within should be considered when determining portfolio allocations in the current market environment.

The central argument for holding government bonds within a portfolio: Government bonds are the only asset where you know with absolute certainty the amount of income you will get over its life and how much it will be worth on maturity. For most other assets, you will only ever know the true return in arrears.

In a recent Financial Times article PIMCO argues the case for the 60/40 portfolio in equities and fixed income.   

In relation to fixed income they argue, that although “returns over the horizon may be harder to achieve, but bonds will still play a very important role in portfolios”.  The benefits being diversification and moderation of portfolio volatility.

However, they argue in relation to fixed income investors must target specific regions and parts of the yield curve (different maturity dates) to maximise return and diversification potential.

PIMCO see opportunities in high-quality assets such as mortgage-backed securities from US government agencies, areas of AA and AAA rated investment-grade corporate bonds, and emerging market debt that is currency hedged.

They conclude: “One answer for 60/40 portfolio investors is to divide fixed-income investments into two subcomponents — hedging and yield assets.”

Rethinking the “40” in the 60/40 Portfolio

This Post outlines a thinkadvisor.com article which provides a framework to consider potential investment ideas in the current extremely low interest rate environment, by examining the 40% fixed income allocation within the 60/40 Portfolio (Balanced Portfolio).

The basis of the article is that investors seeking to generate higher returns are going to have to look for new sources of income, allocate to new asset classes, and potentially take on more risk. This likely involves investing into a broader array of fixed income securities, dividend-paying equities, and alternatives, such as real assets and private credit.

The Role of Liquid Alternatives and Hedge Funds

I have no doubt investors are going to have to look for alternative sources of returns and new asset classes outside equities and fixed income over the next decade.

Not only will this help in increasing the odds of meeting investment objectives, but it will also help protect portfolios in periods of severe sharemarket declines, thus reducing portfolio volatility, a role traditionally played by fixed income within a multi-asset portfolio.

The best way to manage periods of severe sharemarket declines, as experienced in the first quarter of 2020, is to have a diversified portfolio.  It is impossible to time these episodes.

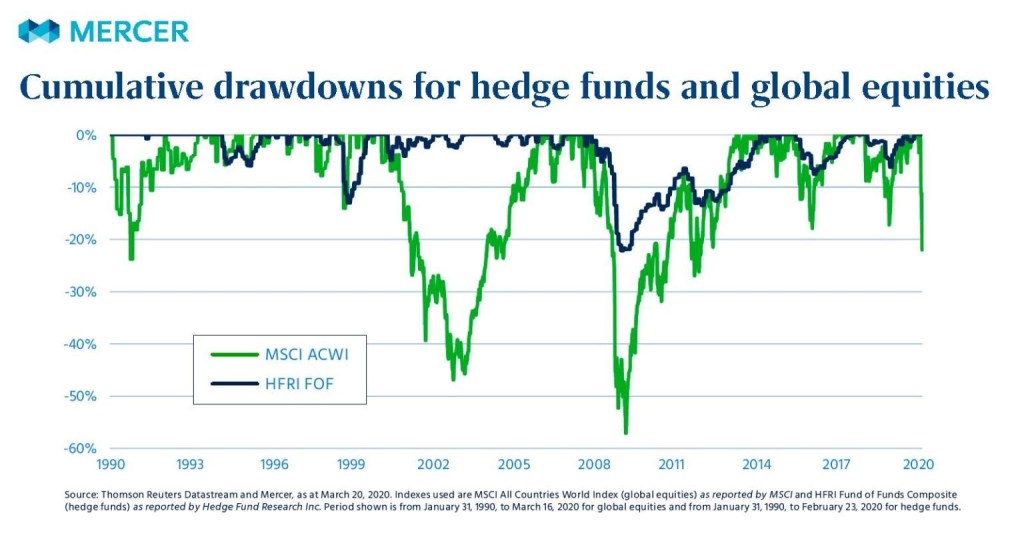
AQR has evaluated the effectiveness of diversifying investments during market drawdowns.

They recommend adding investments that make money on average and have a low correlation to equities i.e. liquid alternatives and hedge fund type strategies. 

AQR argue diversification should be true in both normal times and when most needed: during tough periods for equities.  Although “hedges”, e.g. Gold, may make money at times of sharemarket crashes, there is a cost, they tend to do worse on average over the longer term.

Alternative investments are more compelling relative to the traditional asset classes in diversifying a portfolio, they provide the benefits of diversification and have higher returns.

Lastly, Portfolio diversification involves adding new “risks” to a portfolio, this can be hard to comprehend.  Diversification can be harder to achieve in practice than in theory.

This Post provides a full summary and access to the AQR article.

The case for Trend (momentum) Strategies

A sub-set of Alternatives and hedge funds is Trend/Momentum.

In this recent article MAN present the benefits of introducing Trend following strategies to the traditional Balanced Portfolio. Man note, “Another element that we believe can be of great help to bond-equity portfolios in the future is time-series momentum, or trend-following.”

Their analysis highlights that adding trend-following results in a significant improvement relation to the Balanced Portfolio, by improving returns, decreases volatility, and reducing the degree of losses when experienced (lower downside risk – drawdowns).

The case for Tail Risk Hedging

The expected reduced diversification benefits of fixed income in a Portfolio is a growing view among many investment professionals.

This presents a very important portfolio construction challenge to address, particularly for those portfolios with high allocations to fixed income.

There are many ways to approach this challenge,

This Post focuses on the case for Tail Risk Hedging.  It also outlines other approaches.

In my mind, investment strategies to address the current portfolio challenge need to be considered. The path taken is likely to be determined by individual circumstances.

Comparing a diversified approach versus Tail Risk Hedging

On this note, the complexity, and different approaches to providing portfolio protection, was highlighted by a twitter spat between Nassim Nicholas Taleb (Tail Risk Hedging) and Cliff Asness (broad Portfolio Diversification) from earlier in the year.

I provide a summary of this debate in Table format accessed in this Post, based on a Bloomberg article. 

Several learnings can be gained from their “discussion”.

Also covered the Post was an article by PIMCO on Hedging for Different Market Scenarios. This provides another perspective and a summary of different strategies and their trade-offs in different market environments.

Not every type of risk-mitigating strategy can be expected to work in every type of market environment.

Therefore, maintaining an array of diversification strategies is preferred “investors should diversify their diversifiers”.

Hedge Funds vs Liquid Alternatives – both bring diversification benefits to a traditional portfolio say Vanguard

Vanguard recently concluded that investors should carefully consider liquid alternatives and hedge funds.

This is a very good article presenting the benefits Alternatives would bring to a Balanced Portfolio.

Their research highlighted that Hedge Funds and Liquid Alternatives both bring portfolio diversification benefits to a traditional portfolio of equities and fixed income.

They suggest that liquid alternatives are often viable options for investors compared to hedge funds.

Although hedge funds and liquid alternatives deliver valuable portfolio diversification benefits, “it is crucial that investors assess funds on a standalone basis, as the benefits from any alternative investment allocation will be dictated by the specific strategy of the manager(s).”

The most important feature in gaining the benefits of hedge funds and liquid alternatives is manager selection.  Implementation is key.

Access to this research can be found here.

Private Equity Characteristics and benefits to a Portfolio

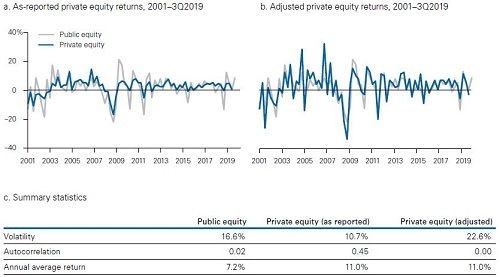
For those investors that can invest into illiquid investments, Private Equity (PE) is an option.

Portfolio analysis, also undertaken by Vanguard, demonstrates that PE can play a significant role in strategic, long-term, diversified portfolios.

PE is illiquid and so must be actively managed, introducing both illiquidity and manager specific risk to a multi-asset portfolio. Conventional asset allocation approaches often omit illiquidity and active risk dimensions from the risk-return trade-off. Therefore, these models do not reflect the unique aspects of PE and tend to over allocate to PE.

Vanguard addresses these issues: outlining four key reasons why the economic returns of private equity are different to those of public equities; highlighting the key risks that need to be accounted for when undertaking portfolio modelling including illiquid assets such as PE; and presenting the adjustments they make to portfolio modelling to address the illiquid features of PE and smoothed nature of historical returns.

This results in more realistic characteristics for PE that can be used for portfolio modelling purposes, reflected in the portfolio allocations generated in the article and the conclusion that PE can play a significant role in strategic, long-term, diversified portfolios.

A review of Vanguard’s analysis and their results can be found in this Post.

Real Assets Offer Real diversification benefits

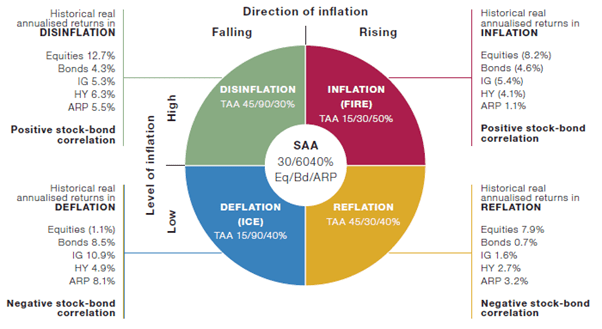
Real assets such as Farmland, Timberland, Infrastructure, Natural Resources, Real Estate, Inflation-linked Bonds, Commodities, and Foreign Currencies offer real diversification benefits to a portfolio of just equities and fixed income.

The benefits of Real Assets are noticeable in different economic environments, like stagflation and stagnation, and particularly for those investment portfolios where objectives are linked to inflation.

These are the conclusions of a recent study by PGIM.

PGIM provide a brief outline of the investment characteristics for several real assets. They then look at the sensitivity of the real assets to economic growth, inflation, equity markets, and fixed income.

They note there is wide diversity in real assets’ sensitivities to inflation and growth, and stocks and bonds. These sensitivities vary over time and are best mitigated by holding a portfolio of real assets.

Therefore, PGIM construct and analyse three real asset strategy portfolios – Diversification, Inflation-Protection and Stagnation-Protection to reach their conclusions.

I provide a detailed summary of the PGIM Report in this Post.

Portfolio Tilts

Adding Emerging Markets and Value tilts to a Portfolio are potential areas to boost future investment returns in what is likely to be a low return environment over the next decade.

Value of Emerging Markets

Emerging markets bring the benefits of diversification into different geographies and asset classes for investors, including both public and private markets.

The case for investing into emerging markets is well documented: a growing share of global economic activity in the years ahead and current attractive valuations underpin the case for considering a higher weighting to emerging markets within portfolios. Particularly considering the low interest rate environment and stretched valuation of the US sharemarket. This is evident in market return forecasts.

Is a Value bias part of the answer in navigating today’s low interest rate environment

Value offers the potential for additional returns relative to the broader sharemarket in the years ahead.

Value is exceptionally cheap, probably the cheapest it has ever been in history, based on several valuation measures and after making adjustments to market indices to try and prove otherwise, such as excluding all Technology, Media, and Telecom Stocks, excluding the largest stocks, and the most expensive stocks.

There is also little evidence to support the common criticisms of value, such as increased share repurchase activity, low interest rates, and rise of intangible assets.

This is not a popular view, and quite likely minority view, given the underperformance of value over the last ten years.

However, the longer-term odds are in favour of maintaining a value tilt and thereby providing a boost to future investment returns in what is likely to be a low return environment over the next decade.

Please see my Disclosure Statement

Global Investment Ideas from New Zealand. Building more Robust Investment Portfolios.

Private Equity characteristics – considerations for Portfolio inclusion

Portfolio analysis undertaken by Vanguard demonstrates that private equity (PE) can play a significant role in strategic, long-term, diversified portfolios.

Vanguard highlight:

  • Although private equity and public equity share some risk and return characteristics, there are key structural differences. (Both have a role to play in a well-diversified and robust portfolio.)
  • Private equity investments are illiquid and so must be actively managed, introducing both illiquidity and manager specific risk to the multi-asset portfolio.
  • Conventional asset allocation approaches such as mean-variance efficient frontiers omit illiquidity and active risk dimensions from the risk-return trade-off.
  • Asset allocation models that do not reflect the unique aspects of PE tend to over allocate to PE and therefore introduce unintended risks into a multi-asset portfolio.

In this Research Paper Vanguard introduce a new portfolio construction framework that accounts for private equity’s risk and return characteristics, Vanguard Asset Allocation Model (VAAM). 

They conclude that there is no single recommended allocation for all investors.  “Private equity allocations depend on each investor’s specific set of circumstances, such as the degree of risk tolerance, including active risk tolerance, and the ability to find and access high-quality managers.”

In allocating to PE investors must carefully consider their willingness and ability to handle a long-term lack of liquidity, constraints on rebalancing, and uncertainty around the timing and size of cash inflows and outflows.

Below is a summary of the Vanguard Research Paper, which also draws on this All About Alpha article by Vanguard.

The Vanguard paper addresses the following three main issues:

  • Complexity in the structure and mechanics of PE that lead to unique sources of risk and return versus public equity investments.
  • Data limitations due to lack of standardized publicly available marked-to-market performance reporting.
  • Lack of portfolio construction frameworks that can appropriately account for PE’s unique characteristics.

Why returns from Private Equity are different to those from Public Equities

For those new to PE the Vanguard paper provides an excellent introduction, including topics such as what is a PE investment, the growth in PE over the last two decades, and how to access PE.

Their discussions on identifying the drivers of PE returns is very good.

Vanguard outline four key reasons why the economic returns of private equity should be different than those of public equity benchmarks:

Liquidity premium.

“Investors in private equity have less ability to trade their investment and do not control the timing or size of cash flows if invested in funds; therefore, they should require compensation in the form of a liquidity premium.”  Returns from the “Liquidity Premium” vary over time.

An important point in relation to liquidity, is that most long-term investors do not need a 100% liquid portfolio.  Most investors over-estimate their liquidity needs (this is not to minimise the importance of portfolio liquidity).

Vanguard note there are two different but related forms of liquidity risk:

  • Market liquidity risk – the ease with which an investment can be traded.
  • Funding liquidity risk – investors must be flexible enough to make contributions quickly and to deal with potential material delays in distributions from the PE funds

Other risk factors

“The average characteristics of private equity companies may be different than those of public companies (for example, industry, size, financial leverage, geography, and valuation).”

There is a large body of research that attempts to estimate the common risk factors of PE, such as size and value.

Vanguard provides results from a sample of academic studies which suggests PE Funds tend to have above market risk (high betas) and a small size tilt.  The research also suggests that buyout funds have a value bias, whereas venture capital funds display a negative value bias.

These are important considerations to contemplate when evaluating the inclusion of PE into a diversified and robust portfolio to minimise unintended risk exposures.

Manager-specific alpha

“Investors accept idiosyncratic manager-specific risk in exchange for the opportunity to generate alpha.”

Vanguard outlined that PE managers look to add value in the following ways:

  • Company selection. In addition to their company selection skills, some managers may have access to certain deals or parts of the market that others may not because of their reputation or skill set.
  • Thematic bets. Managers can choose to focus on secular or structural changes (such as technological, regulatory, and consumer preference) that may not be fully reflected in company valuations today.
  • Governance. PE firms can provide the oversight to help portfolio companies with the likes of strategic planning, conflicts of interest, and remaining focused on competitive advantages.
  • Finance. PE firms provide guidance in optimising capital structures of portfolio companies.
  • Operations. PE firms may have specific sector or industry expertise that can help portfolio companies make key decisions, reduce costs, and identify growth opportunities.

Manager due diligence is always important, in relation to PE investors should understand how a manager seeks to add value, why the manager believes they will be successful, and what success will look like.

Always have a set of expectations as to a manager’s expected performance, these can be both quantitative and qualitative.  Undertake ongoing monitoring and review of the manager relative to these expectations.

As the Vanguard article highlights “David Swensen, the long-time chief investment officer of the Yale University endowment who may be the most well-known evaluator of private equity managers in the world, stresses that qualitative factors (such as people and process) play a central role in manager evaluations.”

All-in costs

Vanguard make the very significant point “Investors care most about performance net of all costs.”

The size and structure of PE fees/costs are materially different to investing into Public markets.  Investors will need to understand these and most importantly assess the likely performance outcome after all fees and charges.

Private Equity Portfolio modelling challenges

Most asset allocation models are built with liquid public assets in mind (e.g. public equities, fixed income, and cash) and assume the portfolio can be rebalanced periodically and with minimum cost.

However, with the introduction of illiquid asset classes, such as PE, there are some fundamental differences that need to be accounted for when undertaking portfolio modelling.

As outlined by Vanguard, these include:

  1. Smoothed (appraisal-based) private equity return estimates: Private equity historical return data have limited holdings transparency and are based on subjective appraisal-based valuations rather than observable, transaction-based prices on a public exchange. Relying solely on appraisal-based values to calculate returns can lead to significant underestimation of the volatility of returns.
  2. Illiquidity and frictionless rebalancing: Investors in private equity have less ability to trade their investment and rebalance their portfolio back to the intended target allocation. For this reason, they should require compensation in the form of a liquidity premium.
  3. Uncertainty in timing and magnitude of cash flows: Because private equity investors cannot control the timing or size of private equity fund cash flows, they incur an additional type of risk.
  4. Illiquidity and valuation adjustment: Private equity fund investments cannot easily be accessed and liquidated unless at a discount to NAV in most cases. This implies that liquid asset prices and private equity fund NAVs are not directly comparable.

Therefore, there are three distinct sources of risk when investing into PE:

  1. Market Risk (Systematic risk) which Public Equities also have, and is best measured via decomposition of risk factors (e.g. value and small cap) that are present in the public markets.  This risk is more accurately estimated after unsmoothing the returns from PE.
  2. Illiquidity factor risk that is unique to private equity and not observed in public markets.
  3. Manager (Idiosyncratic to the manager and unsystematic risk of individual companies) risk for the specific manager(s) selected. This is effectively active risk, with the potential to generate excess returns for the risk taken (which is alpha, a great portfolio diversifier).

Portfolio modelling with the inclusion of Private Equity

One of the key issues to consider when incorporating unlisted assets, such as PE, into a portfolio is the smoothed nature of the historical return data, which reflects appraisal-based valuations.

The use of smoothed historical returns results in an underestimation of return volatility.  The underestimation of volatility could lead to an overallocation to PE when undertaking portfolio modelling.

For portfolio modelling purposes, the true underlying risk profile of PE needs to be understood to make a better assessment when comparing and combining with public market assets.

As Vanguard highlight, several “statistical methods have been proposed in the academic literature over the last few decades to try to better understand historical performance. None of them are without shortcomings, which is why there remains no universally agreed-upon approach among academics or practitioners.”

Vanguard follow a time-series technique to “unsmooth” historically reported PE returns.  For a more in-depth discussion please see the Research Paper.

The adjustment to PE returns is presented in the Table below.  Note how Private Equity (adjusted) volatility is 22.6%, up from 10.7% calculated using reported historical PE returns.

The adjusted PE returns results in a more realistic return profile for PE which can be used for portfolio modelling purposes, resulting in more sensible volatility and covariance estimations.  Note historical PE returns have been preserved, only volatility measures have been adjusted.

In addition to estimating unbiased PE return estimates, as above, Vanguard also undertake the following adjustments to the standard portfolio modelling approach to address the issues identified above:

Account for the illiquidity of PE

Vanguard’s portfolio model, VAAM, drops the assumption of low cost and regular rebalancing assumed in standard portfolio modelling frameworks.  Therefore, they assume that PE can not be fully rebalanced.  As they note, “This illiquidity-constrained rebalance feature provides a more accurate representation of the risk-return trade-offs between liquidity premium and risks associated with private equity assessed within the portfolio optimization.”

Explicitly modelling private equity cash flows

Accounting for the uncertainty in timing and magnitude of PE cashflows Vanguard explicitly model cashflows in a multi-asset portfolio.  As noted above, cash needs to put aside for future committed investments (contributions) and timing of distributions (capital returned) also needs to be accounted for.

It is important to note, this nature of PE leads to additional decision making in the management of a multi-asset portfolio that includes PE i.e. where cash tagged for future PE investment should be invested in the interim and decisions around portfolio rebalancing.

Optional valuation adjustment of the illiquid wealth of the portfolio

Vanguard also make an adjustment for the disparity in market value of liquid and illiquid assets.  This reflects that illiquid assets, such as PE, can at times be sold in a secondary market, which more often than not trades at a discount (i.e. lower price) to asset values.

The discount function they implement “effectively converts illiquid wealth into its liquid equivalent.”

The Results

Compared to a multi-asset portfolio of 70% Equities and 30% Fixed Income (70/30) the key results include:

  • Portfolio modelling that ignores private equity’s illiquid characteristics as covered above leads to a higher allocation in PE compared with Vanguard’s enhanced framework (VAAM)
  • VAAM results in the PE allocation within “Equities” to fall from 50% to 30%
  • The sensitivity to key risk parameters include: expectations the manager will generate lower excess returns results in a lower allocation (12% vs 23%); a “lower risk” manager results in a higher PE allocation (36% vs. 23%)
  • For more conservative portfolios, such as a 30/70, although the total equity allocation decreases, the target PE share of total equity does not change materially relative to that of the 70/30 investor.

Please read my Disclosure Statement

Global Investment Ideas from New Zealand. Building more Robust Investment Portfolios.

Drivers of Unexpected Portfolio Return Outcomes – that should be controlled for.

Six reasons could largely explain manager underperformance or the delivery of investment return outcomes different from what is expected.

Conversely, controlling for these “risks” might be the reason why a Manager is consistently adding value.

How a manager controls for the following risks should be considered as part of the due diligence process and in the construction of a multi-manager portfolio:

  1. Levels of uncompensated vs compensated risk
  2. Incidence of underlying portfolio holdings cancelling each other out
  3. Hidden portfolio risks resulting in unintended outcomes
  4. Conventional style-box investing, which leads to index-like performance with higher fees
  5. Over-diversification
  6. Possible attempts to “time” manager changes may prove costly.

The above six risks where identified by Northern Trust following the analysis of $200 billion of assets on more than 200 equity portfolios from 64 institutional investors around the world.  The results surprised many of the institutions involved. 

Northern Trust expressed the above risks as “six common drivers of unexpected Portfolio Results.”

These risks largely explained manager underperformance in single manager portfolios and also multi-manager portfolios.

The analysis highlights, in my opinion, that implementation and portfolio construction are fundamental to capturing value and in delivering excess returns. Although the investment theory and development of investment strategy are important, implementation and portfolio construction are fundamental.  This is an important area to focus on in undertaking manager/strategy due diligence.

To the point, implementation is vital in capturing the desired investment outcomes of any proposed investment strategy.  This is where a lot of value is added, primarily by not detracted value in implementing the desired strategy!

As Northern Trust emphasis, finding a manager that consistently delivers on their investment objectives is certainly important, but it should not be the only area of focus.  Knowing how a manager, or strategy, interacts with the rest of your portfolio can have much more impact over time.

Institutions had nearly 2x more uncompensated vs compensated risk

Northern Trust found that portfolios which became “overcrowded” with uncompensated risks tended to underperform.

Risk needs to be taken to outperform.  Nevertheless, some risks are compensated for over the longer term and others are not.  Norther Trust outlines that some styles are not compensated for over the longer term, e.g. low quality.  They also include currency, and some countries and sectors have also not historically compensated for the risk taken.

From my own experience, managers who control for some of these risks, tend to outperform, primarily because intended risks, such as company specific risks or compensated styles, end up driving investment outcomes.

Norther Trust found a high level of uncompensated risk across all institutional investment segments, including Super Funds, Endowments, Insurance, Corporate Pensions, and Family Offices.

They conclude: “The result of uncompensated risks comprising nearly 50% of total portfolio active risk was generally benchmark-like returns or underperformance.  While sometimes these risks were taken intentionally, we found that many institutions were surprised when they saw the actual numbers.”

Underlying portfolio holdings cancelled each other out – and hurt performance

This risk particularly impacts multi-manager portfolios.

The cancellation effect occurs when managers within a portfolio take opposing positions that offsets each other e.g. one manager goes overweight a stock another manager is underweight, a manager might have a growth bias which offsets a manager with a value bias.

As Northern Trust note, on a standalone basis many managers individually offer high active risk, once combined with other managers a lot of this active risk is cancelled out.

This needs to be considered in the construction of a multi-manager portfolio. 

Northern Trust conclude: “Our analysis uncovered a shocking amount of this cancellation effect.  Nearly 50% of manager active risk was lost.  Capturing just 50% of targeted active risk, while paying 100% of the manager fees, effectively translates into paying 2x more for each realized basis point of active risk than originally thought.”

Hidden Portfolio risks cause unintended outcomes

Northern Trust found that style tilts contributed 29% of active risk on average.  However, other bets where often introduced into a portfolio unintentionally and led to “unpredictable portfolio outcomes.”

Although some styles are a consistent source of excess returns over time, it was unintended style risks that negatively impacted portfolio performance.

Often, these unintended style risks are included when trying to capture a known rewarded risk e.g. value comes with common unintended style risk exposures of low quality and low momentum.

This means meaningful style exposure is lost.

They conclude: “Our research uncovered that 55% of the portfolios had material style conflicts – caused by the cancellation effect – that introduced exposures different from the managers stated objective.  This introduction of conflicting and unintended style exposures left many portfolios with no material exposure to their intended style tilts.”

Conventional style investing led to index like performance with higher fees

This is probably self-evident to many, particularly given the above research conclusions.

Northern Trust found that those portfolios based on conventional style analysis, and those of a core-satellite approach, tended to suffer more from the cancellation effect.

The “style box” approach portfolio was more likely to have managers who took opposing views or two managers where hired to generate an exposure one manager alone could achieve.

As a result, “conventional style investing, whether intentional or not, created a mix of managers that closely mimicked the benchmark and left little chance to outperform.”

Over-diversification diluted performance

The Northern Trust research highlights than “hiring too many managers or building equity portfolios with thousand of securities took a significant toll on performance.”

Obviously, adding managers and combination of strategies can reduce overall portfolio risk, Northern Trust research showed that often the risks reduced where different to what was intended.

Norther Trust conclude: “While there are many approaches to generating excess returns, our research suggests that a greater focus on eliminating uncompensated risks is a critical first step toward potentially increasing a portfolio’s ability to outperform.”

Possible attempts to “time” manager changes may prove costly

Do not chase manager performance.  The Northern Trust research highlighted that historically poor active management performance had resulted in lower allocations to active managers in the following year.  When performance was better, a higher allocation to active managers resulted.

As they conclude: “Finding a manager that consistently delivers on their investment objectives is certainly important, but it should not be the only area of focus.  As evidenced through the preceding discoveries of this report, knowing how a manager will interact with the rest of your portfolio can ultimately be much more impactful over time.”

Access to the Northern Trust Risk Report can be found here.

Please read my Disclosure Statement

Global Investment Ideas from New Zealand. Building more Robust Investment Portfolios.

Monthly Financial Markets Commentary – November 2020

The latest monthly commentary, for January 2021, can be found here.

Vaccine Recovery

  • Risk assets (e.g. equities and commodities) performed strongly in November following encouraging Covid-19 vaccine trial results from Pfizer-BioNTech, AstraZeneca, and Moderna.
  • Global equities returned 13.3% in November, many markets had one of their best monthly returns in several years. Some markets reached historical highs, including New Zealand and the US. European markets outperformed, Spain and Italy returned 28.3% and 26.3% respectively.
  • US Food and Drug Administration (FDA) approval of a Covid-19 vaccine could be as early as 10th December 2020.  Europe is likely to approve a vaccine(s) by the end of the year.
  • A great way to finish a very challenging year.
  • Expectations are for widespread vaccinations in the US by April 2021, high-risk individuals will receive the vaccine earlier, as early as mid-December 2020.
  • Likewise, it is anticipated large proportions of the population in the UK, European Union, Japan, and Australia will be vaccinated by May 2021.  It is estimated New Zealand will get their first doses of the vaccine in March 2021.
  • In addition to the widespread public health benefits, global economic activity is expected to pick up in the second quarter of 2021, underpinning the V(accine)-Shaped Recovery, as expressed by Goldman Sachs.  They forecast 5% growth in the US over 2021, and 6% for the global economy.
  • In the interim, global economic activity is expected to weaken over the last quarter of 2020 and into the first quarter of 2021 due to the rise in Covid-19 cases over the last couple of months in Europe and the US, and as the northern hemisphere heads into the winter months (a high risk period). 
  • There has been a softening of European high-frequency data recently, such as truck milage data in Germany, UK retail sales, and cinemas and restaurants have witnessed declining revenues due to the tightening of lockdown measures.  Although less severe than actions undertaken in Europe, State and Local restrictions have increased in the USA.
  • The outcome of the US elections buoyed markets at the beginning of the month.  Although Biden has been elected the 46th President of the United States of America, congress will likely remain divided.  A divided government means regulatory risks have decline, taxes are likely to remain lower, some pro-business policies will remain in place, and government spending to be less relative to the Blue wave outcome.  A $1 trillion dollar US Government stimulus package is now expected, less than half of what was previously anticipated.
  • Recent US earnings have also surprised on the upside, supporting markets, as US companies managed to maintain profit margins better than expected despite the large hit to revenues.
  • November was characterised by a “pro-cyclical” trade, where those stocks that have lagged the market for some time and will benefit more from an opening of economies outperformed.  From a sector perspective Energy, Financials, and Consumer Discretionary performed well.  The “Covid” trade sectors, Consumer Staples, Healthcare, and Utilities lagged the broader market.  Likewise, value and high beta stocks outperformed, low volatility, momentum, and growth underperformed – this will be reflected in relative manager performance in November.
  • In other asset classes, commodities returned 8.6% in November, crude oil was up 25.7%, surpassing pre-covid-19 highs, and gold fell -5.6%.
  • Fixed income performed well, particularly corporate credit and high yield, both returning over 3% in the US.
  • Emerging markets equities underperformed developed markets, returning 8.9%.  (above returns based on S&P Index data.)
  • The US dollar continued to weaken over the month.  This saw the New Zealand dollar (Kiwi) trade at a two and half year high versus the Greenback, rising from 66.25 cents to 70.41 cents (+6.3%).  
  • The strength in the Kiwi partly reflects a scaling back of expectations the Reserve Bank of New Zealand (RBNZ) will move the Official Cash Rate (OCR) into negative territory, given rising house prices e.g. house prices in New Zealand’s largest city, Auckland, have risen 10.8% since June averages based on sales by New Zealand’s biggest real estate business, Barfoot and Thompson.
  • Key risks include ongoing uncertainty over transition of power in the US, global economic activity slows more than expected due to recent rise in covid-19 cases, US government stimulus package disappoints, and vaccine roll out is slower than anticipated.
  • Albeit the medium-term outlook for equities is well supported by an eventual roll out of a vaccine and ultra-low interest rates.  Low interest rates are expected to remain in place for some time, the US Federal Reserve is not expected to raise interest rates until 2025.
  • Equities remain attractive relative to bonds.  Although longer-term interest rates are likely to drift higher over the next few years, a significant move higher is unlikely given an absence of inflation.  Therefore, higher interest rates are not expected to be a threat to global equity markets for some time. 

Please read my Disclosure Statement

Global Investment Ideas from New Zealand. Building more Robust Investment Portfolios.