The case against US equities

Extremely high valuations at a time of overwhelming uncertainty sits at the core of the case against US equities.  The US equity market appears to be priced for a perfect outcome. 

For those that demand a margin of safety, there is very little safety margin right now in US equities.

GMO’s James Montier recently outlined the reasons not to be cheerful toward US equities. 

This contrasts with Goldman Sachs 10 reasons why the US equity market will move higher from here, which I covered in my last Post.

In the GMO article it is argued the US sharemarket is priced with too much certainty for a positive outcome.  Nevertheless, with so much uncertainty, such as shape of the economic recovery and effectiveness of efforts in containing further outbreaks of the coronavirus, investors should demand a margin of safety, “wriggle room for bad outcomes if you like”. 

The article concludes there is no margin of safety in the pricing of US stocks today.

In his view, “The U.S. stock market looks increasingly like the hapless Wile E. Coyote, running off the edge of a cliff in pursuit of the pesky Roadrunner but not yet realizing the ground beneath his feet had run out some time ago”.

This view in part reflects that GMO does not fully support the narrative that has primarily driven the recovery in the US stock market over recent months and is expected to provide further support.

The centre of the positive market outlook narrative is the US Federal Reserves’ (Fed) Quantitative Easing program (QE).  QE involves the buying of market securities, leading to an expansion of the Fed’s Balance Sheet.

In short, Montier thinks it is tricky to argue any direct linkage from the Fed’s balance sheet expansion programs to equities.  In previous Fed QE periods longer-term interest rates rose, which is not supportive of equities.  It is also observed, in other parts of the world where interest rates are low, equity markets are not trading on extreme valuations like in the US.

On this he concludes the “Fed-based explanations are at best ex post justifications for the performance of the stock market; at worst they are part of a dangerously incorrect narrative driving sentiment (and prices higher).” 

Further detail is provided below on why he is skeptical of positive market outlook narrative centred around ongoing support for the Fed’s policy.

The article concludes:

“Investing is always about making decisions while under a cloud of uncertainty. It is how one deals with the uncertainty that distinguishes the long-term value-based investors from the rest. Rather than acting as if the uncertainty doesn’t exist (the current fad), the value investor embraces it and demands a margin of safety to reflect the unknown. There is no margin of safety in the pricing of U.S. stocks today. Voltaire observed, “Doubt is not a pleasant condition, but certainty is absurd.” The U.S. stock market appears to be absurd.”

This view is consistent with a “long term value” based investor and has some validity.  From this perspective, the investment rationale provides a counterbalance to Goldman’s 10 reasons.

The counter argument to GMO’s interest rate view is that the fall in interest rates reflects higher private sector savings and easier monetary policy rather than pessimism about growth and corporate earnings.  Reflecting the expansionary polices of both governments and central banks corporate earnings will recover.  Although weaker, the temporary fall in corporate earnings are not in proportion to that implied by lower interest rates.  This means lower interest rates really do justify higher market valuations.

Also, the two contrasting views could be correct, the only difference being a matter of time.

Implementation of investment strategy is key at this juncture in the economic and market cycle, more so than at any time over the last 20 years.

Historical sharemarket movements and over valuation

Since reaching the lows of 23rd March 2020, the U.S. equity market has rallied almost 50% and other world markets nearly 40%.

The movements in markets have been historic from the perspective of both the speed and scale of the market declines and their rebound.

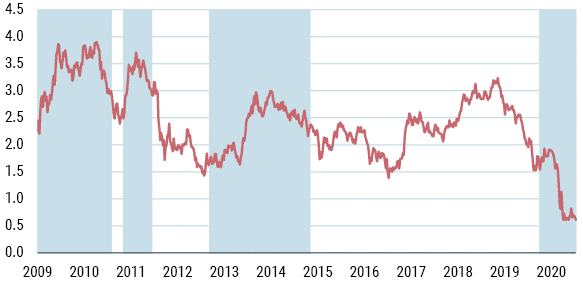
GMO provide the following graph to demonstrate how sharp the fall and rebound by comparing the Covid-19 decline to others in history, as outlined in the following graph they provide:

Source: Global Financial Data, GMO

The sharp rebound in markets has pushed the US markets back up to extreme valuation levels.

The article outlines the following observations:

  • In 1929 the U.S. market P/E was 37% above its long-term average, and earnings relative to 10-year earnings were 46% above their normal level
  • In 2000 the market P/E was 98% above its average, and earnings relative to 10-year average earnings were 37% above their normal level.
  •  

As displayed in the following graph provided, valuations are in the 95th percentile, “right up there in terms of one of the most expensive markets of all time”.

Source: Schiller, GMO

It is clear to see there is very little margin for safety with such high valuation levels set against an uncertainty economic environment.

Accommodative US Federal Reserve Policy

A portion of the GMO article addresses the notion that an expanding Fed Balance Sheet will continue to support US equities.  The notion being that QE lowers interest rates, reducing the discount rate, and therefore drives up stock markets.

James prefers to focus on fundamentals and therefore has several issues with this viewpoint:

  1. He is skeptical of a clear link between interest rates and equity valuations.  As noted, Japan and Europe both have exceptionally low interest rates, but their stock markets are not trading on extreme market valuation like the US.
  2. Interest rates are low because economic growth is low, this needs to be reflected in company valuations.  See the note below, Role of Interest Rates for a fuller explanation.
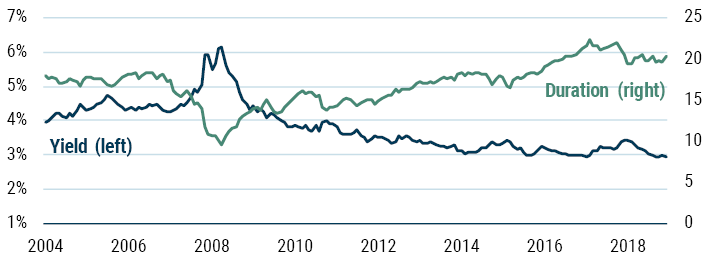
  3. QE hasn’t actually managed to lower interest rates.  As can be seen in the Graph below, all three of the completed cycles of QE have actually ended with interest rates higher than they were when the QE began.
Source: Global Financial Data, GMO

The graph also highlights how low US interest rates are!

A Note on the Role of Interest Rates

The following extract from the Article outlines James’ explanation as to the Role of Interest Rates:

“I am no longer unique in my questioning of the role of interest rates. The good people at AQR Capital released a paper in May 2020 entitled “Value and Interest Rates: Are Rates to Blame for Value’s Torments?” In it they say, “As the risk-free interest rate is one component of the discount rate, when interest rates go up, the discount rate increases and the asset price falls – if everything else stays constant. Hence, if expected cash flows are unchanged and if the risk premium associated with those cash flows is unchanged (where the risk premium is determined by both the amount of risk exposure the cash flows have and the price of aggregate risk to those exposures in the economy), then the formula tells us how prices will change when riskless interest rates change. However, in the case of stocks, these other components rarely stay constant. Changes in real or nominal interest rates are often accompanied by (or are often a response to) changes in expected inflation and/or changes in expected economic growth, and hence expected cashflows are often changing as well. There may also be a change in the required risk premium, which is the other (and often larger) component of the discount rate. All of these components have their own dynamics and are likely simultaneously being affected by macroeconomic conditions in possibly different ways.”

Please see my Disclosure Statement

Global Investment Ideas from New Zealand. Building more Robust Investment Portfolios.

The case for owning equities – 10 reasons why the current bull market has further to run by Goldman Sachs

In what has been an extraordinary year, and despite a sharp bounce back from the sharemarket lows in March 2020, Goldman Sachs (GS) provides 10 strong reasons why they think US equity markets can continue to move higher from here.

GS issued their report earlier this week, 7th September 2020, after last week’s sharp declines. 

Quite rightly they highlight markets are currently susceptible to a pull back given their strong run since earlier in the year.  Nevertheless, over the longer term they think there are good reasons for them to move higher.

GS provide context in relation to the current market environment.

Firstly, the current global recession is unusual, not only to how sudden, sharp, and widespread the recession has been, also that it was not triggered by economic or market factors.  The recession was caused by government actions to restrict economic activity to contain the coronavirus.

Secondly, GS provides analysis as to the characteristics of the bear market (sharemarket fall of greater than 20%) earlier in the year.  They note it was characteristic of an “event driven” bear market (other types include structural and cyclical).  GS note that event driven bear markets typically experience falls of ~30% and are generally shorter in nature.  A sharp fall is often followed by a quick rebound.  They estimate that on average event driven bear markets take 9 months to reach their lows and fully recover within 15 months.  This compares to a structural bear market which take 3-4 years to reach their lows and around 10 years to recover.

See this Post for the history and comprehensive analysis of previous bear markets by Goldman Sachs: What too expect, navigating the current bear market.

GS also see lower returns than historically in the current investment cycle, this is expected across all asset classes.

Reasons why the current bull market has further to run

Goldman Sachs provide 10 reason why the current bull market has further to run.

Below I cover some of their reasons:

  • The market is in the first phase of a new investment cycle.  GS outline four phases of a cycle, hope, growth, optimism, and despair.  They see markets in the phase of hope, the first part of a new cycle.  2019 had the hallmarks of optimism.  The hope phase usually begins when economies are in recession as investors start to anticipate an economic recovery. 
  • The outlook for a vaccine has become more likely.  This is a positive for economic growth.  This combined with the expansionary policies by governments and central banks suggest economies will recover. 
  • The Policy environment is supportive for risk assets, including sharemarkets.
  • GS economists have recently revised up their economic forecasts.  This will likely lead to upward revisions to corporate earnings, which will help drive share prices higher.
  • Their proprietary analysis indicates there is a low level of risk for a new bear market, despite current high valuations.
  • Equities look attractive relative to other assets.  Dividend yields are attractive relative to government bonds and in GS’s view cheap relative to corporate debt, particularly those companies with strong balance sheets.
  • Although higher levels of inflation are not likely in the short/medium term, Equities offer a reasonable hedge to higher inflation expectations.
  • They see the technology sector continuing to dominate as the digital revolution continues to gather pace. They also note that many of the large tech stocks have high levels of cash and strong balance sheets. 

This article by the Financial News provides a good review of Goldman Sachs’ 10 reasons why the current bull market has further to run.

In my last Post I looked at the investment case for holding government bonds and fixed income which might be of interest.

Happy investing.

Please see my Disclosure Statement

Global Investment Ideas from New Zealand. Building more Robust Investment Portfolios.

Why the Balanced Fund is expected to underperform

GMO concluded some time ago the time was right to consider moving away from the 60/40 Portfolio. Which is a “Balanced Portfolio” of 60% equities and 40% fixed income.


In a more recent note, GMO identify two key problems that lie ahead for the Balanced Portfolio, which are supportive of their conclusion. Which I think are problems facing all investors, but particularly for US and New Zealand investors.


First, stock and bond valuations are both extended, suggesting they will deliver less than they have historically.

As GMO point out, the math with fixed income (bonds) is straightforward. The 10-Year U.S. Treasuries yield is under 1% today. New Zealand’s yield is also near 1%.

Today’s yield is the best predicator of future returns.

Real returns, after inflation, will likely be negative over the next 10 years from fixed income.

In short, GMO highlight “It is more or less impossible for a bond index yielding roughly 2% to deliver the 5% nominal returns investors have become accustomed to over any period of time approaching or exceeding the index’s duration.”


GMO also highlight stockmarket valuations have risen. Recent market weakness provides some valuation relief, albeit, US valuations remain elevated relative to history.


GMO conclude, “the passive 60/40 portfolio will likely deliver disappointing returns. The low starting yield of a 60/40 portfolio represents the first problem we see ahead.”


The second issue identified by GMO is that risks within fixed income have risen, and not just from a valuation perspective.

As can be seen in the graph below, provided by GMO, duration is near its highest level in history. (Duration is the key measure of risk for a fixed income portfolio. It measures the sensitivity of a fixed income security’s price movements to changes in interest rates.)

Global duration


So, not only are interest rates at historical lows (low expected returns), but risk, as measured by duration, is amongst highest level in history.


This dynamic, low expected returns and heightened risk highlights the folly of an Index approach, similarly a set and forget approach in allocating to different asset classes. Similar dynamics also play out in sharemarket indices. Risks within markets vary over time.

Furthermore, the credit risk of many fixed income indices is also higher now than compared to the Global Financial Crisis. BBB and AA rated securities currently make up a greater proportion of the fixed income indices. Therefore, the credit quality of these indices has fallen over the last ten years, while the amount of corporate debt has grown. These dynamics need to be considered, preferably before the next credit crisis.


As GMO point out “Today, the sensitivity of a 60/40 portfolio to a change in yield is nearly as high as it has ever been. Both stocks and bonds are levered to future changes in discount and interest rates. Even a small amount of mean reversion upward in the aggregate yield of the 60/40 portfolio will be painful because there is less underlying yield to cushion any capital losses and those capital losses should be expected to be larger than normal for any change in yield given the high duration.”


Because of the higher duration and lower yields, smaller movements higher in interest rates will result in greater capital losses from fixed income securities compared to times when yields were higher. This is also the math.

At the same time, given the high valuation of sharemarkets, they are more susceptible to a movement higher in interest rates. Particularly those sectors of the equity market more sensitive to interest rate movements such as Listed Property.

Therefore, the historical diversification benefits from holding fixed income and equities are likely to less in the future.


GMO conclude “While investors have become conditioned to believe that a 60/40 portfolio delivers consistently strong returns, history shows this has not always been the case and the twin problems weighing on such a construction today suggest robust returns are unlikely going forward. Due to elevated valuations (low yields) and extended durations of both stocks and bonds, it is possible that in a future downturn investors will not receive the diversification they expect from their bond portfolio. Stocks and bonds have risen together and could certainly fall in unison as well.”


Although recent market events may have delayed this moment, they have not derailed the underlying dynamics within a Balanced Portfolio which will see it struggling to meet investor’s expectations over the next decade.  The risks identify above remain.


The Balanced Portfolio is riskier than many appreciate. I covered this in a previous Post. It is not uncommon for the Balanced Portfolio to have a lost decade of returns and losses of up to 30% over a twelve-month period.


Possible Solution

To address the threats to the Balanced Portfolio identified above GMO suggest the inclusion of Liquid Alternatives across multi-asset portfolios.

Such strategies provided portfolio diversification, importantly they have very little duration risk within them, a risk both equities and fixed income are exposed too.

GMO articulate the benefits of such strategies as follows: “Liquid Alternatives can provide diversifying and uncorrelated returns. While Alternatives should not be expected to keep up with robust equity markets, they can help shield large drawdowns given their lower equity beta exposure.”

Liquid alternatives largely generate their return outcomes independently from the returns generated by equity markets (beta) and fixed income market (duration). Thus they provide exposure to different risk and return outcomes from equities and fixed income.

GMO conclude “Liquid alternatives improve the robustness of our multi-asset portfolios by helping to protect against the problems that today’s low yields and high durations present.”


The benefits of such strategies has been evident over the last few weeks, helping to diversify portfolios from the sharp fall in global sharemarkets as a result of the spreading of the coronavirus.


To finish, I would add to the GMO commentary that well diversified portfolios should also have an exposure to Real assets such as Farmland, Timberland, Infrastructure, Natural Resources, Real Estate, TIPS (Inflation Protected Fixed Income Securities), Commodities, Foreign Currencies, and Gold.  These assets offer real diversification benefits relative to equities and fixed income, and to Balanced Portfolio in different macro-economic environments, such as low economic growth, high inflation, stagflation, and stagnation.

I covered the investment characteristics and  benefits of Real Assets to a Balanced Portfolio in different economic environments in a recent Post.


Happy investing.


Please read my Disclosure Statement


Global Investment Ideas from New Zealand. Building more Robust Investment Portfolios.


Sobering low return estimates

AQR has updated their estimates of medium-term (5- to 10-year) expected returns for the major asset classes.

Their expected real return for the traditional U.S. 60/40 portfolio (60% Equities / 40% Bonds) is just 2.4%, around half its long-term average of nearly 5% (since 1900).

It is also down from 2.9% estimated last year.


AQR conclude that medium term expected returns are “sobering low”. Their return estimates are after inflation (real returns) and are compounded per annum returns.

“They suggest that over the next decade, many investors may struggle to meet return objectives anchored to a rosier past”.

“We again emphasize that our return estimates for all asset classes are highly uncertain. The estimates in this report do not in themselves warrant aggressive tactical allocation responses — but they may warrant other kinds of responses. For example, investment objectives may need to be reassessed, even if this necessitates higher contribution rates and lower expected payouts. And the case for diversifying away from traditional equity and term premia is arguably stronger than ever.”


The AQR estimate for a Balance Fund return are similar to those published recently in a CFA Institute article of 3.1%.


AQR update their estimates annually.  They manage over US$186 billion in investment assets.


Return Estimates

Reflecting the strong returns experienced in 2019 across all markets, particularly US equities, future returns estimates are now lower compared to last year.

This is Highlighted in the Table below.

Medium-Term Expected Real Returns

Market

2019 Estimate

2020 Estimate

US Equities

4.3%

4.0%

Non-US Developed Equities

5.1%

4.7%

Emerging Markets

5.4%

5.1%

US 10-year Government Bonds

0.8%

0.0%

Non US-10 Year Government Bonds

-0.3%

-0.6%

US Investment Grade Credit

1.6%

0.9%


Bloomberg have a nice summary of the key results:

  • Anticipated returns for U.S. equities dropped to 4% from 4.3% a year earlier.
  • U.S. Treasuries tracked the move, with AQR predicting buyers will merely break even.
  • Non-U.S. sovereigns slipped deeper into negative territory, with a projected loss of 0.6% a year.
  • Emerging-market equities will lead the way, the firm projects, with a return of 5.1%.


This article by Institutional Investor also provides a good run down of AQR’s latest return estimates.

More detail of return estimates can be found within the following document, which I accessed from LinkedIn.


Lastly, AQR provide the following guidance in relation to the market return estimates:

  • For shorter horizons, returns are largely unpredictable and any predictability has tended to mainly reflect momentum and the macro environment.
  • Our estimates are intended to assist investors with their strategic allocation and planning decisions, and, in particular, with setting appropriate medium-term expectations.
  • They are highly uncertain, and not intended for market timing.


In addition to the CFA Article mentioned above, AQRs estimates are consistent with consensus expected returns I covered in a previous Post.


Although AQR’s guidance to diversify away from traditional equity and fixed income might be like asking a barber whether you need a haircut, surely from a risk management perspective the diversification away from the traditional asset classes should be considered in line with the prudent management of investment portfolios and consistency with industry best practice?

In my Post, Investing in a Challenging Investment Environment, suggested changes to current investment approaches are covered.

Finally, Global Economic and Market outlook provides a shorter term outlook for those interested.


Happy Investing

Please read my Disclosure Statement


Global Investment Ideas from New Zealand. Building more Robust Investment Portfolios.


Global Economic and market outlook

For those looking for a balanced, rational, and insightful view of the global economy and outlook for financial markets, this article is worth reading.


I don’t normally post economic views on Kiwi Investor Blog as they are readily available. The quality of these views can also often be questioned.

It is also easier to find articles of doom and gloom, as they are more often promoted by the mainstream media, they attract more headlines.


This interview with Peter Berezin, of BCA, is the exception to the rule.

BCA’s Chief Global Strategist, Berezin, is not worried about the current weakness of the global industrial sector. If anything, he expects the global economy is going to see a revival in growth over the next few quarters.

As the article outlines “Falling interest rates and the service sector which is cooling but still expanding give Berezin grounds for optimism. He considers the trade dispute to be the greatest risk. But he believes that both the US and China have an interest in reaching a deal before the next US presidential elections.”

“Berezin prefers equities to bonds. In the longer term, he expects painful losses for the latter because central banks underestimate inflation risks……..”

I’ll quickly summarise Berezin’s thoughts below, nevertheless, the article is well worth reading so as to form your own view and to be informed.

In summary Berezin made the following comments and observations:

  • He does not see the global economy heading for a recessions, as noted above if anything, he expects the global economy is going to see a revival in growth over the next few quarters. Financial conditions have eased significantly over the last six months largely due to the decline in government bond yields. Historically, easier financial conditions tended to translate into faster growth.
  • Provided that the trade war doesn’t heat up significantly, the global manufacturing sector is going to rebound later this year. That’s going to drive global growth higher.
  • He does not see any glaring imbalances in the US or globally that gives concern to a recession, noting the private sector globally is a net saver.
  • The trade dispute between the US and China is the biggest risk to his view. China is stimulating their economy.
  • He believes both parties have an incentive to cool things down – Trump so it does not do damage to the economy and his election changes. China – likewise so not to damage their economy, also they don’t like the prospect of negotiating trade if Trump does win the election and also if he doesn’t win the election – the Democrats are likely to be tougher on trade than Trump.


The above provides a taste, the article also covers the outlook for oil, inflation, and risk of regulatory impact on the large US technology companies.


What should investors do?

Berezin recommends investors to overweight equities relative to government bonds over the next 12 months. “Stocks are not particularly cheap, but they are certainly not very expensive either. The MSCI All Country World Index is trading at around 15.5 times forward earnings which is not too bad. Outside the US, stocks are trading at close to 13.5 forward earnings which is actually pretty cheap.”

Looking forward, his preferred regions are away from the US and towards the emerging markets and Europe.  This is subject to a pickup in the global economy.

In relation to Fixed Income (bonds), he sees “an environment in which government bond yields are rising”. This is a negative environment for bonds (as yields rise, bond prices fall).


It is worth noting that 2019 is turning out to be good year for investors, particularly those invested in a “Balanced Portfolio”, 60% Equities and 40% Fixed Income. Global equities have returned around 18% since 31 December 2018, likewise returns on New Zealand and Global Bonds have been around 8-10%. This follows a very hard year in 2018 in which to generate investment returns, with the possible exception of New Zealand equities.

Returns on a one year basis include sharp declines in global equity markets over the final three months of 2018. These negative returns will start to “unwind” out of annual returns so long as equity markets remain at current levels.


Happy investing.

Please read my Disclosure Statement


Global Investment Ideas from New Zealand. Building more Robust Investment Portfolios.

Investing in a Challenging Investment Environment

The Global financial backdrop can be summarised as:

  1. Late Cycle
    • The US economy is into its longest period of uninterrupted growth, it has been over ten years since the Global Financial Crisis (GFC) and the US experiencing a recession.
    • Likewise, the US sharemarket is into it longest period without incurring a 20% or more fall (which would be a bear market).
  2. Exceptionally low interest rates. As you will be aware over $14 trillion of European and Japanese fixed income securities are trading on negative interest rates.
  3. Central Banks around the world are reducing short-term interest. By way of example, the US Federal Reserve has undertaken a mid-cycle adjustment, with more to come, the European Central Bank recently cut interest rates, as has China’s Central Bank. The Reserve Bank of Australia and the Reserve Bank of New Zealand have reduced cash rates very aggressively in recent months. It appears that interest rates will remain lower for longer.
  4. Rising geo-political risk, namely an ongoing and escalating trade dispute between the US and China, while Brexit has a cameo role on the global stage, and there are rising tensions in the middle-east.
  5. Global growth has slowed. The pace of economic activity has slowed around the world, this is most noticeable in Europe, Japan, and China, and is concentrated within the manufacturing sector. The service sectors have largely been unaffected.


Against this backdrop the US sharemarket has outperformed, continually reaching all-time highs, likewise for the New Zealand sharemarket.

Value stocks have underperformed high growth momentum stocks. The performance differential between value and growth is at historical extremes.

Lastly emerging Markets have underperformed the developed world.


A good assessment of the current environment is provided in this article by Byron Wien. It is a must read, Plenty to worry about but not much to do.


It is not all gloom and doom

The US consumer is in very good shape, reflecting record low unemployment, rising wages, and a sound property market. The US consumer is as bigger share of the global economy as is China. Although it is not growing as fast as China, a solid pace of growth is being recorded.

Overall, economic data in the US has beaten expectations over recent weeks (e.g. retail sales).

Globally the manufacturing sectors are expected to recover over the second half of this year, leading to a rebound in global growth. Low interest rates will also help global growth.  Nevertheless, growth will remain modest and inflation absent.

Globally, in most countries, Sharemarket’s dividend yields are higher than interest rates. This means that sharemarkets can fall in value over the next 5-10 years and still outperform fixed income.


How to invest in current environment

Recently there has been #TINA movement: There Is No Alternative to Equities.

Certainly equities have performed strongly on a year to date basis, so have fixed income securities (their value increases as interest rates fall).

The traditional 60/40 portfolio, 60% Equities and 40% Fixed Income, has performed very strongly over the last 6-9 months, this comes after a difficult 2018.

#TINA and the longer term performance of the 60/40 portfolio is covered in this AllAboutAlpha Article, which is well worth reading.

The 60/40 portfolio has performed well over the last 10 years, and has been a strong performer over the longer term.

This performance needs to be put into the context that interest rates have been falling for the last 35 years, this has boosted the returns from the Fixed Income component of the portfolio.  Needless to say, this tail wind may not be so strong in the next 35 years.

This indicates that future returns from a 60/40 portfolio will be lower than those experienced in more recent history.

There are lots of suggestions as to what one should do in the current market environment.  This article on Livewire Markets provides some flavour.

No doubt, you will discuss any concerns you have with your Trusted Advisor.


At a time like this, reflect on the tried and true:

Seek “True” portfolio Diversification

The AllAboutAlpha article references a Presentation by Deutsche Bank that makes “a very compelling case for building a more diversified portfolio across uncorrelated risk premia rather than asset class silos”.

The Presentation emphasises “The only insurance against regime shifts, black swans, the peso problem and drawdowns is to seek out multiple sources of risk premia across a host of asset classes and geographies, designed to harvest different features (value, momentum, illiquidity etc.) of the return generating process, via a large number of small, uncorrelated exposures

The above comments are technical in nature and I will explain below. Albeit, the Presentation is well worth reading: Rethinking Portfolio Construction and Risk Management.


In a nutshell, the above comments are about seeking “true” portfolio diversification.

Portfolio diversification does not come from investing in more and more asset classes i.e. asset class silos. This has diminishing diversification benefits over the longer term and particularly at the time of market crisis e.g. adding global listed property or infrastructure to a multi-asset portfolio that already includes global equities.

True portfolio diversification is achieved by investing in different risk factors (i.e. premia) that drive the asset classes e.g. duration, economic growth, low volatility, value, and growth by way of example.

Investors are compensated for being exposed to a range of different risks. For example, those risks may include market beta (e.g. equities and fixed income), smart beta (e.g. value and momentum factors), alternative and hedge fund risk premia, illiquidity e.g. Private Equity, Direct Property, and unlisted infrastructure. And of course, true alpha from active management, returns that cannot be explained by the risk exposures just outlined. There has been a disaggregation of returns.

US Endowment Funds and Sovereign Wealth Funds have led the charge on true portfolio diversification, along with the heavy investment into alternative investments and factor exposures. They are a model of world best investment management practice.

Therefore, seek true portfolio diversification, this is best way to protect portfolio outcomes and reduce the reliance on sharemarkets and interest rates driving portfolio outcomes.

As the Presentation says, a truly diversified portfolio provides better protection against large market falls and unexpected events i.e. Black Swans.

True diversification leads to a more robust portfolio.

(I have written a number of Post on Alternatives and the expected growth in institutions investing in alternatives globally.)


Customised investment solution

Often the next bit advice is to make sure your investments are consistent with your risk preference.

Although this is important, it is also fundamentally important that the investment portfolio is customised to your investment objectives and takes into consideration a wider range of issues than risk preference and expected returns and volatility from capital markets.

For example, income earned up to and after retirement, assets outside super, legacies, desired standard of living in retirement, and Sequencing Risk (the period of most vulnerability is either side of the retirement age e.g. 65 here in New Zealand).


Think long-term

I think this is a given, and it needs to be balanced with your customised investment objectives as outlined above. Try to see through market noise, don’t over trade and don’t take on more risk to chase returns.

It is all right to do nothing, don’t be compelled to trade, a less traded portfolio is likely more representative of someone taking a longer term view.

Also look to financial planning options to see through difficult market conditions.


There are a lot of Investment Behavioural issues to consider, the idea of the Regret Portfolio approach may resonate, and the Behavioural Tool Kit could be of interest.


AllAboutAlpha has a great tagline: “Seek diversification, education, and know your risk tolerance. Investing is for the long term.”

Kiwiinvestorblog is all about education, it does not provide investment advice nor promote any investment and receives no payments. Please follow the links provided for a greater appreciation of the topic in discussion.


And, please, build robust investment portfolios. As Warren Buffet has said: “Predicting rain doesn’t count. Building arks does.” ………………….. Is your portfolio an all weather portfolio?


Happy investing.

Please see my Disclosure Statement


Global Investment Ideas from New Zealand. Building more Robust Investment Portfolios.


Recessions, inverted yield curves, and Sharemarket returns

Fears of economic recession, particularly in the US, peaked over the final three months of 2018.

Nevertheless, talk of economic recession has now faded into the background after the US Federal Reserve hit the pause button to further interest rate increases in January of 2019. The Fed is not expected to raise interest rates again in 2019.

This is not to say that a recession will not occur, it will at some stage, just as night follows day. The economic/business cycle has not been conquered.

Nevertheless, the timing of the next recession is unknown. Take Australia for example, their last recession was over 28 years ago. New Zealand is over 9 years since their last recession.

With regards to the US, in July of this year the US economy will enter its longest period in history without incurring a recession. Their economy remains on a sound footing: interest rates remain low, the US consumer is confident, businesses are investing, the Government is increasing spending, and forward looking indicators of economic activity remain positive. Lastly, housing activity is likely to pick up over the second half of 2019.


What is a Recession?

A recession is defined as at least two consecutive quarters of declining economic growth. The US National Bureau of Economic Research (NBER) defines a recession as “a significant decline in economic activity spread across the economy, lasting more than a few months, normally visible in real gross domestic product (GDP), real income, employment, industrial production and wholesale-retail sales.”


A recent article by the Capital Group: Preparing for the next recession: 9 things you need to know provides a good overview of the ins-and-outs of economic recession.


The good news, as Capital highlight, recessions generally aren’t very long.

Capital undertook analysis of 10 US economic cycles since 1950. This analysis showed that recessions have lasted between eight and 18 months, with the average spanning about 11 months. Unfortunately New Zealand’s history is a little more chequered than the US.

Investors with a long-term investment horizon, should expect to experience a number recession over their investment horizon and therefore look through the full economic cycle. Fortunately, for most of us, we spend more time in economic expansion than in recession.

Capital note, “over the last 65 years, the U.S. has been in an official recession less than 15% of all months.”

The following graph highlights the average length, total growth, and returns from the average stock market return over the average recession and economic expansion.

Notably, “equity returns can even be positive over the full length of a contraction, since some of the strongest stock rallies have occurred during the late stages of a recession.”

The human cost of economic recession is provided in the form of jobs lost and this should not be forgotten.


Economic cycles Capital.jpg


From a sharemarket perspective, a bear market, defined as a 20% or more fall in value, usually overlaps with recessions.

Share markets tend to lead the economic cycle, given they are forward looking. Sharemarkets on average peak six months prior to the onset of a recession. They continue to fall during the early stages of a recession.

The recovery in sharemarkets often takes hold while the economy is still in recession (economic growth is still contracting).

The initial bounce in sharemarkets is often a period of strong performance and occurs before there is any hard evidence of a pickup in economic activity.

The following graph presents the above sequencing and overlapping nature of sharemarket returns and recessions.

Sharemarket returns and recession cycles.png


Having said all that, stock markets are not good predictors of economic recession i.e. a sharp fall in global sharemarket does not mean there will be an onset of global economic recession.

This is captured by the well know quote from Paul Samuelson: “The stock market has predicted nine of the last five recessions.”


Sharemarket Returns and Inverted Yield Curves

There has been a lot of discussion over the last twelve months about the implications of an inverted US yield curve. (An inverted yield curve is when longer-term interest rates (e.g. 10 years) are lower than shorter-term interest rates (e.g. 2 years or 3 months). A normal yield curve is when longer-term-interest rates are higher than shorter-term-interest rates.

Parts of the US yield curve are currently inverted, and this inversion has increased over recent days.

The significance of this is that prior to the last 7 US recessions the yield curve has inverted prior each time. An inverted yield curve has by and large been a good predictor of recession.

Nevertheless, not every time the yield curve inverts does a recession follow and on average the inversion of the yield curve occurs 12 months prior to a recession.


The following analysis undertaken by Wellington Management looks at the performance of the US sharemarket in relation to yield curves inversions.

The period of analysis is from the 1950s at which time the US Federal Reserve gained full, independent control over interest rates from the US Treasury. As Wellington note, “it was after this transition that the yield curve became an effective tool for gauging the impact of monetary policy on the economy and the prospect of a recession.”

Wellington present the following analysis and the Table below:

  • “As shown in the third column (of Table below), the S&P 500 peaked ahead of a yield-curve inversion only twice (1959 and 1973).
  • “The median time between inversion and peak equity returns was 17 months, and in several cases the market peaked almost two years or more after inversion.”
  • “Aggregate equity returns post-inversion have been partly dependent on the length of time between the initial inversion and the start of the recession.”
  • “Since returns tend to be negative right around the time a recession begins, the instances in which there was a shorter period between the initial inversion and the start of the recession were more likely to have a negative return.”


Just like there is a period of time between economic recession and an inverted yield curve, the sharemarket often peaks after the yield curves inverts.

Sharemarket returns and inverted yield curves.png


Back to the Capital article, for it also runs through a number of other recession related questions.

Of interest are:

What economic indicators can warn of a recession?

  • Capital outline some generally reliable signals worth watching closely, such as an inverted yield curve, corporate profits, unemployment, and leading economic indices.
  • Importantly it is appropriate to look at and consider several different economic indicators.


What Causes Recessions?

  • There are many reasons for a recession, chief amongst them are rising interest rates, particularly by Central Banks such as the US Federal Reserve and Reserve Bank of New Zealand, imbalances within an economy e.g. excess housing prices, high debt levels
  • Every economic cycle is unique, but anything that impacts on corporate profits or consumer spending, such as rising unemployment, are factors to consider.


Just remember is it notoriously difficult to predict economic recession and they are normally the result of a number of factors that have a cascading effect leading to an economic downturn.


The following Kiwi Investor Blog Posts maybe of interest to those wanting a better understanding of inverted yield curves, leading economic indicators, and historical performance of equity market corrections.

Recession predictability of inverted yield curves and other economic indicators to considered:


Analysis of Sharemarket corrections and market declines


Lastly the Capital article provides some suggestions as to how to position your portfolio for a recession. I think it is exceedingly difficult to finesse a portfolio in the expectations of a recession.

From my perspective, the following is most critical:

  • Maintain a long-term perspective;
  • Implement a balanced and broadly diversified portfolio. Portfolio diversification does not come from investing in more and more asset classes. This has diminishing diversification benefits. True portfolio diversification is achieved by investing in different risk factors that drive the asset classes e.g. duration (movements in interest rate), economic growth, low volatility, value, and growth. Investors are compensated for being exposed to a range of different risks;
  • Know you risk tolerance: what level of volatility in capital are you prepared to handle without changing your mind;
  • Understand your risk capacity: the amount of risk you need to take in order to reach your financial goals;
  • Implement a goals-based investment approach, where success is measured on how you are tracking relative to your investment goals, rather than market index performances; and
  • Always maintain a high quality portfolio, with plenty of liquidity, and limit the level of turnover across the portfolio e.g. amount of trading (buying and selling)


A good advisor should be able to help you with the above and see you through bouts of sharemarket volatility, including a recession environment.


Happy investing.


Please see my Disclosure Statement


Global Investment Ideas from New Zealand. Building more Robust Investment Portfolios.

cropped-title-picture-enhanced.jpg

Pioneering work on yield-curve inversions and risk of economic recession

There is no doubt that global economic growth has slowed over the last six months. The Reserve Bank of New Zealand (RBNZ) highlighted rising global economic risks in its recent Policy statement. The RBNZ noted that economic growth has slowed in our major trading partners of Australia, China, and Europe.

Economic growth has also slowed in the US. Although US financial conditions have eased in recent months, they did tightened over the course of 2018.

The risk of a US recession has risen in recent months. Albeit calls of a US recession have been around for some time.

A recent article by Gary Shilling in Think Advisor captures the type of the analysis undertaken on the US economy over the last 18 months.

Leading economic indicators for the US have weakened. Nevertheless, they are not consistent with forecasting a looming recession, except perhaps one, an inverted yield curve which is discussed below.

Overall the US economy is in good health, with record low unemployment, growing incomes, high saving rates, strong household balance sheets, business investment is set to increase, as is Government spending.


As Shilling notes in his article, the US economy could go several ways e.g. economic growth rebounds over 2019, the US experiences a period of prolonged moderate economic growth without a recession, or the US experiences a classic economic cycle and tips into a recession at a later date due to the US Federal Reserve raising interest rates.

By Shilling’s count, there have been 12 occasions since World War 2 that the Fed raising interest rates has resulted in a recession. Presently, this would appear some time away  given the Fed has indicated it is unlikely to undertake further interest rate increases in 2019.

The later scenario is most consistent with the consensus view – it is a little early to call a US recession, yet the risks of a recession within the next 2-3 years are growing. For the time being the US continues to expand and will enter its longest period of economic expansion in modern history in July 2019. Recession will eventually be triggered by the Fed increasing interest rates resulting in a more “garden variety” recession.


And this leads to a key point in Shilling’s article, the word recession invokes images of a Global Financial Crisis (GFC) type outcome – not surprising given this was our last experience.

His expectations are that the next US recession will not be as severe as the GFC.

He has a similar view with respect to the next US “Bear” market (i.e. fall in value of greater than 20%).

I’ll leave it to him to explain:

“Recession” conjures up specters of 2007-2009, the most severe business downturn since the 1930s in which the S&P 500 Index plunged 57 percent from its peak to its trough. The Fed raised its target rate from 1 percent in June 2004 to 5.25 percent in June 2006, but the main event was the financial crisis spawned by the collapse in the vastly-inflated subprime mortgage market.

 Similarly, the central bank increased its policy rate from 4.75 percent in June 1999 to 6.5 percent in May 2000.  Still, the mild 2001 recession that followed was principally driven by the collapse in the late 1990s dot-com bubble that pushed the tech-laden Nasdaq Composite Index down by a whopping 78 percent.

The 1973-1975 recession, the second deepest since the 1930s, resulted from the collapse in the early 1970s inflation hedge buying of excess inventories. That deflated the S&P 500 by 48.2 percent. The federal funds rate hike from 9 percent in February 1974 to 13 percent in July of that year was a minor contributor.

The remaining eight post-World War II recessions were not the result of major financial or economic excesses, but just the normal late economic cycle business and investor overconfidence. The average drop in the S&P 500 was 21.2 percent.


In short, history shows that US sharemarkets drop by about 21% when the economy falls into recession, remembering the S&P 500 fell almost 20% during the last three months of 2018.


Inverted Yield Curve

As you will know, the slower economic growth has resulted in several Central Banks, with the RBNZ the latest, to turn more cautious on the outlook for economic growth and inflation. This list includes the US Federal Reserve, European Central Bank, and Reserve Bank of Australia.

This sudden change in direction of interest rate policy (Monetary Policy) has witnessed a flattening of yield curves (when longer-dated interest rates are at similar level to shorter-term interest rates).

In the US, the yield curve has become inverted, where longer-term interest rates are lower than shorter-term interest rates.

The inversion has primarily been due to the significant reduction in longer-term interest rates rather than the increase in shorter-term interest rates (inversions normally occur when short term interest rates are increased rapidly by Central Banks).

The significance of this is that prior to the last 7 US recessions the yield curve has inverted each time.

Nevertheless, not every time the yield curve inverts does a recession follow and on average the inversion of the yield curve occurs 12 months prior to a recession.


As you can imagine a lot has been written in recent weeks on the implications of a negative yield curve, I would like to highlight the following three articles, which pretty much sums up the current debate:

  1. A very recent interview with the person who undertook in 1986 the pioneering work on yield-curve inversions and their foreshadowing of economic downturns (RA-Conversations)
  2. Mohamed A. El Erain’s article of “Beware of Misreading Inverting Yield Curve “
  3. BCA LinkedIn Post, Yield Curve Inversions and S&P 500 Peaks, don’t get bogged down in the noise.


It would appear, that when it comes to the current inversion of the US yield curve, we have “Nothing to fear but fear itself” (Franklin D. Roosevelt). This is certainly the view of Mohamed A. El Erain.


I have blogged previously on the history of inverted yield curves and their predictive ability. Similar there is also a previous post on the anatomy of equity Bear markets.


Happy investing.


Global Investment Ideas from New Zealand. Building more Robust Investment Portfolios.


Please see my Disclosure Statement

Recent Market volatility and end of year market and economic forecasts

There are lots of economic and market forecasts at this time of the year. Many are easily accessed on the internet.

Does anyone care about these forecasts? Or do we place too much emphasis on these forecast? These topics are covered in a recent Institutional Investor article. Some good points are made.


The current market volatility is likely to be front of mind presently for many investors. Others may be seeing it as an opportunity.  What ever your view of 2019, a longer term perspective should always be maintained.

Either way, it has been a tough year to make money .


Most likely, your view of the current market volatility is closely tied to your forecast for 2019.

On this note, there are number of reasons to be “relaxed” about the current market volatility as outlined in the recent Think Advisor article.


Why should we be relaxed about the current bout of volatility? The most pertinent reasons from the article are as follows:

The US economy is still strong

US Economic growth accelerated in 2018 while the rest of world slowed. Global growth is expected to moderate in 2019 from the current pace in 2018.

Albeit, the US economy is still strong with unemployment at its lowest level since 1969, consumer and business confidence remains healthy, forward looking indicators are supportive of ongoing economic growth.

Although growth is slowing in Europe and China the environment remains supportive of ongoing economic expansion.

Global sharemarkets appear to have already adjusted for a more moderate level of global economic growth in 2019.


Stock Fundamentals are okay

Global corporate earnings are forecast grow over the next twelve months, supported by the economic backdrop outlined above.

As alluded to above, value has appeared in many global markets given recent declines.


Yield curve inversion

Markets are pre-occupied with the possibility of a US inverted yield curve. This appears overdone. Yield curve Inversion is when the yield (rate of interest) is lower on longer dated fixed interest securities compared to shorter dated securities. Under normal circumstance longer dated securities have a higher yield than shorter dated securities.

As highlighted previously  an inverted yield curve is a necessary but not sufficient pre-condition to recession. Not every yield curve inversion is followed by a recession .

There is also a considerable time lag between yield curve inversion and economic recession. A period of time in which sharemarkets have on average performed strongly.

Lastly, the traditional measure of yield curve inversion, 3 month yield vs 10 year yield, is not inverted!


Of the reasons provided in the article, the above are the most relevant and worthy of taking note of.

Nevertheless, global trade is a key source of the current market volatility and is likely to remain so for sometime.  Likewise it may take time for markets to gain comfort that global economic growth has stabilised at a lower rate of expansion. Therefore, continued market volatility is likely.

Alternatively, a pause in the US Federal Reserve raising short term interest rates would also likely provide a boost to global sharemarkets.


PIMCO, as recently reported, highlight that the risk of a recession in the US has climbed in 2019.

This prediction is made in the context that the US is nearing a decade long period of economic expansion, the longest period in its history without experiencing an economic recession (defined as two consecutive quarters of negative economic growth).

PIMCO note “The probability of a U.S. recession over the next 12 months has risen to about 30 percent recently and is thus higher than at any point in this nine-year-old expansion, Even so, the models are flashing orange rather than red.”

“The last few months have given us a sense of the types of risks that are out there, that both the economy and markets are going to face in 2019,” ….. “At a minimum, like we have seen this year, expect ongoing volatility and that’s true across all segments of the financial markets.”


Happy investing.


Please see my Disclosure Statement


Global Investment Ideas from New Zealand. Building more Robust Investment Portfolios.

It has been a tough Year to make Money

2018 has been a tough year in which to make money.

2018 is “The worst time to make money in the markets since 1972” according to a recent Bloomberg article.

“Things have not been this bad since Richard Nixon’s presidency”.

Research undertake by Ned Davis Research, who places markets into eight big asset classes, everything from bonds (Fixed Interest) to US and international stocks and commodities, not one of them is “on track to post a return this year of more than 5%, a phenomenon last observed in 1972”….

As they note, in terms of absolute loses, think Global Financial Crisis (GFC 2007/08), investors have incurred far worst returns in 2018, nevertheless, as far as breadth of asset classes failing to deliver upside returns, “2018 is starting to look historic.”

Nothing has worked this year.  Year to date: global equities are down, as are emerging markets, hedge fund indices, global commodities (even oil), International Credit, Global High Yield, US Fixed Interest, US Inflation Protected Bonds, while Global Aggregate Fixed Interest have eked out a small gain.  Investments into unlisted assets have been more rewarding.


“That’s all but unique in history. Normally when something falls, something else gains. Amid the financial catastrophe of 2008, Treasuries rallied (increased in value). In 1974, commodities were a bright spot. In 2002, it was REITs. In 2018, there’s nowhere to run.”


Outcomes are a little better if you are a New Zealand (NZ) based investor, Cash is on track to return around 2%, 6 month Term Deposits 3.5%, NZ Fixed Interest is up around 4%, and the NZ Sharemarket is currently up 3%.  Still they are all short of 5%.  Meanwhile the recent strength in the NZ dollar has detracted from offshore returns.


It has been a tough year, global equities reached all-time highs in January, fell heavily in February and March, only to recover up to October, with the US Sharemarket reaching a new historical high.

Since October yearly gains have been erased due to a number of factors, some, but not all, of these factors are briefly outlined below.


In short, as highlighted by a recent Barron’s article markets appear to be panicking over everything.

Recent market drivers in brief:

  • Primarily concern for Sharemarkets has been a reduction in global economic growth expectations. Global investor sentiment toward the pace of global economic growth in 2019 has become more cautious over recent months. Global sharemarkets have adjusted accordingly. Albeit, the sharmarket adjustment does appear to be overdone relative to the likely moderating in global growth in 2019, which has also  largely been anticipated.
  • Global Trade concerns continue to negatively impact global markets e.g. Australia and commodities, primarily the ongoing negotiations between the US and China are a source of market volatility and uncertainty.
  • Brexit more recently. The UK are going to have to pay a price for leaving the EU, why? too stop other countries ever considering leaving the EU as a viable option. Unfortunately, while Brexit is an important issue and will be a source of volatility, the negative consequences will largely sit with the UK rather than the rest of the world.
  • There has been considerable oil price volatility, the price of oil fell by over 20% in November.
  • There has also been uncertainty as to likely pace of increases in the Federal Funds Rate by the US Federal Reserve (US Central Bank).


Inverted Yield Curve

Lastly, markets have also latched onto the inversion of the US Yield curve.

Inversion is when the yield (rate of interest) is lower on longer dated fixed interest securities compared to shorter dated securities. Under normal circumstance longer dated securities have a higher yield than shorter dated securities.

An “inverted” yield curve has been useful, though not perfect, in predicting economic recession and equity bear markets (when sharemarkets fall in value of over 20%),


On this occasion the market has focused on the three year security versus the five year security.

Normally, the market focuses on the three month versus the 10 year security as the best predictor of economic recession.  For a further discussion see Risk of Economic Recession and Inverted Yield Curve and US Recession warning. An inverted yield curve is a necessary but not sufficient condition in predicting a recession, and there is often a lag.


As the Barron article highlights: “Since 1965, the three-year yield has been higher than the five-year on seven different occasions. In 1973, the stock market had already sunk into a recession. In the other six instances, the median distance to a recession was 25 months—or more than two years. The S&P 500 went on to gain a median 20% over the 24 months following such an inversion. “Historically, not only have returns tended to be very strong, but the bear market has generally been years away,”


Happy investing.


Please see my Disclosure Statement


Global Investment Ideas from New Zealand. Building more Robust Investment Portfolios.