There has been a lot of discussion recently about the prospect of an inverted US yield curve. (An inverted yield curve is when longer-term interest rates (e.g. 10 years) are lower than shorter-term interest rates (e.g. 2 years or 3 months). A normal yield curve is when longer-term-interest rates are higher than shorter-term-interest rates.
Historically an inverted yield curve is a powerful recession sign. John Williams, who will take over the helm of the New York Federal Reserve Bank of New York in June, said earlier in the year a truly inverted yield curve “is a powerful signal of recessions” that has historically occurred (italics is mine).
The US yield curve spread (difference in yield) between the 2 year and 10 year US Treasury interest rates has recently reached its narrowest in over a decade. Thus the heightened discussion.
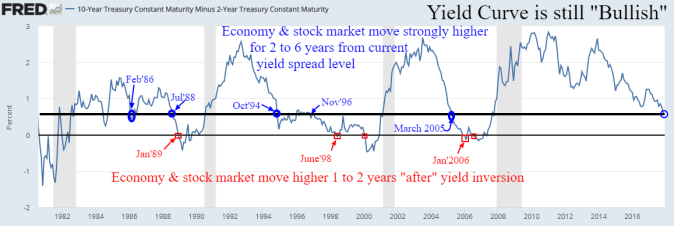
As can be seen in the graph below the US Treasury yield curve inverted before the recessions of 2008, 2000, 1991, and 1981.
It should be noted that the US yield curve has not yet inverted and there is a lag between inversion and recession, on average of 1 to 2 years. See graph below. I am not sure I’d call the Yield Curve still “Bullish” all the same.
At the same time, the risk of recession does not currently appear to be a clear and present danger.
Much of the flattening of the current yield curve (i.e. shorter-term interest rates are close to longer-term interest rates) reflects that the US Federal Reserve has increased shorter-term interest rates by over 150 bpts over the last 2 years and longer-term interest rates remain depressed largely due to technical factors. Albeit, the US 10 year Treasury bond recently trade above 3%, the first time since the start of 2014. Therefore, the current shape of the US yield curve does make some sense.
The picking of recession is obviously critical in determining the likely future performance of the sharemarket.
As a rule, sharemarkets generally enter bear markets, falls of greater than 20%, in the event of a recession.
Nevertheless, while a recession is necessary, it is not sufficient for a sharemarket to enter a bear market.
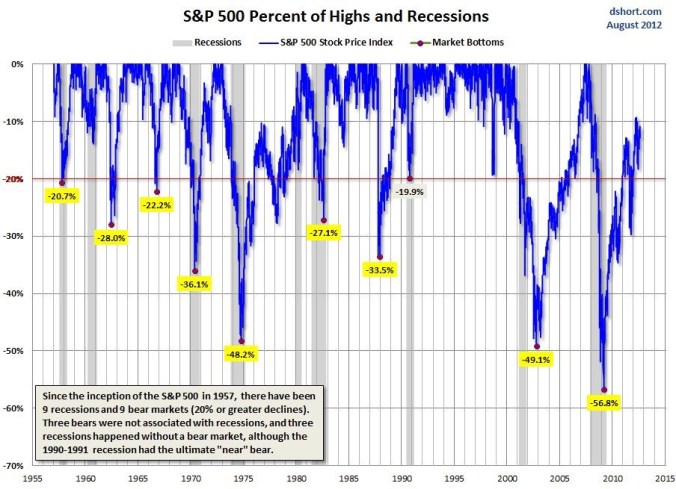
See the graph below, as it notes, since 1957, the S&P 500, a measure of the US sharemarket:
- three bear markets where “not” associated with a recession; and
- three recessions happened without a bear market.
Statistically:
- The average Bull Market period has lasted 8.8 years with an average cumulated total return of 461%.
- The average Bear Market period lasted 1.3 years with an average loss of -41%
- Historically, and on average, equity markets tend not to peak until six months before the start of a recession.
The current US sharemarket bull market passed its 9 year anniversary in March 2018. The accumulated return is over 300%.
Mind you, we have to be careful with averages, I like this quote:
“A stream may have an average depth of five feet, but a traveler wading through it will not make it to the other side if its mid-point is 10 feet deep. Similarly, an overly volatile investing strategy may sink an investor before she gets to reap its anticipated rewards.”
Assessing Recession Risk
Importantly, investors should not use the shape of the yield curve as a sole guide as to the likelihood of a recession.
The key forward looking indicators to monitor include an inverted yield curve, but also a significant widening of high yield credit spreads, rising unemployment, and falling future manufacturing orders.
Tightening of financial conditions is also a key indicator, particularly central banks raising interest rates (or reducing the size of their balance sheet as in the current environment) e.g. US Federal Reserve, but also tightening of lending conditions by the large lenders such as the commercial banks to consumers and more particularly businesses.
Lastly, equity market valuation is important.
Happy investing.
Please see my Disclosure Statement

What the flattening tiles curve may portend is probably the big debate in !markets currently. I don’t profess to have any definitive answers but would note that there has been some debate as to the extent to which the long end of the curve is being depressed by international capital flows from lower yielding countries that are seeking higher US yields. Most short term EU rates remain negative and Japan debt also has negligible yield.
Whether an inverted curve does lead to a downturn reminds me of the old gag about economists having predicted seven of the last three recessions…
LikeLike
Pingback: US Recession Warning Indicators | Kiwi Investor Blog
Pingback: It has been a tough Year to make Money | Kiwi Investor Blog
Pingback: Recent Market volatility and end of year market and economic forecasts | Kiwi Investor Blog
Pingback: Pioneering work on yield-curve inversions and risk of economic recessioni | Kiwi Investor Blog
Pingback: Recessions and Sharemarket returns | Kiwi Investor Blog