Fears of economic recession, particularly in the US, peaked over the final three months of 2018.
Nevertheless, talk of economic recession has now faded into the background after the US Federal Reserve hit the pause button to further interest rate increases in January of 2019. The Fed is not expected to raise interest rates again in 2019.
This is not to say that a recession will not occur, it will at some stage, just as night follows day. The economic/business cycle has not been conquered.
Nevertheless, the timing of the next recession is unknown. Take Australia for example, their last recession was over 28 years ago. New Zealand is over 9 years since their last recession.
With regards to the US, in July of this year the US economy will enter its longest period in history without incurring a recession. Their economy remains on a sound footing: interest rates remain low, the US consumer is confident, businesses are investing, the Government is increasing spending, and forward looking indicators of economic activity remain positive. Lastly, housing activity is likely to pick up over the second half of 2019.
What is a Recession?
A recession is defined as at least two consecutive quarters of declining economic growth. The US National Bureau of Economic Research (NBER) defines a recession as “a significant decline in economic activity spread across the economy, lasting more than a few months, normally visible in real gross domestic product (GDP), real income, employment, industrial production and wholesale-retail sales.”
A recent article by the Capital Group: Preparing for the next recession: 9 things you need to know provides a good overview of the ins-and-outs of economic recession.
The good news, as Capital highlight, recessions generally aren’t very long.
Capital undertook analysis of 10 US economic cycles since 1950. This analysis showed that recessions have lasted between eight and 18 months, with the average spanning about 11 months. Unfortunately New Zealand’s history is a little more chequered than the US.
Investors with a long-term investment horizon, should expect to experience a number recession over their investment horizon and therefore look through the full economic cycle. Fortunately, for most of us, we spend more time in economic expansion than in recession.
Capital note, “over the last 65 years, the U.S. has been in an official recession less than 15% of all months.”
The following graph highlights the average length, total growth, and returns from the average stock market return over the average recession and economic expansion.
Notably, “equity returns can even be positive over the full length of a contraction, since some of the strongest stock rallies have occurred during the late stages of a recession.”
The human cost of economic recession is provided in the form of jobs lost and this should not be forgotten.

From a sharemarket perspective, a bear market, defined as a 20% or more fall in value, usually overlaps with recessions.
Share markets tend to lead the economic cycle, given they are forward looking. Sharemarkets on average peak six months prior to the onset of a recession. They continue to fall during the early stages of a recession.
The recovery in sharemarkets often takes hold while the economy is still in recession (economic growth is still contracting).
The initial bounce in sharemarkets is often a period of strong performance and occurs before there is any hard evidence of a pickup in economic activity.
The following graph presents the above sequencing and overlapping nature of sharemarket returns and recessions.

Having said all that, stock markets are not good predictors of economic recession i.e. a sharp fall in global sharemarket does not mean there will be an onset of global economic recession.
This is captured by the well know quote from Paul Samuelson: “The stock market has predicted nine of the last five recessions.”
Sharemarket Returns and Inverted Yield Curves
There has been a lot of discussion over the last twelve months about the implications of an inverted US yield curve. (An inverted yield curve is when longer-term interest rates (e.g. 10 years) are lower than shorter-term interest rates (e.g. 2 years or 3 months). A normal yield curve is when longer-term-interest rates are higher than shorter-term-interest rates.
Parts of the US yield curve are currently inverted, and this inversion has increased over recent days.
The significance of this is that prior to the last 7 US recessions the yield curve has inverted prior each time. An inverted yield curve has by and large been a good predictor of recession.
Nevertheless, not every time the yield curve inverts does a recession follow and on average the inversion of the yield curve occurs 12 months prior to a recession.
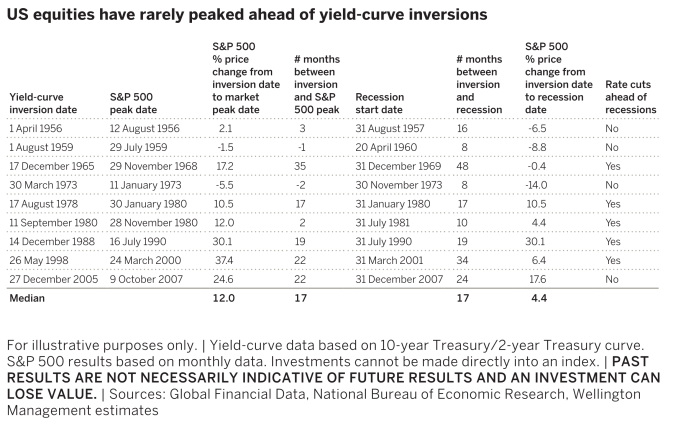
The following analysis undertaken by Wellington Management looks at the performance of the US sharemarket in relation to yield curves inversions.
The period of analysis is from the 1950s at which time the US Federal Reserve gained full, independent control over interest rates from the US Treasury. As Wellington note, “it was after this transition that the yield curve became an effective tool for gauging the impact of monetary policy on the economy and the prospect of a recession.”
Wellington present the following analysis and the Table below:
- “As shown in the third column (of Table below), the S&P 500 peaked ahead of a yield-curve inversion only twice (1959 and 1973).
- “The median time between inversion and peak equity returns was 17 months, and in several cases the market peaked almost two years or more after inversion.”
- “Aggregate equity returns post-inversion have been partly dependent on the length of time between the initial inversion and the start of the recession.”
- “Since returns tend to be negative right around the time a recession begins, the instances in which there was a shorter period between the initial inversion and the start of the recession were more likely to have a negative return.”
Just like there is a period of time between economic recession and an inverted yield curve, the sharemarket often peaks after the yield curves inverts.
Back to the Capital article, for it also runs through a number of other recession related questions.
Of interest are:
What economic indicators can warn of a recession?
- Capital outline some generally reliable signals worth watching closely, such as an inverted yield curve, corporate profits, unemployment, and leading economic indices.
- Importantly it is appropriate to look at and consider several different economic indicators.
What Causes Recessions?
- There are many reasons for a recession, chief amongst them are rising interest rates, particularly by Central Banks such as the US Federal Reserve and Reserve Bank of New Zealand, imbalances within an economy e.g. excess housing prices, high debt levels
- Every economic cycle is unique, but anything that impacts on corporate profits or consumer spending, such as rising unemployment, are factors to consider.
Just remember is it notoriously difficult to predict economic recession and they are normally the result of a number of factors that have a cascading effect leading to an economic downturn.
The following Kiwi Investor Blog Posts maybe of interest to those wanting a better understanding of inverted yield curves, leading economic indicators, and historical performance of equity market corrections.
Recession predictability of inverted yield curves and other economic indicators to considered:
- The pioneering work on yield-curve inversions and risk of economic recession
- Risk of Economic Recession and Inverted Yield Curve
- US Recession warning indicators
Analysis of Sharemarket corrections and market declines
- History of Sharemarket corrections – An Anatomy of equity market corrections
- Equity Market declines in Perspective
Lastly the Capital article provides some suggestions as to how to position your portfolio for a recession. I think it is exceedingly difficult to finesse a portfolio in the expectations of a recession.
From my perspective, the following is most critical:
- Maintain a long-term perspective;
- Implement a balanced and broadly diversified portfolio. Portfolio diversification does not come from investing in more and more asset classes. This has diminishing diversification benefits. True portfolio diversification is achieved by investing in different risk factors that drive the asset classes e.g. duration (movements in interest rate), economic growth, low volatility, value, and growth. Investors are compensated for being exposed to a range of different risks;
- Know you risk tolerance: what level of volatility in capital are you prepared to handle without changing your mind;
- Understand your risk capacity: the amount of risk you need to take in order to reach your financial goals;
- Implement a goals-based investment approach, where success is measured on how you are tracking relative to your investment goals, rather than market index performances; and
- Always maintain a high quality portfolio, with plenty of liquidity, and limit the level of turnover across the portfolio e.g. amount of trading (buying and selling)
A good advisor should be able to help you with the above and see you through bouts of sharemarket volatility, including a recession environment.
Happy investing.
Please see my Disclosure Statement
Global Investment Ideas from New Zealand. Building more Robust Investment Portfolios.


Pingback: Kiwi Investor Blog achieves 100 not out | Kiwi Investor Blog
Pingback: How good will the next decade be for Investing? | Kiwi Investor Blog