US Recession Warning Indicators

As you will know the US economy is into its second longest period of economic expansion which commenced in June 2009.

Should the US economy continue to perform until July 2019, which appears likely, the US will enter its longest period of economic expansion. The longest expansion was 10 years, occurring during the tech expansion of the 1990s, the current expansion is nine years.

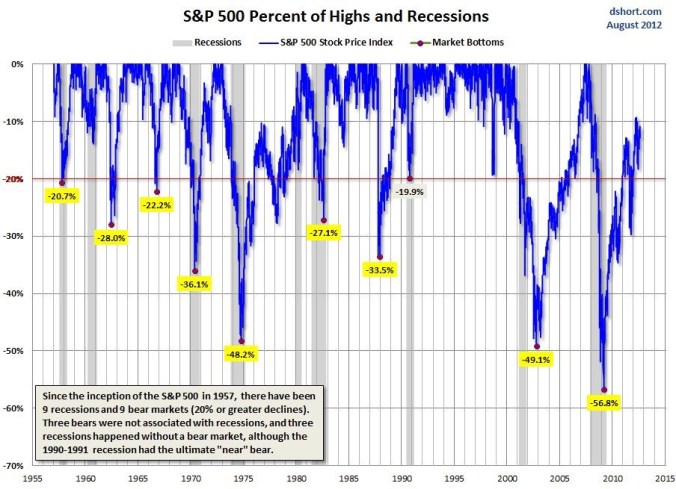
Similarly, the US sharemarket is into its longest bull market run, having not experienced a drop-in value of greater than 20% (bear market) since March 2009.

As a rule, sharemarkets generally enter bear markets in the event of a recession.


Nevertheless, while a recession is necessary, it is not sufficient for a sharemarket to enter a bear market.

Since 1957, the S&P 500, a measure of the US sharemarket:

  • three bear markets where “not” associated with a recession; and
  • three recessions happened without a bear market.


Statistically:

  • The average Bull Market period has lasted 8.8 years with an average cumulated total return of 461%.
  • The average Bear Market period lasted 1.3 years with an average loss of -41
  • Historically, and on average, equity markets tend not to peak until six – twelve months before the start of a recession.


Therefore, let’s look at some of the Recession indicators.

In a recent article by Brandywine, they ran through some of the key indicators for a US recession.

Federal Reserve Bank of Atlanta’s GDP Nowcast.

This measure is forecasting annualised economic growth of 4.4% in the third quarter of 2018. This follows actual annualised growth of 4.2% in the second quarter of 2018.

Actual US economic data is strong currently. Based on the following list:

  • US unemployment is 3.7%, its lowest since 1969
  • Consumer Confidence is at an 18 year high
  • US wages are growing at around 3%, the savings rate is close to 6%, leaving plenty of room for consumers to increase spending
  • Small business confidence is at all-time highs
  • Manufacturing and non-manufacturing surveys are at their best levels for some time (cycle highs)


Leading Indicators

The Conference Board’s Index of Leading Indicators, an index of 10 components that includes the likes of the ISM New Order Index, building permits, stock prices, and the Treasury yield curve.

The Conference Board’s Index is supportive of ongoing economic activity in the US.
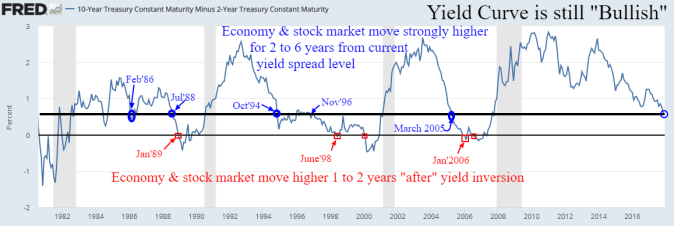
 

Yield Curve

The shape of the yield curve, which is normally upward sloping, meaning longer term interest rates are higher than short term interest rates, has come in for close attention over the last six months. I wrote a about the prospect of a negative yield curve earlier in the year.

An inverted yield curve, where shorter term interest rates (e.g. 2 years) are higher than longer term interest rates (e.g. 10 years) has a pretty good record in predicting a recession, in 18 months’ time on average.

With the recent rise of longer dated interest rates the prospect of an inverted yield curve now looks less likely.

Albeit, with the US Federal Reserve is likely to raise short term interest rates again this year and another 3-4 times next year the shape of the yield curve requires on going monitoring.

Having said that, an inverted yield curve alone is not sufficient as a predictor of economic recession and needs to be considered in conjunction with a number of other factors.


Brandywine conclude, “what does a review of some well-known recession indicators tell us about the current—and future—state of the U.S. expansion? The information provided by the indicators is mixed, but favors the continuation of the current expansion. The leading indicators are telling us the economy should continue to expand well into next year—at least.”

In favour of ongoing economic expansion is low unemployment, rising wages, simulative financial conditions (e.g. low interest rates are supportive of ongoing growth, as are high equity prices), high savings rate of consumer and their low levels of debt. Lastly government spending and solid corporate profitability is supportive of economic activity over the medium term.

As a word of caution, ongoing US – China trade dispute could derail global growth. Other factors to consider are higher interest rates in combination with a higher oil price.

Noting, Equity markets generally don’t contract until interest rates have gone into restrictive territory. This also appears some time away but is a key factor to monitor.

Lastly, a combination of higher oil prices and higher interest rates is negative for economic growth.


I have used on average a lot in this Post, just remember: “A stream may have an average depth of five feet, but a traveler wading through it will not make it to the other side if its mid-point is 10 feet deep. Similarly, an overly volatile investing strategy may sink an investor before she gets to reap its anticipated rewards.”

 Happy investing.


Global Investment Ideas from New Zealand. Building more Robust Investment Portfolios.


Please see my Disclosure Statement

How long will the record US equities bull market run continue for?

An interesting view from JP Morgan.

The US Equity market is within a month of recording its longest ever bull market.  Many are expecting it to continue well into 2019.  The US economy will reaches its longest period of economic expansion in modern history July 2019.

History of Sharemarket corrections – An Anatomy of equity market corrections


JP Morgan view.

www.bloomberg.com/news/articles/2018-07-19/jpmorgan-says-record-breaking-bull-market-could-run-until-2020


Happy investing.


Global Investment Ideas from New Zealand. Building more Robust Investment Portfolios.


Please see my Disclosure Statement

Risk of Economic Recession and an Inverted Yield Curve

There has been a lot of discussion recently about the prospect of an inverted US yield curve.  (An inverted yield curve is when longer-term interest rates (e.g. 10 years) are lower than shorter-term interest rates (e.g. 2 years or 3 months).  A normal yield curve is when longer-term-interest rates are higher than shorter-term-interest rates.

Historically an inverted yield curve is a powerful recession sign.  John Williams, who will take over the helm of the New York Federal Reserve Bank of New York in June, said earlier in the year a truly inverted yield curve “is a powerful signal of recessions” that has historically occurred (italics is mine).

The US yield curve spread (difference in yield) between the 2 year and 10 year US Treasury interest rates has recently reached its narrowest in over a decade.  Thus the heightened discussion.

As can be seen in the graph below the US Treasury yield curve inverted before the recessions of 2008, 2000, 1991, and 1981.

It should be noted that the US yield curve has not yet inverted and there is a lag between inversion and recession, on average of 1 to 2 years.  See graph below.  I am not sure I’d call the Yield Curve still “Bullish” all the same.

At the same time, the risk of recession does not currently appear to be a clear and present danger.

Much of the flattening of the current yield curve (i.e. shorter-term interest rates are close to longer-term interest rates) reflects that the US Federal Reserve has increased shorter-term interest rates by over 150 bpts over the last 2 years and longer-term interest rates remain depressed largely due to technical factors.  Albeit, the US 10 year Treasury bond recently trade above 3%, the first time since the start of 2014.  Therefore, the current shape of the US yield curve does make some sense.

Inverted yield curve.png


The picking of recession is obviously critical in determining the likely future performance of the sharemarket.

As a rule, sharemarkets generally enter bear markets, falls of greater than 20%, in the event of a recession.

Nevertheless, while a recession is necessary, it is not sufficient for a sharemarket to enter a bear market.

See the graph below, as it notes, since 1957, the S&P 500, a measure of the US sharemarket:

  • three bear markets where “not” associated with a recession; and
  • three recessions happened without a bear market.

bear market recessions.jpg


Statistically:

  1. The average Bull Market period has lasted 8.8 years with an average cumulated total return of 461%.
  2. The average Bear Market period lasted 1.3 years with an average loss of -41%
  3. Historically, and on average, equity markets tend not to peak until six months before the start of a recession.

The current US sharemarket bull market passed its 9 year anniversary in March 2018.  The accumulated return is over 300%.


Mind you, we have to be careful with averages, I like this quote:

“A stream may have an average depth of five feet, but a traveler wading through it will not make it to the other side if its mid-point is 10 feet deep. Similarly, an overly volatile investing strategy may sink an investor before she gets to reap its anticipated rewards.”


Assessing Recession Risk

Importantly, investors should not use the shape of the yield curve as a sole guide as to the likelihood of a recession.

The key forward looking indicators to monitor include an inverted yield curve, but also a significant widening of high yield credit spreads, rising unemployment, and falling future manufacturing orders.

Tightening of financial conditions is also a key indicator, particularly central banks raising interest rates (or reducing the size of their balance sheet as in the current environment) e.g. US Federal Reserve, but also tightening of lending conditions by the large lenders such as the commercial banks to consumers and more particularly businesses.

Lastly, equity market valuation is important.

Happy investing.


Please see my Disclosure Statement

US Equity Market 9 Years of Advancement

The US equity market recently celebrated 9 years of advancement without a bear market (a Bear market is defined as an equity market decline of greater than 20% from its peak).

This 9 year Bull market is closing in on the historical record of 9 years and five and half months.  The longest post-war Bull market stretched from 11 October 1990 to 24 March 2000.  To break that record the current Bull market will have to continue until the last week of August 2018.

The US equity market experienced a “correction” in February 2018 (a correction is defined as a fall in market value of between 10 and 20%) on inflation and higher interest rate concerns.  I wrote about this in this blog and also put into historical perspective here and here.  


Bull markets end with a Bear market.  Bear markets usually coincide with recession.  Very rarely has there been a Bear Equity Market without recession.  Nevertheless, there have been bear markets without a recession.

Fortunately the global economy has good momentum and recession does not look imminent. Most economic forecasts are for economic growth throughout 2018 and into 2019.

Albeit, the current Bull market does face some risks.  Key amongst those risks are:

  • Earnings disappointment in 2019. Earnings momentum is vulnerable this late in the economic cycle
  • Economic data disappoints – global equity markets are priced for continuation of the current “Goldilocks” economic environment, not too hot and not too cold.
  • Inflation data surprises on the upside
  • Policy mistake by a Central Bank given the extraordinary policy positions over the last 10 years of very low interest rates and Quantitative Easing, e.g. US Reserve Bank needs to raise short term interest rates more quickly than currently anticipated
  • Longer term interest rates rise much higher than currently expected


Therefore, lots to consider as the year progresses.


I enjoyed this quote from Howard Marks “there are two things I would never say (since they require far more certainty than I consider attainable): “get out” and “it’s time.”  It’s rare for the market pendulum to reach such an extreme that views can properly be black-or-white.  Most markets are far too uncertain and nuanced to permit such unequivocal, sweeping statements.”

Well worth thinking about when making portfolio investment decisions.


Please see my Disclosure Statement