The reality is that asset allocations can only do so much

It is estimated US public pension plans would need to leverage a Balance Portfolio of 60% equities and 40% fixed income by 47% to achieve their 7.25% actuarial return target in the years ahead. 

Such is the challenge facing all investors in the current low interest rate environment.

Investors face some very tough decisions in the future and may be forced to consider significant asset allocation shifts.  Increasing the tolerance for risk and illiquidity are likely actions required to boost future investment returns.

Investors are going to have consider something different, from a return perspective, buying bonds is not going to cut it.  Likely actions may include considering substitutes to fixed income to provide portfolio stability and some diversification during periods of equity market weakness.

The reality is that asset allocation decisions can only do so much.

These are the key conclusions from an article written by Rob Croce, PhD, of Mellon and Aaron Filbeck, that recently appeared in AllAboutAlpha.

The article covers three potential solutions for investors to consider in boosting future investment returns.

Meeting the Pension Fund Challenge

The above conclusions are determined in the context of the challenge facing US public pension plans.

On average US pension plans currently have target returns assumptions of 7.25% on average, this is down from 8% in 2000.

In the year 2000, US 10-year government bond interest rates were 6%.  Therefore there “was little headwind to meeting return objectives”….

However, with the dramatic fall in interest rates over the last 20 years, the “gap” between long-term interest rates and return assumptions has widened materially.  This is highlighted in Figure 1 below, from the article. 

The gap is currently around 6%, compared to 2% in 2000!

Figure 1: Difference Between Average Plan Actuarial Return Assumption and 10-Year US Treasury Yield

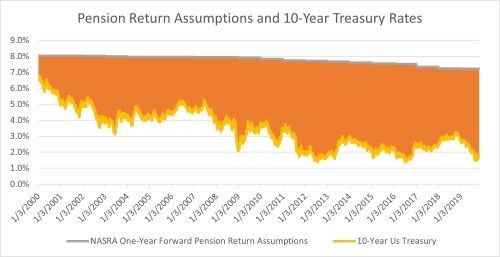
Source: NASRA, Bloomberg, CAIA calculations

What have US pension plans done over the last 20 years as the return gap has widened:

  • Reduced their allocations to fixed income;
  • Allocated more to equities; and
  • Allocated more to alternatives.

“ According to Public Plans Data, from 2001 to 2009, the average pension allocation to alternative investments increased from 8.7% to 15.7%, which only accelerated after the Global Financial Crisis (GFC). Over the next decade, allocations to alternatives nearly doubled, reaching nearly 27% by the end of 2019.”

The increased allocation to Equities and Alternatives at the expense of fixed income is highlighted in the following Figure also provided in the article.

Figure 2: Average Allocations for the 73 Largest State-Sponsored Pension Funds

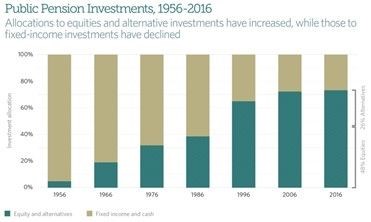
Source: Pew Research. Data as of 2016

At the same time US pension plans remain underfunded. 

The challenge facing US pension plans has been known for some time, the article notes, “In general, pension trustees seem to be faced with two potential solutions – take on more (or differentiated) risks or improve funding statuses through higher taxation or slashing benefits.”

How big is the Pension Fund Return Challenge?

The article analyses potential solutions to “filling the gap” between current interest rates and the assumed target rate of return for US pension funds.

The first approach uses risk premia-based analysis, focusing on the amount of return that can be generated over and above holding just risk-free short-term US Government bonds.

Starting with a traditional Balanced Portfolio, 60% domestic stocks and 40% U.S. 10-year bonds, the analysis seeks to determine how much risk would need to be taken to reach the 7.25% return target. Assuming historical return premia, but with the current level of interest rates.

In relation to return assumptions, the Article notes “Since 1928, stocks have outperformed the risk free asset by 6.2% at 20% volatility and 10-year U.S. government bonds have outperformed the risk-free asset by 1.5%, for Sharpe ratios of 0.3 and 0.2, respectively. For cash, we have decided to use its current near-zero return, rather than its 3.3% average return during that period.”

The results, “there is effectively no unlevered portfolio of stocks and bonds that can reliably deliver many investors’ 7.25% target return over time. Because of the nature of the problem, the solution will likely force pension investors to consider taking on leverage.”

This reflects the low interest rate environment, returns on equities will be lower on an absolute return basis.  Although equities are still expected to earn a “premium” above cash, the absolute return will be lower given the cash rate is so low (0%). The 6% equity premium is earnt on 0%, not the average 3.3% cash rate since 1928. 

The article estimates, for the Balance Portfolio to achieve the 7.25% return objective it would need to be levered by 47%.  This would increase the Portfolio’s volatility to 17.75% from 12%.

As they note, this is not a sustainable solution.  Nevertheless, it provides an indication of how much more risk needs to be taken to achieve the 7.25% return target in the current low interest rate environment.

Therefore, the article highlights the return challenge all investors face.  The leveraging of portfolios is not going to be a viable option for most investors.

The Potential Role of Alternatives

The article looks at two “hypothetical alternative allocations as potential solutions for U.S. pension funds to hit their 7.25% return, one illiquid and the other liquid.”

  1. Private Equity (illiquid).
  2. Hedge Funds or Diversified Assets (liquid)

Their analysis seeks to achieve the return outcome of 7.25% with less volatility than the levered Balance Portfolio above of 17.75% with an allocation to Private Equity and Liquid Alternatives separately.

Based on their analysis, and assumptions, they conclude the inclusion of Private Equity and Liquid Alterative strategies could help in reaching the 7.25% return assumption.

They note that Private Equity and Liquid Alternatives are “two examples provide different solutions for the same problem”.

The article also notes that there are many strategies that do not make sense e.g. anything that takes them further from their return target for the sake of diversification or anything illiquid with an expected return below their target portfolio return.

Key insights

The article wraps up with some key insights, including “buying bonds isn’t going to cut it from a return target perspective today,”…..

They also demonstrated that to meet return targets US pension plans are going to have consider something different.  “And while each pension fund is different, risk tolerance and liquidity needs will need to be managed.”

“We think that the current, low yield environment could potentially open institutions up to the idea of using low-risk liquid absolute return strategies as substitutes for fixed income investments. We believe they will increasingly look for investments that provide portfolio stability values and some diversification during risk-off environments, similar to that of traditional fixed income, but potentially provide the return of fixed income two decades ago.”

Reading this article made me think of the following John Maynard Keynes quotes:

“The difficulty lies not so much in developing new ideas as in escaping from old ones.”

“When my information changes, I alter my conclusions. What do you do, sir?”

“It is better to be roughly right than precisely wrong.”

Please see my Disclosure Statement

Global Investment Ideas from New Zealand. Building more Robust Investment Portfolios.

Kiwi Investor Blog has published 150 Posts….. so far

Kiwi Investor Blog has published over 150 Posts, so far! 

Thank you to those who have provided support, encouragement, and feedback. It has been greatly appreciated. Kiwi Investor Blog achieved 100 Posts in October 2019.

Consistent with the current investment environment and the outlook for future investment returns, the key themes of the Kiwi Investor Blog Posts over the last twelve months have been:

  1. Future returns are unlikely to be as strong as those experienced over the last decade
  2. Investment strategies for the next decade likely to include real assets, tail risk hedging, and a greater allocation to alternatives e.g. Private Equity
  3. What portfolio diversification is, and looks like
  4. Positioning portfolios for the likelihood of higher levels of inflation in the future
  5. Time to move away from the traditional Diversified Balanced Portfolio
  6. Occasions when active Management is appropriate and where to find the more consistently performing managers – who outperform
  7. Investing for Endowments, Charities, and Foundations
  8. Navigating a Bear market, including the benefits of disciplined portfolio rebalancing

Links to the key Posts to each of these themes is provided below.

Kiwi Investor Blog’s primary objective is to make available insights into Institutional investment strategies, practices, and processes to a wider audience in simple language.

The Posts are written in the spirit of encouraging industry debate, challenging the status quo and “conventional wisdoms”, and striving to improve investment outcomes for clients.

Future returns are unlikely to be as strong as those experienced over the last decade

The year started with a sobering outlook for long-term investment returns as outlined in this article by AQR.  The long-term outlook for investment markets has been a dominant theme this year, where the strong returns experienced over the Past Decade are unlikely to be repeated in the next 10 years.  Also see a related Bloomberg article here.

Interestingly, even after the strong declines in March and April of this year, Forecasted investment returns remain disappointing, given the nature of longer-term market returns.

If anything, the outlook for fixed income returns has deteriorated over the course of 2020.

Investment strategies for the next decade likely to include real assets, tail risk hedging, and a greater allocation to Alternatives

The challenging return environment led to a series of Posts on potential investment strategies to protect your Portfolio from different market environments in the future.

This includes the potential benefits of Tail Risk Hedging and an allocation to Real Assets.

A primary focus of many investment professions currently is what to do with the fixed income allocations of portfolios, as outlined in this article.

This series of Posts also included the case against investing in US equities and the case for investing in US equities (based on 10 reasons by Goldman Sachs that the current US Bull market has further to run).

The investment case for a continued allocation to Government Bonds was also provided.

Theses Post are consistent with the global trend toward the increasing allocations toward alternatives within investment portfolios.  This survey by CAIA highlights the attraction of alternatives to investors and likely future trends of this growing investment universe, including greater allocations to Private Equity and Venture Capital.

One of the most read Post this year has been a comparison between Hedge Funds and Liquid Alternatives by Vanguard, with their paper concluded both bring diversification benefits to a traditional portfolio.

What Portfolio Diversification is, and looks like

Reflecting the current investment environment and outlook for investment returns, recent Posts have focused on the topic of Portfolio Diversification. These Posts have complemented the Posts above on particular investment strategies.

A different perspective was provided with a look at the psychology of Portfolio Diversification.  Diversification is hard in practice, easy in theory, it often involves the introduction of new risks into a Portfolio and there is always something “underperforming” in a truly diversified portfolio.  This was one of the most read Posts over the last six months.

A Post covered what does portfolio diversification look like.  A beginner’s guide to Portfolio diversification and why portfolios fail was also provided.

On a lighter note, the diversification of the New Zealand Super Fund was compared to the Australian Future Fund (both nation’s Sovereign Wealth Funds).

A short history of portfolio diversification was also provided, and was read widely.

The final Post in this series provided an understanding of the impact of market volatility on a Portfolio.

Positioning Portfolios for the likelihood of higher levels of inflation in the future

Investors face the prospects of higher inflation in the future.  Although inflation may not be an immediate threat, this article by Man strongly suggests investors should start preparing their Portfolio for a period of higher inflation.

The challenge of the current environment is also covered in this Post, which provides suggestions for Asset Allocations decisions for the conundrum of inflation or deflation.

Time to move away from the traditional Diversified Portfolio

A key theme underpinning some of the Posts above is the move away from the traditional Diversified Portfolio (the 60/40 Portfolio, being 60% Equities and 40% Fixed Income, referred to as the Balance Portfolio).

Posts of interest include why the Balanced Portfolio is expected to underperform and why it is time to move away from the Balanced Portfolio.  They are likely riskier than you think.

There has been a growing theme over the last nine months of the Reported death of the 60/40 Portfolio.

My most recent Post (#152) highlights that the Traditional Diversified Fund is outdated as it lacks the ability to customise to the client’s individual needs.  Modern day investment solutions need to be more customised, particularly for those near and in retirement.

Occasions when active Management is appropriate and where to find the more consistently performing managers

Recent Posts have also covered the role of active management.

They started with a Post with my “colour” on the active vs passive debate (50 shades of Grey), after Kiwi Wealth got caught up in an active storm.

RBC Global Active Management provided a strong case for the opportunities of active management and its role within a truly diversified portfolio.

While this Post covered several situations when passive management is not appropriate and different approaches should be considered.

Another popular Post was on where investment managers who consistently outperform can be found.

Investing for Endowments, Charities, and Foundations

I have written several Posts on investing for Endowments, Charities, and Foundations.

This included a Post on the key learnings from the successful management of the Yale Endowment.

How smaller Foundations and Charities are increasingly investing like larger endowments.  See here and here.

Navigating a Bear market, including the benefits of disciplined Portfolio rebalancing

Not surprisingly, there have been several Posts on navigating the Bear Market experienced in March and April of this year.

Posts on navigating the event driven Bear Market can be found here and here.

The following Post outlined what works best in minimising loses, market timing or diversification at the time of sharemarket crashes.

This Post highlighted the benefits of remaining disciplined during periods of market volatility, even as extreme as experienced this year, particularly the benefits of Rebalancing Portfolios.

Please see my Disclosure Statement

Global Investment Ideas from New Zealand. Building more Robust Investment Portfolios.

The case against US equities

Extremely high valuations at a time of overwhelming uncertainty sits at the core of the case against US equities.  The US equity market appears to be priced for a perfect outcome. 

For those that demand a margin of safety, there is very little safety margin right now in US equities.

GMO’s James Montier recently outlined the reasons not to be cheerful toward US equities. 

This contrasts with Goldman Sachs 10 reasons why the US equity market will move higher from here, which I covered in my last Post.

In the GMO article it is argued the US sharemarket is priced with too much certainty for a positive outcome.  Nevertheless, with so much uncertainty, such as shape of the economic recovery and effectiveness of efforts in containing further outbreaks of the coronavirus, investors should demand a margin of safety, “wriggle room for bad outcomes if you like”. 

The article concludes there is no margin of safety in the pricing of US stocks today.

In his view, “The U.S. stock market looks increasingly like the hapless Wile E. Coyote, running off the edge of a cliff in pursuit of the pesky Roadrunner but not yet realizing the ground beneath his feet had run out some time ago”.

This view in part reflects that GMO does not fully support the narrative that has primarily driven the recovery in the US stock market over recent months and is expected to provide further support.

The centre of the positive market outlook narrative is the US Federal Reserves’ (Fed) Quantitative Easing program (QE).  QE involves the buying of market securities, leading to an expansion of the Fed’s Balance Sheet.

In short, Montier thinks it is tricky to argue any direct linkage from the Fed’s balance sheet expansion programs to equities.  In previous Fed QE periods longer-term interest rates rose, which is not supportive of equities.  It is also observed, in other parts of the world where interest rates are low, equity markets are not trading on extreme valuations like in the US.

On this he concludes the “Fed-based explanations are at best ex post justifications for the performance of the stock market; at worst they are part of a dangerously incorrect narrative driving sentiment (and prices higher).” 

Further detail is provided below on why he is skeptical of positive market outlook narrative centred around ongoing support for the Fed’s policy.

The article concludes:

“Investing is always about making decisions while under a cloud of uncertainty. It is how one deals with the uncertainty that distinguishes the long-term value-based investors from the rest. Rather than acting as if the uncertainty doesn’t exist (the current fad), the value investor embraces it and demands a margin of safety to reflect the unknown. There is no margin of safety in the pricing of U.S. stocks today. Voltaire observed, “Doubt is not a pleasant condition, but certainty is absurd.” The U.S. stock market appears to be absurd.”

This view is consistent with a “long term value” based investor and has some validity.  From this perspective, the investment rationale provides a counterbalance to Goldman’s 10 reasons.

The counter argument to GMO’s interest rate view is that the fall in interest rates reflects higher private sector savings and easier monetary policy rather than pessimism about growth and corporate earnings.  Reflecting the expansionary polices of both governments and central banks corporate earnings will recover.  Although weaker, the temporary fall in corporate earnings are not in proportion to that implied by lower interest rates.  This means lower interest rates really do justify higher market valuations.

Also, the two contrasting views could be correct, the only difference being a matter of time.

Implementation of investment strategy is key at this juncture in the economic and market cycle, more so than at any time over the last 20 years.

Historical sharemarket movements and over valuation

Since reaching the lows of 23rd March 2020, the U.S. equity market has rallied almost 50% and other world markets nearly 40%.

The movements in markets have been historic from the perspective of both the speed and scale of the market declines and their rebound.

GMO provide the following graph to demonstrate how sharp the fall and rebound by comparing the Covid-19 decline to others in history, as outlined in the following graph they provide:

Source: Global Financial Data, GMO

The sharp rebound in markets has pushed the US markets back up to extreme valuation levels.

The article outlines the following observations:

  • In 1929 the U.S. market P/E was 37% above its long-term average, and earnings relative to 10-year earnings were 46% above their normal level
  • In 2000 the market P/E was 98% above its average, and earnings relative to 10-year average earnings were 37% above their normal level.
  •  

As displayed in the following graph provided, valuations are in the 95th percentile, “right up there in terms of one of the most expensive markets of all time”.

Source: Schiller, GMO

It is clear to see there is very little margin for safety with such high valuation levels set against an uncertainty economic environment.

Accommodative US Federal Reserve Policy

A portion of the GMO article addresses the notion that an expanding Fed Balance Sheet will continue to support US equities.  The notion being that QE lowers interest rates, reducing the discount rate, and therefore drives up stock markets.

James prefers to focus on fundamentals and therefore has several issues with this viewpoint:

  1. He is skeptical of a clear link between interest rates and equity valuations.  As noted, Japan and Europe both have exceptionally low interest rates, but their stock markets are not trading on extreme market valuation like the US.
  2. Interest rates are low because economic growth is low, this needs to be reflected in company valuations.  See the note below, Role of Interest Rates for a fuller explanation.
  3. QE hasn’t actually managed to lower interest rates.  As can be seen in the Graph below, all three of the completed cycles of QE have actually ended with interest rates higher than they were when the QE began.
Source: Global Financial Data, GMO

The graph also highlights how low US interest rates are!

A Note on the Role of Interest Rates

The following extract from the Article outlines James’ explanation as to the Role of Interest Rates:

“I am no longer unique in my questioning of the role of interest rates. The good people at AQR Capital released a paper in May 2020 entitled “Value and Interest Rates: Are Rates to Blame for Value’s Torments?” In it they say, “As the risk-free interest rate is one component of the discount rate, when interest rates go up, the discount rate increases and the asset price falls – if everything else stays constant. Hence, if expected cash flows are unchanged and if the risk premium associated with those cash flows is unchanged (where the risk premium is determined by both the amount of risk exposure the cash flows have and the price of aggregate risk to those exposures in the economy), then the formula tells us how prices will change when riskless interest rates change. However, in the case of stocks, these other components rarely stay constant. Changes in real or nominal interest rates are often accompanied by (or are often a response to) changes in expected inflation and/or changes in expected economic growth, and hence expected cashflows are often changing as well. There may also be a change in the required risk premium, which is the other (and often larger) component of the discount rate. All of these components have their own dynamics and are likely simultaneously being affected by macroeconomic conditions in possibly different ways.”

Please see my Disclosure Statement

Global Investment Ideas from New Zealand. Building more Robust Investment Portfolios.

The case for owning equities – 10 reasons why the current bull market has further to run by Goldman Sachs

In what has been an extraordinary year, and despite a sharp bounce back from the sharemarket lows in March 2020, Goldman Sachs (GS) provides 10 strong reasons why they think US equity markets can continue to move higher from here.

GS issued their report earlier this week, 7th September 2020, after last week’s sharp declines. 

Quite rightly they highlight markets are currently susceptible to a pull back given their strong run since earlier in the year.  Nevertheless, over the longer term they think there are good reasons for them to move higher.

GS provide context in relation to the current market environment.

Firstly, the current global recession is unusual, not only to how sudden, sharp, and widespread the recession has been, also that it was not triggered by economic or market factors.  The recession was caused by government actions to restrict economic activity to contain the coronavirus.

Secondly, GS provides analysis as to the characteristics of the bear market (sharemarket fall of greater than 20%) earlier in the year.  They note it was characteristic of an “event driven” bear market (other types include structural and cyclical).  GS note that event driven bear markets typically experience falls of ~30% and are generally shorter in nature.  A sharp fall is often followed by a quick rebound.  They estimate that on average event driven bear markets take 9 months to reach their lows and fully recover within 15 months.  This compares to a structural bear market which take 3-4 years to reach their lows and around 10 years to recover.

See this Post for the history and comprehensive analysis of previous bear markets by Goldman Sachs: What too expect, navigating the current bear market.

GS also see lower returns than historically in the current investment cycle, this is expected across all asset classes.

Reasons why the current bull market has further to run

Goldman Sachs provide 10 reason why the current bull market has further to run.

Below I cover some of their reasons:

  • The market is in the first phase of a new investment cycle.  GS outline four phases of a cycle, hope, growth, optimism, and despair.  They see markets in the phase of hope, the first part of a new cycle.  2019 had the hallmarks of optimism.  The hope phase usually begins when economies are in recession as investors start to anticipate an economic recovery. 
  • The outlook for a vaccine has become more likely.  This is a positive for economic growth.  This combined with the expansionary policies by governments and central banks suggest economies will recover. 
  • The Policy environment is supportive for risk assets, including sharemarkets.
  • GS economists have recently revised up their economic forecasts.  This will likely lead to upward revisions to corporate earnings, which will help drive share prices higher.
  • Their proprietary analysis indicates there is a low level of risk for a new bear market, despite current high valuations.
  • Equities look attractive relative to other assets.  Dividend yields are attractive relative to government bonds and in GS’s view cheap relative to corporate debt, particularly those companies with strong balance sheets.
  • Although higher levels of inflation are not likely in the short/medium term, Equities offer a reasonable hedge to higher inflation expectations.
  • They see the technology sector continuing to dominate as the digital revolution continues to gather pace. They also note that many of the large tech stocks have high levels of cash and strong balance sheets. 

This article by the Financial News provides a good review of Goldman Sachs’ 10 reasons why the current bull market has further to run.

In my last Post I looked at the investment case for holding government bonds and fixed income which might be of interest.

Happy investing.

Please see my Disclosure Statement

Global Investment Ideas from New Zealand. Building more Robust Investment Portfolios.

What too expect, navigating the current Bear Market

After reaching a historical high on 19th February the US sharemarket, as measured by the S&P 500 Index, recorded:

  • Its fastest correction from a peak, a fall of 10% but less than 19%, taking just 6 days; and
  • Its quickest period to fall into a Bear market, a fall of greater than 20%, 21 days.

The S&P 500 entered Bear market territory on March 12th, when the market fell 9.5%, the largest daily drop since Black Monday in October 1987.

The 21 day plunge from 19th February’s historical high was half the time of the previous record set in 1929.

S&P500

Source: ETF.com

This follows the longest Bull market in history, which is a run up in the market without incurring a 20% or more fall in value. The last Bear market occurred in 2008 during the Global Financial Crisis (GFC).

The 11-year bull market grew in tandem with one of the longest economic expansions in US history, this too now looks under threat with a recession in the US now looking likely over the first half of 2020. Certainly, global recession appears most likely.


Global sharemarkets around the world have suffered similar declines, some have suffered greater declines, particularly across Europe.

Markets lost their complacency mid-late February on the spreading of the coronavirus from China to the rest of the world and after Chinese manufacturing data that was not only way below expectations but was also the worst on record.

A crash in the oil price, which slumped more than 30%, added to market anxieties.


Extreme Volatility

The recent period has been one of extreme market volatility, not just in sharemarkets, but currencies, fixed income, and commodity markets.

As the Table, courtesy of Bianco Research, below highlights, three of the five days in the week beginning 9th March are amongst the 20 biggest daily gains and losses.

After the 9.5% decline on 12th March, the market rebounded 9.3% the following day. The 7.6% decline on the 9th March was, to date, the 20th largest decline recorded by the S&P 500.

2020 is joining an infamous group of years, which include 1929, 1987, and 2008.

Extreme volatility

Where do we go from here?

Great question, and I wish I knew.

For guidance, this research paper by Goldman Sachs (GS) is helpful: Bear Essentials: a guide to navigating a bear market

To get a sense as to how much markets are likely to fall, and for how long, they look at the long-term history of the US sharemarket. They also categories Bear markets into three types, reflecting that Bear markets have different triggers and characteristics.

The three types as defined by GS are:

  • Structural bear market – triggered by structural imbalances and financial bubbles. Very often there is a ‘price’ shock such as deflation that follows.
  • Cyclical bear markets – typically a function of rising interest rates, impending recessions and falls in profits. They are a function of the economic cycle.
  • Event-driven bear markets – triggered by a one-off ‘shock’ that does not lead to a domestic recession (such as a war, oil price shock, EM crisis or technical market dislocation).

They then plot US Bear Markets and Recoveries since the 1800s, as outlined in the following Table:

Historical US Bear markets

Source: Goldman Sachs

From this they can characterise the historical averages of the three types of Bear markets, as outlined at the bottom of the Table:

GS summarise:

  • Structural bear markets on average see falls of 57%, last 42 months and take 111 months to get back to starting point in nominal terms (134 months in real terms (after inflation)).
  • Cyclical bear markets on average see falls of 31%, last 27 months and take 50 months to get back to starting point in nominal terms (73 months in real terms).
  • Event-driven bear markets on average see falls of 29%, last 9 months and recover within 15 months in nominal terms (71 months in real terms).


In their opinion GS currently think we are in an Event-driven Bear market. Generally these Bear markets are less severe, but the speed of the fall in markets is quicker, as is the recover. However, as they note none of the previous Event-Driven Bear markets were triggered by the outbreak of a Virus, nor were interest rates so low at the start of the market decline.

Therefore, they conclude, a fall of between 20-25% can be expected, and the rebound will be swift.

This makes for an interest couple of quarters, in which the economic data and company profit announcements are sure to get worse, yet equity markets will likely look through this for evidence of a recovery in economic activity over the second half of this year.


Happy investing.


Please read my Disclosure Statement


Global Investment Ideas from New Zealand. Building more Robust Investment Portfolios.


Sobering low return estimates

AQR has updated their estimates of medium-term (5- to 10-year) expected returns for the major asset classes.

Their expected real return for the traditional U.S. 60/40 portfolio (60% Equities / 40% Bonds) is just 2.4%, around half its long-term average of nearly 5% (since 1900).

It is also down from 2.9% estimated last year.


AQR conclude that medium term expected returns are “sobering low”. Their return estimates are after inflation (real returns) and are compounded per annum returns.

“They suggest that over the next decade, many investors may struggle to meet return objectives anchored to a rosier past”.

“We again emphasize that our return estimates for all asset classes are highly uncertain. The estimates in this report do not in themselves warrant aggressive tactical allocation responses — but they may warrant other kinds of responses. For example, investment objectives may need to be reassessed, even if this necessitates higher contribution rates and lower expected payouts. And the case for diversifying away from traditional equity and term premia is arguably stronger than ever.”


The AQR estimate for a Balance Fund return are similar to those published recently in a CFA Institute article of 3.1%.


AQR update their estimates annually.  They manage over US$186 billion in investment assets.


Return Estimates

Reflecting the strong returns experienced in 2019 across all markets, particularly US equities, future returns estimates are now lower compared to last year.

This is Highlighted in the Table below.

Medium-Term Expected Real Returns

Market

2019 Estimate

2020 Estimate

US Equities

4.3%

4.0%

Non-US Developed Equities

5.1%

4.7%

Emerging Markets

5.4%

5.1%

US 10-year Government Bonds

0.8%

0.0%

Non US-10 Year Government Bonds

-0.3%

-0.6%

US Investment Grade Credit

1.6%

0.9%


Bloomberg have a nice summary of the key results:

  • Anticipated returns for U.S. equities dropped to 4% from 4.3% a year earlier.
  • U.S. Treasuries tracked the move, with AQR predicting buyers will merely break even.
  • Non-U.S. sovereigns slipped deeper into negative territory, with a projected loss of 0.6% a year.
  • Emerging-market equities will lead the way, the firm projects, with a return of 5.1%.


This article by Institutional Investor also provides a good run down of AQR’s latest return estimates.

More detail of return estimates can be found within the following document, which I accessed from LinkedIn.


Lastly, AQR provide the following guidance in relation to the market return estimates:

  • For shorter horizons, returns are largely unpredictable and any predictability has tended to mainly reflect momentum and the macro environment.
  • Our estimates are intended to assist investors with their strategic allocation and planning decisions, and, in particular, with setting appropriate medium-term expectations.
  • They are highly uncertain, and not intended for market timing.


In addition to the CFA Article mentioned above, AQRs estimates are consistent with consensus expected returns I covered in a previous Post.


Although AQR’s guidance to diversify away from traditional equity and fixed income might be like asking a barber whether you need a haircut, surely from a risk management perspective the diversification away from the traditional asset classes should be considered in line with the prudent management of investment portfolios and consistency with industry best practice?

In my Post, Investing in a Challenging Investment Environment, suggested changes to current investment approaches are covered.

Finally, Global Economic and Market outlook provides a shorter term outlook for those interested.


Happy Investing

Please read my Disclosure Statement


Global Investment Ideas from New Zealand. Building more Robust Investment Portfolios.


How good will the next decade be for Investing?

“Adjusted for risk—or, more precisely, the volatility stock investors had to bear—gains in the S&P 500 index since Dec. 31, 2009, are poised to be the highest of any decade since at least the 1950s.” as outlined in a recent Bloomberg article, The Bull Market Almost No One Saw Coming.

Who would had thought that back in 2009?


As the Bloomberg article highlights, it has been a relatively smooth ride of late; equity market volatility has fallen in line with the sharp decline in interest rates over the last ten years.

Also assisting the smoother ride in US equity markets has been the lower volatility in US economic activity. The US economy has expanded by 1.6% to 2.9% in each of the previous nine years, a similar level of economic activity is expected in 2019. According to Bloomberg, based on standard deviation, that’s the smallest fluctuation over any 10-year stretch in data going back to 1930.


In fact, the 2010s were the first decade without a bear market, defined as a 20% drop from any peak.

For the record, US equities:

  • experienced six separate 10% corrections over the 2010s (to date!); and
  • In total have returned 249% in the past 10 years, about 1.2 times the historical average.

The US is amid the longest bull market ever (longest period in history without a bear market).

These gains have come when least expected.


They also follow a -20% decline over the previous decade (2000 – 2009). Which includes a -52% decline of the Great Recessions (Global Financial Crisis (GFC) – measured over the period October 2007 – February 2009. As at October 2007 the S&P 500 Index had only climbed 11% since the beginning of the decade.


How Good has it been?

As Bloomberg note, based on the Sharpe ratio, which tracks the performance of equity markets relative to Government Bonds, adjusted for the volatility of equity markets, the current Sharpe Ratio of the S&P500 is the best among any decade since at least Dwight Eisenhower’s presidency.

The last decade has not been all plain sailing and includes the following market events: May 2010 flash crash, Europe’s sovereign debt crisis in 2011 and ’12, and China’s currency devaluation in 2015.

A previous Post covered these market declines: Equity Market Declines in Perspective

More recently global markets have had to endure an ongoing trade and technology dispute between the US and China.

Central Bank actions, including the lowering of interest rates and quantitative easing (i.e. buying of market securities, mainly fixed income) has helped ease markets anxiety. This is reflected in the decline of market volatility indices, such as the VIX Index.


What does the next decade look like?

The sharemarket and economy are linked.

Generally a bear market (i.e. 20% or more fall in value) does not occur without a recession (a recession is often defined as two consecutive quarters of negative economic growth).

Currently there are no excesses within the US economy, that normally precede a recession e.g. elevate inflation, excessive house prices, and high household debt levels.

This would tend to indicate that global equity markets can move higher.


Nevertheless, US equity market valuations are high, as are those of global Fixed Income markets.  This environment has resulted in many reporting the death of the traditional Balanced Portfolio (60% listed equities / 40% fixed income).

There are growing expectations that returns over the next decade will be lower than those experienced over the last ten years, as highlight in a previous Post: Low Return Environment Forecasted.

That Post has the following Table, GMO’s expected 7 year returns as at 31 July 2019. They estimated the real returns (returns after 2.2% inflation) for the following asset classes as follows:

Share Markets Annual Real Return Forecasts
US Large Capitalised Shares -3.7%
International Shares 0.6%
Emerging Markets 5.3%
Fixed Income Markets
US Fixed Income -1.7%
International Fixed Income Hedged -3.7%
Emerging Debt 0.7%
US Cash 0.2%

As GMO highlight, these are forward looking based on their reasonable beliefs and they are no guarantee of future performance.   Actual results may differ materially from those anticipated in forward looking statements.


It is very rare for decade of strong returns to be followed by a similar like decade.  Only time will tell.

Nevertheless, there is little doubt that a challenging investment environment is likely in the not too distant future. This Post outlines how to prepare and consider investing for such a challenging environment: Investing in a Challenging Investment Environment.


Happy investing.

Please read my Disclosure Statement


For a historical perspective of previous sharemarket corrections and bear markets please see my previous Post: History of Sharemarket corrections – An Anatomy of equity market corrections

Meanwhile, this Post, Recessions, Inverted Yield Curves and Sharemarket Returns, outlines the inter-play between the economic cycle and sharemarket returns.


Global Investment Ideas from New Zealand. Building more Robust Investment Portfolios.


Pioneering work on yield-curve inversions and risk of economic recession

There is no doubt that global economic growth has slowed over the last six months. The Reserve Bank of New Zealand (RBNZ) highlighted rising global economic risks in its recent Policy statement. The RBNZ noted that economic growth has slowed in our major trading partners of Australia, China, and Europe.

Economic growth has also slowed in the US. Although US financial conditions have eased in recent months, they did tightened over the course of 2018.

The risk of a US recession has risen in recent months. Albeit calls of a US recession have been around for some time.

A recent article by Gary Shilling in Think Advisor captures the type of the analysis undertaken on the US economy over the last 18 months.

Leading economic indicators for the US have weakened. Nevertheless, they are not consistent with forecasting a looming recession, except perhaps one, an inverted yield curve which is discussed below.

Overall the US economy is in good health, with record low unemployment, growing incomes, high saving rates, strong household balance sheets, business investment is set to increase, as is Government spending.


As Shilling notes in his article, the US economy could go several ways e.g. economic growth rebounds over 2019, the US experiences a period of prolonged moderate economic growth without a recession, or the US experiences a classic economic cycle and tips into a recession at a later date due to the US Federal Reserve raising interest rates.

By Shilling’s count, there have been 12 occasions since World War 2 that the Fed raising interest rates has resulted in a recession. Presently, this would appear some time away  given the Fed has indicated it is unlikely to undertake further interest rate increases in 2019.

The later scenario is most consistent with the consensus view – it is a little early to call a US recession, yet the risks of a recession within the next 2-3 years are growing. For the time being the US continues to expand and will enter its longest period of economic expansion in modern history in July 2019. Recession will eventually be triggered by the Fed increasing interest rates resulting in a more “garden variety” recession.


And this leads to a key point in Shilling’s article, the word recession invokes images of a Global Financial Crisis (GFC) type outcome – not surprising given this was our last experience.

His expectations are that the next US recession will not be as severe as the GFC.

He has a similar view with respect to the next US “Bear” market (i.e. fall in value of greater than 20%).

I’ll leave it to him to explain:

“Recession” conjures up specters of 2007-2009, the most severe business downturn since the 1930s in which the S&P 500 Index plunged 57 percent from its peak to its trough. The Fed raised its target rate from 1 percent in June 2004 to 5.25 percent in June 2006, but the main event was the financial crisis spawned by the collapse in the vastly-inflated subprime mortgage market.

 Similarly, the central bank increased its policy rate from 4.75 percent in June 1999 to 6.5 percent in May 2000.  Still, the mild 2001 recession that followed was principally driven by the collapse in the late 1990s dot-com bubble that pushed the tech-laden Nasdaq Composite Index down by a whopping 78 percent.

The 1973-1975 recession, the second deepest since the 1930s, resulted from the collapse in the early 1970s inflation hedge buying of excess inventories. That deflated the S&P 500 by 48.2 percent. The federal funds rate hike from 9 percent in February 1974 to 13 percent in July of that year was a minor contributor.

The remaining eight post-World War II recessions were not the result of major financial or economic excesses, but just the normal late economic cycle business and investor overconfidence. The average drop in the S&P 500 was 21.2 percent.


In short, history shows that US sharemarkets drop by about 21% when the economy falls into recession, remembering the S&P 500 fell almost 20% during the last three months of 2018.


Inverted Yield Curve

As you will know, the slower economic growth has resulted in several Central Banks, with the RBNZ the latest, to turn more cautious on the outlook for economic growth and inflation. This list includes the US Federal Reserve, European Central Bank, and Reserve Bank of Australia.

This sudden change in direction of interest rate policy (Monetary Policy) has witnessed a flattening of yield curves (when longer-dated interest rates are at similar level to shorter-term interest rates).

In the US, the yield curve has become inverted, where longer-term interest rates are lower than shorter-term interest rates.

The inversion has primarily been due to the significant reduction in longer-term interest rates rather than the increase in shorter-term interest rates (inversions normally occur when short term interest rates are increased rapidly by Central Banks).

The significance of this is that prior to the last 7 US recessions the yield curve has inverted each time.

Nevertheless, not every time the yield curve inverts does a recession follow and on average the inversion of the yield curve occurs 12 months prior to a recession.


As you can imagine a lot has been written in recent weeks on the implications of a negative yield curve, I would like to highlight the following three articles, which pretty much sums up the current debate:

  1. A very recent interview with the person who undertook in 1986 the pioneering work on yield-curve inversions and their foreshadowing of economic downturns (RA-Conversations)
  2. Mohamed A. El Erain’s article of “Beware of Misreading Inverting Yield Curve “
  3. BCA LinkedIn Post, Yield Curve Inversions and S&P 500 Peaks, don’t get bogged down in the noise.


It would appear, that when it comes to the current inversion of the US yield curve, we have “Nothing to fear but fear itself” (Franklin D. Roosevelt). This is certainly the view of Mohamed A. El Erain.


I have blogged previously on the history of inverted yield curves and their predictive ability. Similar there is also a previous post on the anatomy of equity Bear markets.


Happy investing.


Global Investment Ideas from New Zealand. Building more Robust Investment Portfolios.


Please see my Disclosure Statement

It has been a tough Year to make Money

2018 has been a tough year in which to make money.

2018 is “The worst time to make money in the markets since 1972” according to a recent Bloomberg article.

“Things have not been this bad since Richard Nixon’s presidency”.

Research undertake by Ned Davis Research, who places markets into eight big asset classes, everything from bonds (Fixed Interest) to US and international stocks and commodities, not one of them is “on track to post a return this year of more than 5%, a phenomenon last observed in 1972”….

As they note, in terms of absolute loses, think Global Financial Crisis (GFC 2007/08), investors have incurred far worst returns in 2018, nevertheless, as far as breadth of asset classes failing to deliver upside returns, “2018 is starting to look historic.”

Nothing has worked this year.  Year to date: global equities are down, as are emerging markets, hedge fund indices, global commodities (even oil), International Credit, Global High Yield, US Fixed Interest, US Inflation Protected Bonds, while Global Aggregate Fixed Interest have eked out a small gain.  Investments into unlisted assets have been more rewarding.


“That’s all but unique in history. Normally when something falls, something else gains. Amid the financial catastrophe of 2008, Treasuries rallied (increased in value). In 1974, commodities were a bright spot. In 2002, it was REITs. In 2018, there’s nowhere to run.”


Outcomes are a little better if you are a New Zealand (NZ) based investor, Cash is on track to return around 2%, 6 month Term Deposits 3.5%, NZ Fixed Interest is up around 4%, and the NZ Sharemarket is currently up 3%.  Still they are all short of 5%.  Meanwhile the recent strength in the NZ dollar has detracted from offshore returns.


It has been a tough year, global equities reached all-time highs in January, fell heavily in February and March, only to recover up to October, with the US Sharemarket reaching a new historical high.

Since October yearly gains have been erased due to a number of factors, some, but not all, of these factors are briefly outlined below.


In short, as highlighted by a recent Barron’s article markets appear to be panicking over everything.

Recent market drivers in brief:

  • Primarily concern for Sharemarkets has been a reduction in global economic growth expectations. Global investor sentiment toward the pace of global economic growth in 2019 has become more cautious over recent months. Global sharemarkets have adjusted accordingly. Albeit, the sharmarket adjustment does appear to be overdone relative to the likely moderating in global growth in 2019, which has also  largely been anticipated.
  • Global Trade concerns continue to negatively impact global markets e.g. Australia and commodities, primarily the ongoing negotiations between the US and China are a source of market volatility and uncertainty.
  • Brexit more recently. The UK are going to have to pay a price for leaving the EU, why? too stop other countries ever considering leaving the EU as a viable option. Unfortunately, while Brexit is an important issue and will be a source of volatility, the negative consequences will largely sit with the UK rather than the rest of the world.
  • There has been considerable oil price volatility, the price of oil fell by over 20% in November.
  • There has also been uncertainty as to likely pace of increases in the Federal Funds Rate by the US Federal Reserve (US Central Bank).


Inverted Yield Curve

Lastly, markets have also latched onto the inversion of the US Yield curve.

Inversion is when the yield (rate of interest) is lower on longer dated fixed interest securities compared to shorter dated securities. Under normal circumstance longer dated securities have a higher yield than shorter dated securities.

An “inverted” yield curve has been useful, though not perfect, in predicting economic recession and equity bear markets (when sharemarkets fall in value of over 20%),


On this occasion the market has focused on the three year security versus the five year security.

Normally, the market focuses on the three month versus the 10 year security as the best predictor of economic recession.  For a further discussion see Risk of Economic Recession and Inverted Yield Curve and US Recession warning. An inverted yield curve is a necessary but not sufficient condition in predicting a recession, and there is often a lag.


As the Barron article highlights: “Since 1965, the three-year yield has been higher than the five-year on seven different occasions. In 1973, the stock market had already sunk into a recession. In the other six instances, the median distance to a recession was 25 months—or more than two years. The S&P 500 went on to gain a median 20% over the 24 months following such an inversion. “Historically, not only have returns tended to be very strong, but the bear market has generally been years away,”


Happy investing.


Please see my Disclosure Statement


Global Investment Ideas from New Zealand. Building more Robust Investment Portfolios.


Balanced Bear Market

A “Balanced Bear” is when both equities and bonds sell off together.

As a result, a Balanced Fund, 60% invested in the stockmarket (equities) and 40% invested in fixed income (bonds), has a larger than normally expected period of underperformance – a Balanced Fund Bear Market.

During these periods the diversification benefits of bonds relative to equities disappears.

As you will know, historically if the stock market is selling off sharply, money is moving into fixed income. This drives up the price of fixed income securities helping to partially offset the negative returns from the stock market.  A Balance Fund can come through these periods of equity market uncertainty relatively unscathed.

In a Balance Bear, equities are falling in value and fixed income is also falling in value given interest rates are rising (noting as interest rates rise the price, and therefore value, of a fixed income security falls).

This type of market environment was evident in early 2018 and was a prominent feature of the market volatility in early October 2018.


The thesis of the Balanced Bear has been promoted by Goldman Sachs and their equity analyst Christian Mueller-Glissmann raised the idea on CNBC in February of this year.

Goldman Sachs have written extensively on the Balance bear using historical US financial market data.

Importantly, a Balanced Fund is now into its longest period of outperformance, reflecting the very strong record run in US equities since 2009 and that interest rates, albeit they have risen from their June 2016 lows, are still at historical lows and have provided solid returns over the longer time frames.  The same can be said about New Zealand “Balanced Funds”.


The Anatomy of equity bear markets is well documented, not so for a Balanced Fund bear market.

In this regards Goldman Sachs (GS) has undertaken a wealth of analysis.


Requirements for a Balanced Bear – usually a Balance Bear requires a material economic growth or inflation shock.

In this regard, the largest Balance Fund declines over the last 100 years have been in or around US recessions (economic growth shock).

Nevertheless, Goldman Sachs also found that the Balance Fund can have long periods of low real returns (i.e. after inflation) without a recession e.g. mid 40s and late 70s. These periods are associated with accelerating inflation.


Naturally, equities dominate the risk within a Balanced Fund, therefore large equity market declines e.g. Black Monday 1987 are associated with periods of underperformance of Balanced Funds.

Not surprisingly, most of the largest Balanced Fund falls in value have been during US recessions, but not all e.g. 1994 Bond market bubble collapsing, stagflation of 1970 (low economic growth and high inflation), 1970’s oil shock.  It is worth noting that the 1987 sharemarket crash was not associated with a US recession.


Also of note, the stagflation periods of the 1970’’s and 80’s are periods in which there were large falls in both equities and bonds.


Bond market bears – are usually triggered by Central Banks, such as the US Federal Reserve, raising short term interest rates in response to strong growth and an overheating of the economy.  Bond market bears have been less common in modern history given the introduction of inflation targets anchoring inflation expectations.


Equity markets can absorb rising interest rates up to the point that higher interest rates are beginning to restrict economic activity. An unanticipated increase in interest rates is negative for sharemarkets and will lead to higher levels of volatility e.g. 1994 or recent tapper tantrum of May 2013.


As noted in previous blogs, most equity bear markets have been during recessions…but not all.

Goldman Sachs makes this point as well, noting the majority of 60/40 drawdowns of more than 10% have been due to equity bear markets, often around recessions. They note it is very seldom the case that equities deliver positive returns during a 60/40 drawdown (they estimate only in c.5% of cases).

With regards to recessions, Goldman Sachs note that there have been 22 recessions since 1900 and 22 S&P 500 bear markets. However, not every bear market automatically coincided with a recession in the last 100 years – out of the 22 since 1900, 15 were around a recession – 7 due to other factors.


Also, high equity valuations don’t signal a bear market. Nevertheless, they do signal below average returns over the medium to longer term. Albeit, sharemarket bear markets are not associated with low valuations!


Therefore, assessing the risk of a US recession is critical at this juncture.  As covered in a recent Post the “warning signs” of recession are not present currently based on a number of US Recession warning indicators.


Lastly, as also noted in a previous Post it is very difficult to predict bear markets and the costs of trying to time markets is very expensive.  The maintenance of a truly diversified portfolio and portfolio tilting will likely deliver superior return outcomes over the longer term.

A more robust and truly diversified portfolio reduces portfolio volatility increasing the likelihood of investors reaching their investment goals.


It is a good time to reflect on the diversification of your portfolio at this time in the market cycle. As Goldman Sachs note, both equities and bonds appear expensive relative to the last 100 years.

In a Balanced Bear scenario there are very few places to hide.


Happy investing.


Global Investment Ideas from New Zealand. Building more Robust Investment Portfolios.


Please see my Disclosure Statement