Navigating through a Bear market – what should I do?

To all Kiwi Investor Blog readers, I hope you are staying safe and healthy. My thoughts are with you from a health perspective and for those facing the economic consequences on businesses and families from the spread of the coronavirus.


In the current market environment there is much uncertainty and many are wondering what to do with their investments.

The key questions being asked are should we switch to a more conservative investment or get out the markets all together.


One of the best discussions on why to remain invested is provided by FutureSafe in a letter to their client’s 15th March.

FutureSafe provide one reason why it might be the right thing for someone to reduce their sharemarket exposure and three reasons why they might not.

They have reproduced the letter in the hope that it might be helpful and of interest to the broader investing community.

As they emphasis, please consult your advisor or an investment professional before making any investment decisions. In New Zealand, the FMA has also provided recent guidance on this issue, KiwiSaver providers should be providing general (class) advice to members at this time. Their full guidance on Kiwisaver Advice is here.


I have provided the main points below of the FutureSafe letter to clients, nevertheless the letter is well worth reading in full.

The first question is do you have too much invested in the market?

As FutureSafe highlight, the average declines of bear markets since WWII have been over 30%, with some declines as large as 60%. It has generally taken on average 2 years to recover.


My last Post, What to expect, navigating the current Bear-Market, presented research from Goldman Sachs on the historical analysis of bear markets in US equities going back to the 1800s. At this stage, we are likely experiencing an Event-Driven Bear market.  These Bear markets tend to be less severe, but the speed of the fall in markets is quicker, as is the recover.

However, as Goldman Sachs note none of the previous Event-Driven Bear markets were triggered by the outbreak of a virus, nor were interest rates so low at the start of the market decline.

Historically Event-Driven bear markets on average see falls of 29%, last 9 months and recover within 15 months. Nevertheless, the current Bear could transform into a cyclical bear market if containment efforts lead to a larger global recession than anticipated.


Back to FutureSafe. You should only take the risk you can stomach, or technically speaking, is aligned with your “risk appetite”. Which is a level of risk that does not keep you awake at night.  Unfortunately, we often don’t know our risk appetite until we experience significant market events like we are experiencing currently. We are often over-confident as to the level of market volatility we can tolerate.

FurtureSafe conclude “Now that we are in a downturn, if you have come to the conclusion that your risk appetite is not what you thought it was, it’s perfectly OK to acknowledge that and change your safety net accordingly.”

However, before you do anything, FutureSafe ask you to read through and consider a few reasons why not to do anything at this time might be appropriate.

Reason 1

If management of risk appetite is not your motivation, perhaps you are planning on selling now, with the conviction markets will continue to fall, and you plan on buying back in later.

You are essentially making an active investment decision and attempting to time markets.

Timing markets is very hard to do. Professional Investors are not very good at it.

The data on the average mutual fund investor is also not very complimentary. As FutureSafe note the “the average mutual fund investor has not stayed invested for a long enough period of time to reap the rewards that the market can offer more disciplined investors. The data also shows that when investors react, they generally make the wrong decision.”  A mutual Fund is like a Unit Trust or KiwiSaver Fund in New Zealand.

I depart from the FutureSafe article and provide the graph below from PIMCO.

As PIMCO highlight, “Through no fault of their own – and especially when market volatility strikes – investors tend to be their own worst enemy.”

The graph below highlights that investors do not capture all of the returns from the market, which can be attributed to behavioural biases that leads to inappropriate timing of  buying and selling.

This investor behavioural gap is well documented.

In reference to market timing and in one short sentence, FutureSafe say “We’re probably not as good at these active calls as we think we are, and it might hurt more than help.”

PIMOC Behaviour gap

Reason 2

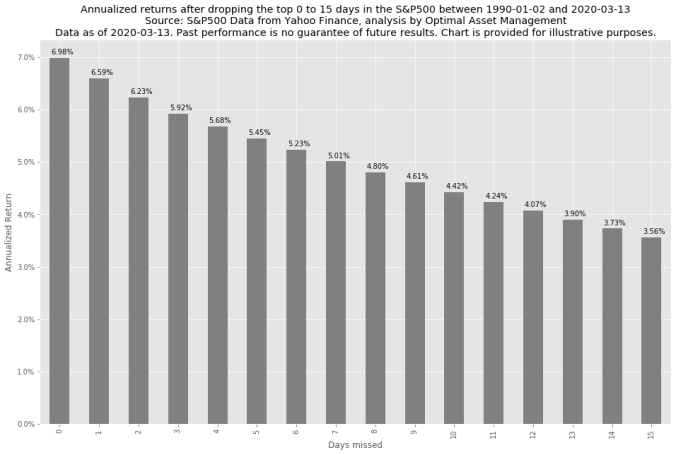
A large portion of returns are earned on days markets make large gains.

Although the extreme volatility being witnessed currently is very painful to watch, amongst them are explosive up days. Attempting to time markets might cause you to miss these valuable up days.

The research on this is also very clear.

As outlined in the Table below, if you had missed the top 15 biggest return days your yearly return would have been 3.6% compared to 7% per year if you had remained fully invested (this is over the period January 1990 to March 2020 and being invested in the US S&P 500 Index).

Missing large daily returns

Of course, the same can be said if you missed the largest down days. Nevertheless, good luck at avoiding these days and still being able to fully capture the returns from equity markets.  The down days represent the risk of investing in shares.

Most important is having a disciplined investment approach and an investment portfolio consistent with your risk appetite and is truly diversified so as to limit the impact of the poor periods of performance in sharemarkets.

In summary, FutureSafe note, “Missing just a few of the top up days, can cost you a large chunk of the market’s returns.”


Reason 3

Take a long-term perspective.

Overtime, and with hindsight, large market declines look like minor setbacks over the longer term, the very long term.

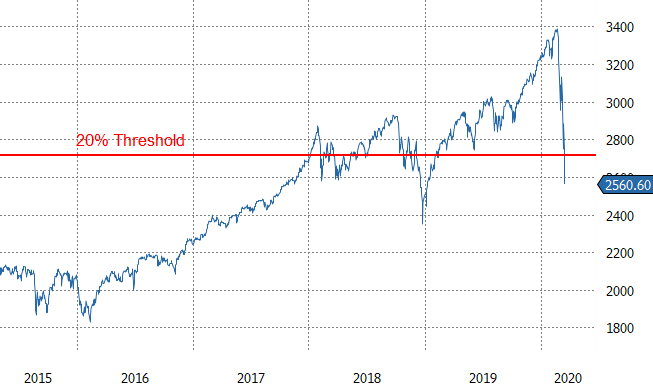
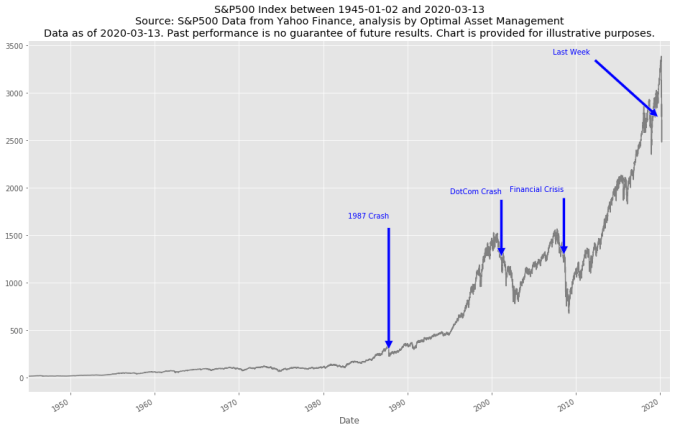
This is quite evident from the following graph.

Remember, the stock market fell by 20% over one day in 1987, the dot-com crash of 2000 or even the Great Financial Crisis of 2008 don’t look to bad with a longer term perspective.

Take a longer term perspective

As FutureSafe conclude “If you really don’t need the money for a long period of time (e.g. 10 or 15 years) these are best to ride out because they look a lot better in the rear view mirror than when you are going through it.”

“If you have a long enough horizon (10 to 15 years or more), the chances of doing well in the stock market is still quite good.”


Therefore, the key points to consider are:

  • Risk Appetite should primarily drive your allocation to sharemarkets, not the current market environment;
  • We can’t time markets, not even the professionals;
  • Be disciplined and maintain a well-diversified investment portfolio, this is the best way to limit market declines, rather than trying to time markets;
  • Take a longer-term view; and
  • Seek out professional investment advice


Keep safe and healthy.


Happy investing.


Please read my Disclosure Statement


Global Investment Ideas from New Zealand. Building more Robust Investment Portfolios.

What too expect, navigating the current Bear Market

After reaching a historical high on 19th February the US sharemarket, as measured by the S&P 500 Index, recorded:

  • Its fastest correction from a peak, a fall of 10% but less than 19%, taking just 6 days; and
  • Its quickest period to fall into a Bear market, a fall of greater than 20%, 21 days.

The S&P 500 entered Bear market territory on March 12th, when the market fell 9.5%, the largest daily drop since Black Monday in October 1987.

The 21 day plunge from 19th February’s historical high was half the time of the previous record set in 1929.

S&P500

Source: ETF.com

This follows the longest Bull market in history, which is a run up in the market without incurring a 20% or more fall in value. The last Bear market occurred in 2008 during the Global Financial Crisis (GFC).

The 11-year bull market grew in tandem with one of the longest economic expansions in US history, this too now looks under threat with a recession in the US now looking likely over the first half of 2020. Certainly, global recession appears most likely.


Global sharemarkets around the world have suffered similar declines, some have suffered greater declines, particularly across Europe.

Markets lost their complacency mid-late February on the spreading of the coronavirus from China to the rest of the world and after Chinese manufacturing data that was not only way below expectations but was also the worst on record.

A crash in the oil price, which slumped more than 30%, added to market anxieties.


Extreme Volatility

The recent period has been one of extreme market volatility, not just in sharemarkets, but currencies, fixed income, and commodity markets.

As the Table, courtesy of Bianco Research, below highlights, three of the five days in the week beginning 9th March are amongst the 20 biggest daily gains and losses.

After the 9.5% decline on 12th March, the market rebounded 9.3% the following day. The 7.6% decline on the 9th March was, to date, the 20th largest decline recorded by the S&P 500.

2020 is joining an infamous group of years, which include 1929, 1987, and 2008.

Extreme volatility

Where do we go from here?

Great question, and I wish I knew.

For guidance, this research paper by Goldman Sachs (GS) is helpful: Bear Essentials: a guide to navigating a bear market

To get a sense as to how much markets are likely to fall, and for how long, they look at the long-term history of the US sharemarket. They also categories Bear markets into three types, reflecting that Bear markets have different triggers and characteristics.

The three types as defined by GS are:

  • Structural bear market – triggered by structural imbalances and financial bubbles. Very often there is a ‘price’ shock such as deflation that follows.
  • Cyclical bear markets – typically a function of rising interest rates, impending recessions and falls in profits. They are a function of the economic cycle.
  • Event-driven bear markets – triggered by a one-off ‘shock’ that does not lead to a domestic recession (such as a war, oil price shock, EM crisis or technical market dislocation).

They then plot US Bear Markets and Recoveries since the 1800s, as outlined in the following Table:

Historical US Bear markets

Source: Goldman Sachs

From this they can characterise the historical averages of the three types of Bear markets, as outlined at the bottom of the Table:

GS summarise:

  • Structural bear markets on average see falls of 57%, last 42 months and take 111 months to get back to starting point in nominal terms (134 months in real terms (after inflation)).
  • Cyclical bear markets on average see falls of 31%, last 27 months and take 50 months to get back to starting point in nominal terms (73 months in real terms).
  • Event-driven bear markets on average see falls of 29%, last 9 months and recover within 15 months in nominal terms (71 months in real terms).


In their opinion GS currently think we are in an Event-driven Bear market. Generally these Bear markets are less severe, but the speed of the fall in markets is quicker, as is the recover. However, as they note none of the previous Event-Driven Bear markets were triggered by the outbreak of a Virus, nor were interest rates so low at the start of the market decline.

Therefore, they conclude, a fall of between 20-25% can be expected, and the rebound will be swift.

This makes for an interest couple of quarters, in which the economic data and company profit announcements are sure to get worse, yet equity markets will likely look through this for evidence of a recovery in economic activity over the second half of this year.


Happy investing.


Please read my Disclosure Statement


Global Investment Ideas from New Zealand. Building more Robust Investment Portfolios.


Why is the Multi-Asset Portfolio so Popular?

The rise of the Multi-Asset Portfolio can be traced back to the Global Financial Crisis (GFC) in 2008, when many investors “grew disenchanted with the long-time investment mantra that equities were the one true way to wealth. That smug bromide rang hollow when the financial crisis slashed many stock portfolios in half”, according to recent Chief Investment Office (CIO) article, How Multi-Asset Investing Became So Popular.

Following the GFC, the mantra became diversify your holdings. As a result, Multi-Asset Portfolios, which combine equities, fixed income, and an array of other assets, gained greater prominence.

Multi-Asset Portfolios grew more popular on promises of greater capital preservation and sometimes the delivery of superior returns.

As CIO note, the increased prominence of the Multi-Asset Portfolio can be attributed to David Swensen, Yale’s investment chief since 1986. Yale has generated an impressive performance record by investing outside of just equities and fixed income. Their portfolio has included high allocations to private equity, real estate, and other non-traditional assets. (For more on the success of the Endowment model and the fee debate please see this Post.)


The CIO article also noted that Multi-Asset Portfolios are most prominent among target-date funds (TDFs), which have become the default offering among 401(k) plans (e.g. US superannuation schemes such as KiwiSaver in New Zealand).

“TDFs have grown five-fold since the financial crisis, reaching $1.09 trillion in 2018, a Morningstar report concluded, with an estimated $40 billion added last year.”


The Concept: Absolute returns and better risk management

The Multi-Asset Portfolio is based on the concept of absolute returns, where the focus is on generating a more targeted and less volatile investment return outcome. There is a greater focus on risk management relative to that undertaken within a traditional portfolio. The intensity and sophistication of risk management employed depends on the type of absolute return strategy.

The absolute return universe is very broad, ranging from Multi-Asset Portfolios to those with a much greater focus on absolute returns such as the plethora of Hedge Fund strategies, including Risk Parity as discussed in the CIO article.

This contrasts with the traditional balanced fund, which are generally less diversified, portfolio risk is dominated by the equity exposures, and returns are much more subject to the vagaries of investment markets. The management of risk is more focused on relative returns i.e. how performance goes relative to a market benchmark, rather than returns relative to an absolute return outcome.

A Multi-Asset Portfolio generally has more of an absolute return focus than a Traditional Portfolio. It achieves this by having a more truly diversified portfolio, moving beyond the traditional Balanced Portfolio (60% equities and 40% Fixed Income), to incorporate a greater array of different investment strategies and risk management approaches within the portfolio.

As the CIO article comments, “There’s a strong argument for Swensen-like multi-asset funds that range beyond stocks and bonds, adding solid helpings of commodities, real estate and all kinds of other asset classes. With such an array, the thinking goes, you’re best protected when recessions thunder in.”


Return Expectations

The CIO article made the following observation, Multi-Assets Portfolios are “expected to return 4.5% annually through 2024, according to Casey Quirk, an arm of Deloitte Consulting. That isn’t a daunting growth rate, but the figure should have a decent chance of holding steady, while public markets lurch around, especially in the next recession.”

To put this into perspective, a recent CFA Institute article estimated that a Balanced Portfolio will return 3.1% over the next 10 years.

It is highly likely we are heading into a “Low Return Environment”.


As a result, a different investment approach to that which has been successful over the last 20-30 years is likely needed to invest successfully in what is expected to be a Challenging Investment Environment.

As the CIO article notes, “But multi-asset now goes far beyond the simple stock-bond duality, which seems insufficient to deliver the best diversification. The most salient problem with the basic pairing nowadays is that bonds are paying low interest rates. Their ability to score capital gains is limited because rates don’t have much left to fall before they hit zero. “These don’t work as well as they used to,” observed Deepak Puri, CIO Americas for Deutsche Bank Wealth Management.”


I fear the lessons from the GFC and 2000 Tech Bubble are fading from the collective memory, as equity markets reach historical highs and investors chase income from within equity-income sectors of the sharemarket.

In addition, more advanced portfolio management approaches have been developed over the last 20 – 30 years.

It would seem crazy that these learnings are not reflected in modern day investment portfolios. In a previous Post: A Short History of Portfolio Diversification, it is not hard to see how the Multi-Asset Portfolio has developed over time and is preferred by many large institutional investors.

Meanwhile, this Post: What Portfolio Diversification looks like, compares a range of investment portfolios, including the KiwiSaver universe, to emphasis what a Multi-Asset Portfolio does look like.


Growth in Multi-Asset Portfolios to continue

Increasingly the Multi-Asset Portfolios are taking market share from traditional portfolios.

Institutional investors are increasingly adopting a more absolute return investing approach. This has witnessed an increased allocation, and growth in Funds Under Management, in underlying strategies, “such as private equity, hedge funds, real estate, natural resources, and other strategies whose assets aren’t publicly traded.”


An underlying theme of the CIO article is the Death of the Balance Portfolio, which I covered in a previous Post.

Personally, I think the death of 60/40 Portfolio is occurring for more fundamental reasons. The construction of portfolios has evolved, as noted above, more advanced approaches can be implemented. For those interested I covered this in more detail in a recent Post: Evolution within the Wealth Management Industry, the death of the Policy Portfolio. (The Policy Portfolio is the 60/40 Portfolio).


Concluding Remarks

The current market environment, of low expected returns, might quicken the evolution in portfolio construction toward greater adoption of Multi-Asset Portfolios and a more absolute return focus.

Therefore, the value is in implementation, identifying the suitable underlying investment strategies to construct a truly diversified portfolio, within an appropriate fee budget.

Wealth management practices need to be suitably aligned with this value adding activity.


Happy investing.

Please read my Disclosure Statement


Global Investment Ideas from New Zealand. Building more Robust Investment Portfolios.

How good will the next decade be for Investing?

“Adjusted for risk—or, more precisely, the volatility stock investors had to bear—gains in the S&P 500 index since Dec. 31, 2009, are poised to be the highest of any decade since at least the 1950s.” as outlined in a recent Bloomberg article, The Bull Market Almost No One Saw Coming.

Who would had thought that back in 2009?


As the Bloomberg article highlights, it has been a relatively smooth ride of late; equity market volatility has fallen in line with the sharp decline in interest rates over the last ten years.

Also assisting the smoother ride in US equity markets has been the lower volatility in US economic activity. The US economy has expanded by 1.6% to 2.9% in each of the previous nine years, a similar level of economic activity is expected in 2019. According to Bloomberg, based on standard deviation, that’s the smallest fluctuation over any 10-year stretch in data going back to 1930.


In fact, the 2010s were the first decade without a bear market, defined as a 20% drop from any peak.

For the record, US equities:

  • experienced six separate 10% corrections over the 2010s (to date!); and
  • In total have returned 249% in the past 10 years, about 1.2 times the historical average.

The US is amid the longest bull market ever (longest period in history without a bear market).

These gains have come when least expected.


They also follow a -20% decline over the previous decade (2000 – 2009). Which includes a -52% decline of the Great Recessions (Global Financial Crisis (GFC) – measured over the period October 2007 – February 2009. As at October 2007 the S&P 500 Index had only climbed 11% since the beginning of the decade.


How Good has it been?

As Bloomberg note, based on the Sharpe ratio, which tracks the performance of equity markets relative to Government Bonds, adjusted for the volatility of equity markets, the current Sharpe Ratio of the S&P500 is the best among any decade since at least Dwight Eisenhower’s presidency.

The last decade has not been all plain sailing and includes the following market events: May 2010 flash crash, Europe’s sovereign debt crisis in 2011 and ’12, and China’s currency devaluation in 2015.

A previous Post covered these market declines: Equity Market Declines in Perspective

More recently global markets have had to endure an ongoing trade and technology dispute between the US and China.

Central Bank actions, including the lowering of interest rates and quantitative easing (i.e. buying of market securities, mainly fixed income) has helped ease markets anxiety. This is reflected in the decline of market volatility indices, such as the VIX Index.


What does the next decade look like?

The sharemarket and economy are linked.

Generally a bear market (i.e. 20% or more fall in value) does not occur without a recession (a recession is often defined as two consecutive quarters of negative economic growth).

Currently there are no excesses within the US economy, that normally precede a recession e.g. elevate inflation, excessive house prices, and high household debt levels.

This would tend to indicate that global equity markets can move higher.


Nevertheless, US equity market valuations are high, as are those of global Fixed Income markets.  This environment has resulted in many reporting the death of the traditional Balanced Portfolio (60% listed equities / 40% fixed income).

There are growing expectations that returns over the next decade will be lower than those experienced over the last ten years, as highlight in a previous Post: Low Return Environment Forecasted.

That Post has the following Table, GMO’s expected 7 year returns as at 31 July 2019. They estimated the real returns (returns after 2.2% inflation) for the following asset classes as follows:

Share Markets Annual Real Return Forecasts
US Large Capitalised Shares -3.7%
International Shares 0.6%
Emerging Markets 5.3%
Fixed Income Markets
US Fixed Income -1.7%
International Fixed Income Hedged -3.7%
Emerging Debt 0.7%
US Cash 0.2%

As GMO highlight, these are forward looking based on their reasonable beliefs and they are no guarantee of future performance.   Actual results may differ materially from those anticipated in forward looking statements.


It is very rare for decade of strong returns to be followed by a similar like decade.  Only time will tell.

Nevertheless, there is little doubt that a challenging investment environment is likely in the not too distant future. This Post outlines how to prepare and consider investing for such a challenging environment: Investing in a Challenging Investment Environment.


Happy investing.

Please read my Disclosure Statement


For a historical perspective of previous sharemarket corrections and bear markets please see my previous Post: History of Sharemarket corrections – An Anatomy of equity market corrections

Meanwhile, this Post, Recessions, Inverted Yield Curves and Sharemarket Returns, outlines the inter-play between the economic cycle and sharemarket returns.


Global Investment Ideas from New Zealand. Building more Robust Investment Portfolios.


Could Buffett be wrong?

As has been widely reported Warren Buffett frequently comments on the benefits of investing in low-cost index funds.

He’s reportedly instructed the trustee of his estate to invest in index funds. “My advice to the trustee couldn’t be more simple: Put 10% of the cash in short-term government bonds and 90% in a very low-cost S&P 500 index fund,” he noted in the Berkshire Hathaway’s 2013 annual letter to shareholders.


Not that I want to disagree with Buffett, I have enormous respect for him, incorporate many of his investment insights and philosophies into my own investment approaches. Albeit, I think he might be wrong on this account.

And this is not to say Index Funds do not have a part to play in a portfolio, nor that investment fees are not important. They are. I do think more portfolios should be invested along the lines of Endowments. Broad diversification is the key.


Following Buffett could be the right advice for a young person starting out with many years until retirement.  Such an investor would need to weather the volatility of being largely invested in equities, which is no mean achievement when equity markets can suffer falls of over 40%. A high equity strategy can become horribly undone.

Nevertheless, as one gets closer to retirement and is in retirement Buffett’s strategy is unsuitable.

Similarly Buffett’s strategy is not appropriate for a Pension Fund or Endowment. These Funds are in a similar position to those in retirement. Meanwhile, the equity allocation should be reduced as one gets closer to retirement.

The short comings of a higher equity allocation was highlighted in a recent article  by Charles E.F. Millard, who is a consultant to AQR Capital Management, LLC.


Once an investor needs to take capital or income from a portfolio volatility of the equity markets can wreak havoc on a Portfolio’s value, and ultimately the ability of a portfolio to meet its investment objectives.

The key point that Millard makes is that Pension Funds and Endowments are required to make periodic payment obligations. So do those in retirement, they either draw capital or income from the portfolio to sustain a desired standard of living.


Ultimately, it the drawing of an income or the payments by Endowments that consume most of the investment returns. “This is why assets don’t just mushroom over time.”

As Millard explains, “each year endowments usually pay out at least 5% of their holdings, and the institutions they support tend to count on those funds. That changes the situation an awful lot.”

Let’s look at the math. Millard explains”

and assume that each year the endowment pays out 5% of its assets. In that case, starting at $1 million, the endowment would not have the $5.3 billion Buffett imagines. Rather, after having paid out almost $145 million along the way, the endowment would have less than $150 million remaining”

Still a great result, but far from the billions assumed by Buffett.

It is also worth noting that a Pension’s obligation (liability) can continue to grow as employees retire and live longer. The Pension Fund has no ability to reduce its payouts and must manage this risk.


This is where market volatility comes into play, particularly drawdowns – a large fall in the value of the market.

“In a prolonged stock market drawdown, those growing benefit payments will consume a larger share of the shrunken plan assets.  So, they can’t take too much solace in long-run optimism when in the intermediate run they’re already paying out much of their capital.”


This is a key point. You can’t take comfort in the long-term returns from equities when you are running out of money!

Equity markets do fall in value and this is why institutions with meaningful annual pay-out obligations are not invested only in equities.


No argument that equities will not outperform over the longer term, this is highly likely. Yet this observation fails to recognise the volatility inherent in equities.

Millard:

“Over Buffett’s 77 years investing, the endowment CIO would see fund assets decline in 23 out of 77 years (when equity returns didn’t cover the 5% distribution), and in the average bad year, the fund would shrink by -12%. But at least an endowment may be able to reduce its spending; a pension fund can’t, so in a bad year, the fraction of pension assets that must be paid out increases substantially. This is why most institutional investors subscribe to a concept that Buffett seems to hate – diversification. He’s said it’s “a protection against ignorance.” We think it is more a protection against hubris.”

Diversification is key.

“It is worth noting that Institutions do not seek to maximize potential long-term returns, without regard to risks. They often seek to maximize the likelihood that they can meet their payout obligations. They seek to be reliable payers of those obligations. And in the case of pensions, they also seek to make it possible for the employer to have somewhat predictable and affordable contribution obligations. A portfolio of stocks alone doesn’t do that. That’s why asset class diversification is a bedrock principle of modern investing.


In short, institutional investors have different goals and obligations to Buffett.

For those in retirement, their goals and obligations are more closely aligned with the Pension Fund and Endowment, than Buffett and Berkshire Hathaway. Those closer to retirement need to make sure that market volatility does not impact them and their ability to sustain the standard of level they wish to maintain in retirement.


Happy investing.

Please see my Disclosure Statement


Global Investment Ideas from New Zealand. Building more Robust Investment Portfolios.

Recessions, inverted yield curves, and Sharemarket returns

Fears of economic recession, particularly in the US, peaked over the final three months of 2018.

Nevertheless, talk of economic recession has now faded into the background after the US Federal Reserve hit the pause button to further interest rate increases in January of 2019. The Fed is not expected to raise interest rates again in 2019.

This is not to say that a recession will not occur, it will at some stage, just as night follows day. The economic/business cycle has not been conquered.

Nevertheless, the timing of the next recession is unknown. Take Australia for example, their last recession was over 28 years ago. New Zealand is over 9 years since their last recession.

With regards to the US, in July of this year the US economy will enter its longest period in history without incurring a recession. Their economy remains on a sound footing: interest rates remain low, the US consumer is confident, businesses are investing, the Government is increasing spending, and forward looking indicators of economic activity remain positive. Lastly, housing activity is likely to pick up over the second half of 2019.


What is a Recession?

A recession is defined as at least two consecutive quarters of declining economic growth. The US National Bureau of Economic Research (NBER) defines a recession as “a significant decline in economic activity spread across the economy, lasting more than a few months, normally visible in real gross domestic product (GDP), real income, employment, industrial production and wholesale-retail sales.”


A recent article by the Capital Group: Preparing for the next recession: 9 things you need to know provides a good overview of the ins-and-outs of economic recession.


The good news, as Capital highlight, recessions generally aren’t very long.

Capital undertook analysis of 10 US economic cycles since 1950. This analysis showed that recessions have lasted between eight and 18 months, with the average spanning about 11 months. Unfortunately New Zealand’s history is a little more chequered than the US.

Investors with a long-term investment horizon, should expect to experience a number recession over their investment horizon and therefore look through the full economic cycle. Fortunately, for most of us, we spend more time in economic expansion than in recession.

Capital note, “over the last 65 years, the U.S. has been in an official recession less than 15% of all months.”

The following graph highlights the average length, total growth, and returns from the average stock market return over the average recession and economic expansion.

Notably, “equity returns can even be positive over the full length of a contraction, since some of the strongest stock rallies have occurred during the late stages of a recession.”

The human cost of economic recession is provided in the form of jobs lost and this should not be forgotten.


Economic cycles Capital.jpg


From a sharemarket perspective, a bear market, defined as a 20% or more fall in value, usually overlaps with recessions.

Share markets tend to lead the economic cycle, given they are forward looking. Sharemarkets on average peak six months prior to the onset of a recession. They continue to fall during the early stages of a recession.

The recovery in sharemarkets often takes hold while the economy is still in recession (economic growth is still contracting).

The initial bounce in sharemarkets is often a period of strong performance and occurs before there is any hard evidence of a pickup in economic activity.

The following graph presents the above sequencing and overlapping nature of sharemarket returns and recessions.

Sharemarket returns and recession cycles.png


Having said all that, stock markets are not good predictors of economic recession i.e. a sharp fall in global sharemarket does not mean there will be an onset of global economic recession.

This is captured by the well know quote from Paul Samuelson: “The stock market has predicted nine of the last five recessions.”


Sharemarket Returns and Inverted Yield Curves

There has been a lot of discussion over the last twelve months about the implications of an inverted US yield curve. (An inverted yield curve is when longer-term interest rates (e.g. 10 years) are lower than shorter-term interest rates (e.g. 2 years or 3 months). A normal yield curve is when longer-term-interest rates are higher than shorter-term-interest rates.

Parts of the US yield curve are currently inverted, and this inversion has increased over recent days.

The significance of this is that prior to the last 7 US recessions the yield curve has inverted prior each time. An inverted yield curve has by and large been a good predictor of recession.

Nevertheless, not every time the yield curve inverts does a recession follow and on average the inversion of the yield curve occurs 12 months prior to a recession.


The following analysis undertaken by Wellington Management looks at the performance of the US sharemarket in relation to yield curves inversions.

The period of analysis is from the 1950s at which time the US Federal Reserve gained full, independent control over interest rates from the US Treasury. As Wellington note, “it was after this transition that the yield curve became an effective tool for gauging the impact of monetary policy on the economy and the prospect of a recession.”

Wellington present the following analysis and the Table below:

  • “As shown in the third column (of Table below), the S&P 500 peaked ahead of a yield-curve inversion only twice (1959 and 1973).
  • “The median time between inversion and peak equity returns was 17 months, and in several cases the market peaked almost two years or more after inversion.”
  • “Aggregate equity returns post-inversion have been partly dependent on the length of time between the initial inversion and the start of the recession.”
  • “Since returns tend to be negative right around the time a recession begins, the instances in which there was a shorter period between the initial inversion and the start of the recession were more likely to have a negative return.”


Just like there is a period of time between economic recession and an inverted yield curve, the sharemarket often peaks after the yield curves inverts.

Sharemarket returns and inverted yield curves.png


Back to the Capital article, for it also runs through a number of other recession related questions.

Of interest are:

What economic indicators can warn of a recession?

  • Capital outline some generally reliable signals worth watching closely, such as an inverted yield curve, corporate profits, unemployment, and leading economic indices.
  • Importantly it is appropriate to look at and consider several different economic indicators.


What Causes Recessions?

  • There are many reasons for a recession, chief amongst them are rising interest rates, particularly by Central Banks such as the US Federal Reserve and Reserve Bank of New Zealand, imbalances within an economy e.g. excess housing prices, high debt levels
  • Every economic cycle is unique, but anything that impacts on corporate profits or consumer spending, such as rising unemployment, are factors to consider.


Just remember is it notoriously difficult to predict economic recession and they are normally the result of a number of factors that have a cascading effect leading to an economic downturn.


The following Kiwi Investor Blog Posts maybe of interest to those wanting a better understanding of inverted yield curves, leading economic indicators, and historical performance of equity market corrections.

Recession predictability of inverted yield curves and other economic indicators to considered:


Analysis of Sharemarket corrections and market declines


Lastly the Capital article provides some suggestions as to how to position your portfolio for a recession. I think it is exceedingly difficult to finesse a portfolio in the expectations of a recession.

From my perspective, the following is most critical:

  • Maintain a long-term perspective;
  • Implement a balanced and broadly diversified portfolio. Portfolio diversification does not come from investing in more and more asset classes. This has diminishing diversification benefits. True portfolio diversification is achieved by investing in different risk factors that drive the asset classes e.g. duration (movements in interest rate), economic growth, low volatility, value, and growth. Investors are compensated for being exposed to a range of different risks;
  • Know you risk tolerance: what level of volatility in capital are you prepared to handle without changing your mind;
  • Understand your risk capacity: the amount of risk you need to take in order to reach your financial goals;
  • Implement a goals-based investment approach, where success is measured on how you are tracking relative to your investment goals, rather than market index performances; and
  • Always maintain a high quality portfolio, with plenty of liquidity, and limit the level of turnover across the portfolio e.g. amount of trading (buying and selling)


A good advisor should be able to help you with the above and see you through bouts of sharemarket volatility, including a recession environment.


Happy investing.


Please see my Disclosure Statement


Global Investment Ideas from New Zealand. Building more Robust Investment Portfolios.

cropped-title-picture-enhanced.jpg

The Regret Proof Portfolio

Based on analysis involving the input of Daniel Kahneman, Nobel Memorial Prize-winning behavioural economist, a “regret-proof” investment solution would involve having two portfolios: a risky portfolio and a safer portfolio.

Insurance companies regularly implement a two-portfolio approach as part of their Liability Driven Investment (LDI) program: a liability matching portfolio and a return seeking portfolio.

It is also consistent with a Goal Based Investing approach for an individual: Goal-hedging portfolio and a performance seeking portfolio. #EDHEC

Although there is much more to it than outlined by the article below, I find it interesting the solution of two portfolios came from the angle of behavioural economics.

I also think it is an interesting concept given recent market volatility, but also for the longer-term.


Background Discussion

Kahneman, discussed the idea of a “regret-proof policy” at a recent Morningstar Investment Conference in Chicago.

“The idea that we had was to develop what we called a ‘regret-proof policy,’” Kahneman explained. “Even when things go badly, they are not going to rush to change their mind or change and to start over,”.

According to Kahneman, the optimal allocation for someone that is prone to regret and the optimal allocation for somebody that is not prone to regret are “really not the same.”

In developing a “regret-proof policy” or “regret minimization” Portfolio allows advisors to bring up “things that people may not be thinking of, including the possibility of regret, including the possibility of them wanting to change their mind, which is a bad idea generally.”


In developing a regret proof portfolio, they asked people to imagine various scenarios, generally bad scenarios, and asked at what point do you want to bail out or change your mind.

Kahneman, noted that most people — even the very wealthy people — are extremely loss averse.

“There is a limit to how much money they’re willing to put at risk,” Kahneman said. “You ask, ‘How much fortune are you willing to lose?’ Quite frequently you get something on the order of 10%.”


Investment Solution

The investment solution is for people to “have two portfolios — one is the risky portfolio and one is a much safer portfolio,” Kahneman explained. The two portfolios are managed separately, and people get results on each of the portfolios separately.

“That was a way that we thought we could help people be comfortable with the amount of risk that they are taking,” he said.

In effect this places a barrier between the money that the client wants to protect and the money the client is willing to take risk on.

Kahneman added that one of the portfolios will always be doing better than market — either the safer one or the risky one.

“[That] gives some people sense of accomplishment there,” he said. “But mainly it’s this idea of using risk to the level you’re comfortable. That turns out to not be a lot, even for very wealthy people.”


I would note a few important points:

  1. The allocation between the safe and return seeking portfolio should not be determined by risk profile and age alone. By way of example, the allocation should be based primarily on investment goals and the client’s other assets/source of income.
  2. The allocation over time between the two portfolios should not be changed based on a naïve glide path.
  3. There is an ability to tactically allocate between the two portfolios. This should be done to take advantage of market conditions and within a framework of increasing the probability of meeting a Client’s investment objectives / goals.
  4. The “safer portfolio” should look more like an annuity. This means it should be invested along the lines that it will likely meet an individual’s cashflow / income replacement objectives in retirement e.g. a portfolio of cash is not a safe portfolio in the context of delivering sufficient replacement income in retirement.


Robust investment solutions, particularly those designed as retirement solutions need to display Flexicurity.   They need to provide security in generating sufficient replacement income in retirement and yet offer flexibility in meeting other investment objectives e.g. bequests.  They also need to be cost effective.

The concepts and approaches outlined above need to be considered and implemented in any modern-day investment solution that assists clients in achieving their investment goals.

Such consideration will assist in reducing the risk of clients adjusting their investment strategies at inappropriate times because of regret and the increased fear that comes with market volatility.

Being more goal focussed, rather than return focused, will help in getting investors through the ups and downs of market cycles. A two-portfolio investment approach may well assist in this regard as well.


Happy investing.


Please see my Disclosure Statement

Global Investment Ideas from New Zealand. Building more Robust Investment Portfolios.


2018 was a shocking Year

Well its official, 2018 was a shocking year in which to make money. Not for some time, 1972, has so many asset classes failed to deliver 5% or more in value.

In terms of absolute loses, e.g. Global Financial Crisis (GFC 2007/08), investors have incurred far worst returns than 2018, nevertheless, as far as breadth of asset classes failing to deliver upside returns, 2018 is historical.


Here is a run through the numbers:

International Equities were down around 7.4% in local currency terms in 2018:

  • The US was one of the “better” performing markets, yet despite reaching historical highs in January and then again in September, had its worst year since the GFC, December was is its worst December return outcome since the 1930s.
  • The US market entered 2018 on a record run, experiencing it longest period in history without incurring a 5% or more fall in value.  This was abruptly ended in February.
  • During the year the US market reached its longest period in history without incurring a Bear market, defined as a fall in value of more than 20%. Albeit, it has come very close to ending this record in recent months.
  • Elsewhere, many global equity markets are down over 20% from their 2018 peaks and almost all are down over 10%.
  • Markets across Europe and Japan fell by over 12% – 14% in 2018
  • The US outperformed the rest of the world given its better economic performance.
  • The New Zealand sharemarket outperformed, up 4.9%!

Commodities, as measured by the Bloomberg Index, fell over 2018. Oil had its first negative year since 2015, falling 20% in November from 4 year highs reached in October. Even Gold fell in value.

Hedge Fund indices delivered negative returns.

Global credit indices also delivered negative returns, as did High Yield

Emerging Market equities where negative, underperforming developed markets.

Global listed Property and Infrastructure indices also returned negative returns.

Fixed Interest was more mixed, Global Market Indices returned around 1.7%:

  • US fixed interest delivered negative returns for the year, as did US Inflation Protected fixed interest securities. US Longer-term securities underperformed shorter-term securities.
  • NZ fixed interest managed around +4.7% for the year.

The US dollar was stronger over 2018, this provided some relief for those investing outside of their home currency and maintained a low level of currency hedging.

The above analysis does not include the unlisted asset classes such as Private Equity, Unlisted Infrastructure, and Direct Property investments.


Two last points:

  • Balance Bear, under normal circumstances, fixed interest, particularly longer-term securities, would perform strongly when equity markets deliver such negative returns as experienced in 2018. This certainly occurred over the last quarter of 2018 when concerns over the outlook for global economic growth became a key driver of market performance. Nevertheless, over the year, fixed interest has failed to provide the usual diversification benefits to a Balanced Portfolio (60% Equities and 40% Fixed Income). Many Balanced Portfolios around the world delivered negative returns in 2018 and failed to beat Cash.
  • Volatility has increased. Research by Goldman Sachs highlights this. In 2018 the US S&P 500 Index experienced 110 days of 1%+ movements in value, this compares to only 10 days in 2017.


Happy investing.


Please see my Disclosure Statement

Global Investment Ideas from New Zealand. Building more Robust Investment Portfolios.


Recent Market volatility and end of year market and economic forecasts

There are lots of economic and market forecasts at this time of the year. Many are easily accessed on the internet.

Does anyone care about these forecasts? Or do we place too much emphasis on these forecast? These topics are covered in a recent Institutional Investor article. Some good points are made.


The current market volatility is likely to be front of mind presently for many investors. Others may be seeing it as an opportunity.  What ever your view of 2019, a longer term perspective should always be maintained.

Either way, it has been a tough year to make money .


Most likely, your view of the current market volatility is closely tied to your forecast for 2019.

On this note, there are number of reasons to be “relaxed” about the current market volatility as outlined in the recent Think Advisor article.


Why should we be relaxed about the current bout of volatility? The most pertinent reasons from the article are as follows:

The US economy is still strong

US Economic growth accelerated in 2018 while the rest of world slowed. Global growth is expected to moderate in 2019 from the current pace in 2018.

Albeit, the US economy is still strong with unemployment at its lowest level since 1969, consumer and business confidence remains healthy, forward looking indicators are supportive of ongoing economic growth.

Although growth is slowing in Europe and China the environment remains supportive of ongoing economic expansion.

Global sharemarkets appear to have already adjusted for a more moderate level of global economic growth in 2019.


Stock Fundamentals are okay

Global corporate earnings are forecast grow over the next twelve months, supported by the economic backdrop outlined above.

As alluded to above, value has appeared in many global markets given recent declines.


Yield curve inversion

Markets are pre-occupied with the possibility of a US inverted yield curve. This appears overdone. Yield curve Inversion is when the yield (rate of interest) is lower on longer dated fixed interest securities compared to shorter dated securities. Under normal circumstance longer dated securities have a higher yield than shorter dated securities.

As highlighted previously  an inverted yield curve is a necessary but not sufficient pre-condition to recession. Not every yield curve inversion is followed by a recession .

There is also a considerable time lag between yield curve inversion and economic recession. A period of time in which sharemarkets have on average performed strongly.

Lastly, the traditional measure of yield curve inversion, 3 month yield vs 10 year yield, is not inverted!


Of the reasons provided in the article, the above are the most relevant and worthy of taking note of.

Nevertheless, global trade is a key source of the current market volatility and is likely to remain so for sometime.  Likewise it may take time for markets to gain comfort that global economic growth has stabilised at a lower rate of expansion. Therefore, continued market volatility is likely.

Alternatively, a pause in the US Federal Reserve raising short term interest rates would also likely provide a boost to global sharemarkets.


PIMCO, as recently reported, highlight that the risk of a recession in the US has climbed in 2019.

This prediction is made in the context that the US is nearing a decade long period of economic expansion, the longest period in its history without experiencing an economic recession (defined as two consecutive quarters of negative economic growth).

PIMCO note “The probability of a U.S. recession over the next 12 months has risen to about 30 percent recently and is thus higher than at any point in this nine-year-old expansion, Even so, the models are flashing orange rather than red.”

“The last few months have given us a sense of the types of risks that are out there, that both the economy and markets are going to face in 2019,” ….. “At a minimum, like we have seen this year, expect ongoing volatility and that’s true across all segments of the financial markets.”


Happy investing.


Please see my Disclosure Statement


Global Investment Ideas from New Zealand. Building more Robust Investment Portfolios.

It has been a tough Year to make Money

2018 has been a tough year in which to make money.

2018 is “The worst time to make money in the markets since 1972” according to a recent Bloomberg article.

“Things have not been this bad since Richard Nixon’s presidency”.

Research undertake by Ned Davis Research, who places markets into eight big asset classes, everything from bonds (Fixed Interest) to US and international stocks and commodities, not one of them is “on track to post a return this year of more than 5%, a phenomenon last observed in 1972”….

As they note, in terms of absolute loses, think Global Financial Crisis (GFC 2007/08), investors have incurred far worst returns in 2018, nevertheless, as far as breadth of asset classes failing to deliver upside returns, “2018 is starting to look historic.”

Nothing has worked this year.  Year to date: global equities are down, as are emerging markets, hedge fund indices, global commodities (even oil), International Credit, Global High Yield, US Fixed Interest, US Inflation Protected Bonds, while Global Aggregate Fixed Interest have eked out a small gain.  Investments into unlisted assets have been more rewarding.


“That’s all but unique in history. Normally when something falls, something else gains. Amid the financial catastrophe of 2008, Treasuries rallied (increased in value). In 1974, commodities were a bright spot. In 2002, it was REITs. In 2018, there’s nowhere to run.”


Outcomes are a little better if you are a New Zealand (NZ) based investor, Cash is on track to return around 2%, 6 month Term Deposits 3.5%, NZ Fixed Interest is up around 4%, and the NZ Sharemarket is currently up 3%.  Still they are all short of 5%.  Meanwhile the recent strength in the NZ dollar has detracted from offshore returns.


It has been a tough year, global equities reached all-time highs in January, fell heavily in February and March, only to recover up to October, with the US Sharemarket reaching a new historical high.

Since October yearly gains have been erased due to a number of factors, some, but not all, of these factors are briefly outlined below.


In short, as highlighted by a recent Barron’s article markets appear to be panicking over everything.

Recent market drivers in brief:

  • Primarily concern for Sharemarkets has been a reduction in global economic growth expectations. Global investor sentiment toward the pace of global economic growth in 2019 has become more cautious over recent months. Global sharemarkets have adjusted accordingly. Albeit, the sharmarket adjustment does appear to be overdone relative to the likely moderating in global growth in 2019, which has also  largely been anticipated.
  • Global Trade concerns continue to negatively impact global markets e.g. Australia and commodities, primarily the ongoing negotiations between the US and China are a source of market volatility and uncertainty.
  • Brexit more recently. The UK are going to have to pay a price for leaving the EU, why? too stop other countries ever considering leaving the EU as a viable option. Unfortunately, while Brexit is an important issue and will be a source of volatility, the negative consequences will largely sit with the UK rather than the rest of the world.
  • There has been considerable oil price volatility, the price of oil fell by over 20% in November.
  • There has also been uncertainty as to likely pace of increases in the Federal Funds Rate by the US Federal Reserve (US Central Bank).


Inverted Yield Curve

Lastly, markets have also latched onto the inversion of the US Yield curve.

Inversion is when the yield (rate of interest) is lower on longer dated fixed interest securities compared to shorter dated securities. Under normal circumstance longer dated securities have a higher yield than shorter dated securities.

An “inverted” yield curve has been useful, though not perfect, in predicting economic recession and equity bear markets (when sharemarkets fall in value of over 20%),


On this occasion the market has focused on the three year security versus the five year security.

Normally, the market focuses on the three month versus the 10 year security as the best predictor of economic recession.  For a further discussion see Risk of Economic Recession and Inverted Yield Curve and US Recession warning. An inverted yield curve is a necessary but not sufficient condition in predicting a recession, and there is often a lag.


As the Barron article highlights: “Since 1965, the three-year yield has been higher than the five-year on seven different occasions. In 1973, the stock market had already sunk into a recession. In the other six instances, the median distance to a recession was 25 months—or more than two years. The S&P 500 went on to gain a median 20% over the 24 months following such an inversion. “Historically, not only have returns tended to be very strong, but the bear market has generally been years away,”


Happy investing.


Please see my Disclosure Statement


Global Investment Ideas from New Zealand. Building more Robust Investment Portfolios.