Coronavirus – Financial Planning Challenges

For those near retirement this year’s global pandemic has thrown up new challenges for them and their Financial Advisor.

Early retirement due to losing a job, the running down of emergency funds, and a low interest rate environment are new challenges facing those about to retire.

Events this year are likely to have significant repercussions for how individuals conduct their financial planning.  Specifically, how they approach spending and saving goals.

The pandemic will likely have lasting implications for how people think about creating their financial and investment plans, and therefore raises new challenges for the Advisors who assist them.

These are the key issues and conclusions outlined by Christine Benz, director of personal finance for Morningstar, in her article, What the Coronavirus Means for the Future of Financial Planning.

In relation to the key issues identified above, Benz writes “All of these trends have implications for the way households—and the advisors who assist them—manage their finances. While the COVID-19 crisis has brought these topics to the forefront, their importance is likely to persist post-pandemic as well.”

Although the article is US centric, there are some key learnings, which are covered below.

How the Pandemic Has Impacted Financial Planning for Emergencies

The Pandemic has highlighted the importance of emergency funds as part of a sound financial plan and the difficulties that many individuals and households face in amassing these “rainy-day funds.”

Lower income families are more at-risk during times of financial emergencies.  Research in the US found that only 23% of lower-income households had emergency funds sufficient to see them through three months of unemployment.  This rises to 52% for middle income households.

It is advisable to have emergency funds outside of super.

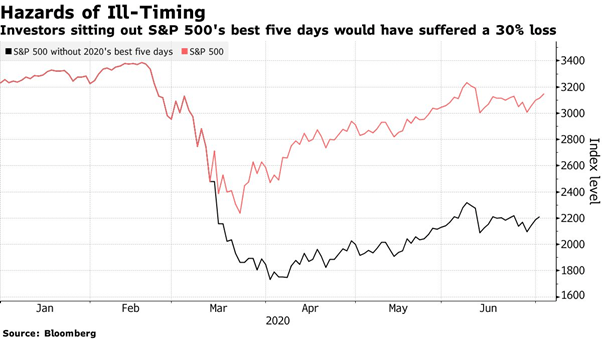
The Morningstar article highlights “Withdrawing from retirement accounts is suboptimal because those withdrawn funds can’t benefit from market appreciation—imagine, for example, the worker who liquidated stocks from a retirement account in late March 2020, only to miss the subsequent recovery.”

An emergency fund helps boost peace of mind and provides a buffer and the confidence to maintain longer-term retirement goals.

Financial Advisors can assist clients in setting saving goals to amass an emergency fund, which is specific to their employment situation, and how best to invest these funds so they are there for a rainy day.

From an industry and Policymaker perspective, and reflecting many households struggle to accumulate emergency reserves, Morningstar raised the prospect of “sidecar” funds as potentially part of the solution.

Sidecars “would be for employees to contribute aftertax dollars automatically to an emergency fund. Once cash builds up to the employee’s own target, he could direct future pretax contributions to long-term retirement savings. Automating these contributions through payroll deductions may make it easier for individuals to save than when they’re saving on a purely discretionary basis.”

The concept of sidecar funds has recently been discussed in New Zealand.

Financial Planning for Early Retirement

The prospect of premature retirement will pose an urgent challenge for some clients. 

Although those newly unemployed will consider looking for a new job some may also consider whether early retirement is an option.

The US experience, to date, has been that those workers 55 and older have been one of groups most impacted by job losses.

Morningstar highlight that early retirement is not always in an individual’s best interest, actually, working a few years longer than age 65 can be “hugely beneficial to the health of a retirement plan,”….

They note the following challenges in early retirement:

  • Lost opportunity of additional retirement fund contributions and potential for further compound returns; and
  • Earlier withdrawals could result in a lower withdrawal rate or reduce the probability the funds lasting through the retirement period. 

Financial Advisors can help clients understand the trade-offs associated with early retirement and the impacts on their financial plans.  Often the decision to retire is about more than money.

Individual circumstances in relation to access to benefits, pensions, health insurance, and tax need to be taken into consideration.  Given this, a tailored financial plan, including the modelling of retirement cashflows on a year-to-year basis would be of considerable value.

Accommodating Low Yields in a Financial Plan

The low interest rate (yield) environment is a challenge for all investors. 

Nevertheless, for those in retirement or nearing retirement is it a more immediate challenge.

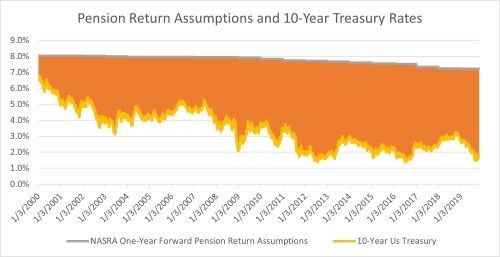
Return expectations from fixed income securities (longer dated (maturity) securities) are very low.  Amongst the best predictor of future returns from longer dated fixed income securities, such as a 10-year Government Bonds, is the current yield.

In the US, the current yield on the US Government 10-year Treasury Bond is not much over 1%, in New Zealand the 10-Year Government Bond yields less than 1%.  Expected returns on higher quality corporate bonds are not that much more enticing.

As Morningstar note, “These low yields constrain the return potential of portfolios that have an allocation to bonds and cash, at least for the next decade.“

The low yield and return environment have implications as to the sustainability of investment portfolios to support clients throughout their retirement.

The impact of low interest rates on “withdrawal rates” is highlighted in the graph below, which was provided by Morningstar in a separate article, The Math for Retirement Income Keeps Getting Worse, Revisiting the 4% withdrawal rule

The 4% withdrawal rate equals the amount of capital that can be safely and sustainably withdrawn from a portfolio over time to provide as much retirement income as possible without exhausting savings.

For illustrative purposes, the Morningstar article compares a 100% fixed income portfolio from 2013 and 2020 to reflect the impact of changes in interest rates on the sustainability of investment portfolios assuming a 4% withdrawal rate. 

As Morningstar note, since 2013 investment conditions have changed dramatically. When they published a study in 2013 the 30-year Treasury yield was 3.61% and expected inflation was 2.32%. Investors therefore received a real expected payout of 1.29%.

When they refreshed the study in 2020, those figures are 1.42% and 1.76%, respectively.  This implies a negative expected return after inflation.

The graph below tracks the projected value of $1 million dollars invested in 2013 and 2020.  The prevailing 30-year Treasury yields for July 2013 and October 2020, as outlined above, are used to estimate income for each portfolio, respectively, over time.  A “real” 4% withdrawal rate is assumed i.e. the first years $40k withdrawal grows with the inflation rates outlined above.

As can be seen, the 2013 Portfolio lasts up to 30 years, the 2020 Portfolio only 24 years, highlighting the impact of lower interest rates on the sustainability of an investment portfolio.

Financial Advisors can help in determining the appropriate withdrawal rates from an investment portfolio and the trade-offs involved.  They may also be able to suggest different investment strategies to maintain a higher withdrawal rate and the risks associated with this.

This may also include the purchase of annuities, to manage longevity risk (the risk of running out of money in retirement) rather than from the perspective of boosting current portfolio income.

Morningstar suggests that new retirees “should be conservative on the withdrawal rate front, especially because the much-cited “4% guideline” for portfolio withdrawal rates is based on market history that has never featured the current combination of low yields and not-inexpensive equity valuations.”

The 4% withdrawal rate is an industry “rule of thumb”.  Further discussion on the sustainability of the 4% withdrawal rate can be found here.

I have posted extensively about the low expected return environment and the challenges this creates for the Traditional Portfolio of 60% Equities and 40% Fixed Income.

The following Post on what investors should consider doing in the current market environment may be of interest. This Post outlines some investment strategies which may help in maintaining a higher withdrawal rate from an investment portfolio.

Likewise, this Post on how greater customisation of the client’s invest solution is required and who would benefit most from targeted investment advice may also be of interest.

Lastly, Wealth Management.com covers Benz’ article in Retirement Planning in a Pandemic.

Please read my Disclosure Statement

Global Investment Ideas from New Zealand. Building more Robust Investment Portfolios.

The value of Emerging Markets within a Robust Portfolio – The Attraction of Emerging Markets

Canada’s largest Pension Funds plan to increase their investments into emerging markets over the following years.  Asia, particularly India and China, are set to benefit.

The increased exposures are expected to be achieved by increasing portfolio target allocations to emerging markets, partnering on new deals, and boosting staff with expertise to the area.

The expected growth in the share of global economic activity in the years ahead and current attractive sharemarket valuations underpin the case for considering a higher weighting to emerging markets within portfolios.  Particularly considering the low interest rate environment and stretched valuation of the US sharemarket.  This dynamic is very evident in the market return forecasts provided below.

Additionally, emerging markets bring the benefits of diversification into different geographies and asset classes for investors, including both public and private markets.

Increasing allocations to Emerging Markets

As covered in this Pension & Investment ((P&I) online article emerging markets are set to become a large share of Canadian Pension Plan’s portfolios. 

As outlined in the P&I article, the Ontario Teachers’ Pension Plan (C$201.4 billion) is investing significantly into emerging markets, particularly Asia.  Their exposure to emerging markets fluctuates between 10% and 20% of the total Portfolio.

The Fund’s investments across the emerging markets includes fixed income, infrastructure, and public and private equities.  They plan to double the number of investment staff in Asia over the next few years, they already have an office in Hong Kong. 

The Canada Pension Plan Investment Board (CPPIB) (C$400.6 billion) anticipates up to one-third of their fund to be invested in emerging markets by 2025.

CPPIB sees opportunities in both equity and debt.  Investments in India are expected to grow, along with China.

The Attraction of Emerging Markets

The case for investing into emerging markets is well documented: rising share of global economic activity, under-representation in global market indices, and currently very attractive sharemarket valuations.

Although the current global economic and pandemic uncertainty provides pause for concern, the longer-term prospects for emerging market are encouraging.

From the P&I article “CPPIB estimates the share of global gross domestic product represented by emerging markets will reach 47% by 2025 and surpass the GDP of developed economies by 2029”.

Based on the expected growth outlook CPPIB “feel there are attractive returns available over the long term to those investors who take the time to study the characteristics and fundamentals of these markets and are able to identify trends and opportunities in those markets,”…..

CPPIB also highlight the benefit of diversification into different geographies and asset classes for the Fund.

Lastly, the valuations within emerging market sharemarkets are attractive. 

This is highlighted in the following Table from GMO, which provides their latest (Sept 2020) Forecasts Annual Real Returns over the next 7 years (after inflation).

As can be seen, emerging market is one of only two asset classes that provides a positive return forecast.  Emerging market value offers the prospect of the highest returns over the next 7 years.  As GMO highlight, the forecasts are subject to numerous assumptions, risks and uncertainties.  Actual results may differ from those forecasted.

Nevertheless, GMO provided the following brief commentary in this LinkedIn Post “From an absolute perspective, broad markets in the US are frighteningly bad; non-US developed markets, however, are not as bad, but that is faint praise, as our official forecast for this basket is also in negative territory. “Safe” bond forecasts are not much better. With yields this low, the very foundational justification for holding bonds — as providers of income and/or as anti-correlated money makers when equities decline — has been shaken to its core. The traditional 60/40 portfolio, consisting of heavy doses of US and International stocks and Government Bonds, is poised for a miserable and prolonged period.”

GMO Annual Real Returns over 7 years

In February 2020, GMO advised that it was time to move away from the Balanced Portfolio, as outlined in this Kiwi Investor Blog Post. GMO provide a historical performance of the traditional Balanced Portfolio (60% equities and 40% fixed income).  Overall, the Balanced Fund is riskier than people think.

In the LinkedIn Post mentioned above, GMO comment that “Our Asset Allocation team believes this is the best opportunity set we’ve seen since 1999 in terms of looking as different as possible from a traditional benchmarked portfolio.”  Where the traditional benchmarked portfolio is the Balanced Portfolio of 60% equities and 40% fixed income.

Why the Balanced Portfolio is expected to underperform and potential solutions to enhancing future portfolio returns is covered in this Post.

Please read my Disclosure Statement

Global Investment Ideas from New Zealand. Building more Robust Investment Portfolios.

Is a value bias part of the answer in navigating today’s low interest rates?

The Value Factor (value) offers the potential for additional returns relative to the broader sharemarket in the years ahead.

Exploring an array of different investment strategies and questioning the role of bonds in a portfolio are key to building a robust portfolio in the current low interest rate environment.

There will also be a need to be more dynamic and flexible to take advantage of market opportunities as they arise.

From this perspective, a value tilt within a portfolio is one investment strategy to consider in potentially boosting future investment returns.

The attraction of Value

Evidence supporting a value tilt within a robust portfolio is compelling, albeit opinion is split.

Nevertheless, longer-term, the “Rotating into Value stocks offers substantial upside in terms of return versus the broad market” according to GMO.

GMO presents the case for a value tilt to navigate today’s low interest rates in their Second Quarter 2020 Letter, which includes two insightful articles, one by Ben Inker and another by Matt Kadnar. 

Value is at cheapest relative to the broader market since 1999, based on GMO’s analysis.  Value is in the top decile of attractiveness around the world, as highlighted in the following figure.

Spread of Value for MSCI Regional Value Factors (GMO)

As of 6/30/2020 | Source: MSCI, Worldscope, GMO

Is Value Investing Dead

As mentioned, the opinion on value is split.

A research paper by AQR earlier in the year addressed the key criticisms of value, Is (Systematic) Value Investing Dead?

For a shorter read on the case for value Cliff Asness, of AQR, Blog Post of the same title is worth reading.

AQR’s analysis is consistent with GMO’s, as highlighted in the Graph and Table below.

The Graph below measures the Price-to-Book spread of the whole US sharemarket from December 1967 to March 2020.

This spread was at the 100th percentile versus 50+ years of history on the 31 March 2020 i.e. value is at it cheapest based on 50 years of data.

Price-to-Book Spread (AQR)

Asness’s Blog Post highlights “expensive stocks are sometimes only <4x as expensive as the cheap stocks, the median is that they are 5.4x more expensive, but today they are almost 12x more expensive.” (March 2020).

It is the same story when looking at different measures of value for the US sharemarket, as highlighted in the Table below.

Value is at its cheapest on many measures (AQR)

‘Don’t ask the barber whether you need a haircut’

This quote by Warren Buffett springs to mind when considering the analysis from GMO and AQR, both being value orientated investors.  As Asness states, AQR has a horse in the race.

However, as outlined in his Post, he undertakes the same analysis as above and controls for, just to name a few:

  • Excluding all Technology, Media, and Telcom Stocks
  • Excluding the largest stocks
  • Excluding the most expensive stocks
  • Industry bets
  • Industry neutrality
  • Quality of company

Analysis is also undertaken using other measures of value, Price-Sales, P/E, using trailing and forecast earnings (these are in addition to Price-Book).

The attraction of value remains based on different measures of value and when making the adjustments to market indices as outlined above.

Asness argues value is exceptionally cheap, probably the cheapest it has ever been in history (March 2020).

The AQR analysis shows this is not because of an outdated price-to-book nor because of the dominance of highly expensive mega-cap stocks.  Investors are paying more than usual for stocks they love versus the ones they hate.  There is a very large mispricing.

The AQR research paper mentioned above, looked at the common criticisms of value, such as:

  1. increased share repurchase activity;
  2. the changing nature of firm activities, the rise of ‘intangibles’ and the impact of conservative accounting systems;
  3. the changing nature of monetary policy and the potential impact of lower interest rates; and
  4. value measures are too simple to work.

 Across each criticism they find little evidence to support them.

Are we there yet?

We do not know when and how the valuation gap will be closed. 

Nevertheless, the evidence is compelling in favour of maintaining a value tilt within a portfolio, and certainly now is not the time to give up on value.

This is not a widely popular view, and quite likely a minority view, given the underperformance of value over the last ten years.  As clearly demonstrated in the Graph below provided by Top Down Charts.

However, from an investment management perspective, the longer-term odds are in favour of maintaining a value tilt and thereby providing a boost to future investment returns in what is likely to be a low return environment over the next ten years.

It is too early to give up on value, news of its death are greatly exaggerated, on this, Asness makes the following point, value is “a strategy that’s “worked” through the 1920s – when a lot of stocks were railroads, steel, and steamship companies – through the Great Depression, WWII, the 1950s – which included some small technological changes like rural electrification, the space race and all the technology that it spanned – the internet age (remember these same stories for why value was broken back in 1999-2000?)………. Value certainly doesn’t depend on technological advancement being stagnant! But in a time when it’s failed for quite a while (again, that just happens sometimes even if it’s as good as we realistically think it is), it’s natural and proper that all the old questions get asked again. Is now different?”

I don’t think so.

Please see my Disclosure Statement

Global Investment Ideas from New Zealand. Building more Robust Investment Portfolios.

The reality is that asset allocations can only do so much

It is estimated US public pension plans would need to leverage a Balance Portfolio of 60% equities and 40% fixed income by 47% to achieve their 7.25% actuarial return target in the years ahead. 

Such is the challenge facing all investors in the current low interest rate environment.

Investors face some very tough decisions in the future and may be forced to consider significant asset allocation shifts.  Increasing the tolerance for risk and illiquidity are likely actions required to boost future investment returns.

Investors are going to have consider something different, from a return perspective, buying bonds is not going to cut it.  Likely actions may include considering substitutes to fixed income to provide portfolio stability and some diversification during periods of equity market weakness.

The reality is that asset allocation decisions can only do so much.

These are the key conclusions from an article written by Rob Croce, PhD, of Mellon and Aaron Filbeck, that recently appeared in AllAboutAlpha.

The article covers three potential solutions for investors to consider in boosting future investment returns.

Meeting the Pension Fund Challenge

The above conclusions are determined in the context of the challenge facing US public pension plans.

On average US pension plans currently have target returns assumptions of 7.25% on average, this is down from 8% in 2000.

In the year 2000, US 10-year government bond interest rates were 6%.  Therefore there “was little headwind to meeting return objectives”….

However, with the dramatic fall in interest rates over the last 20 years, the “gap” between long-term interest rates and return assumptions has widened materially.  This is highlighted in Figure 1 below, from the article. 

The gap is currently around 6%, compared to 2% in 2000!

Figure 1: Difference Between Average Plan Actuarial Return Assumption and 10-Year US Treasury Yield

Source: NASRA, Bloomberg, CAIA calculations

What have US pension plans done over the last 20 years as the return gap has widened:

  • Reduced their allocations to fixed income;
  • Allocated more to equities; and
  • Allocated more to alternatives.

“ According to Public Plans Data, from 2001 to 2009, the average pension allocation to alternative investments increased from 8.7% to 15.7%, which only accelerated after the Global Financial Crisis (GFC). Over the next decade, allocations to alternatives nearly doubled, reaching nearly 27% by the end of 2019.”

The increased allocation to Equities and Alternatives at the expense of fixed income is highlighted in the following Figure also provided in the article.

Figure 2: Average Allocations for the 73 Largest State-Sponsored Pension Funds

Source: Pew Research. Data as of 2016

At the same time US pension plans remain underfunded. 

The challenge facing US pension plans has been known for some time, the article notes, “In general, pension trustees seem to be faced with two potential solutions – take on more (or differentiated) risks or improve funding statuses through higher taxation or slashing benefits.”

How big is the Pension Fund Return Challenge?

The article analyses potential solutions to “filling the gap” between current interest rates and the assumed target rate of return for US pension funds.

The first approach uses risk premia-based analysis, focusing on the amount of return that can be generated over and above holding just risk-free short-term US Government bonds.

Starting with a traditional Balanced Portfolio, 60% domestic stocks and 40% U.S. 10-year bonds, the analysis seeks to determine how much risk would need to be taken to reach the 7.25% return target. Assuming historical return premia, but with the current level of interest rates.

In relation to return assumptions, the Article notes “Since 1928, stocks have outperformed the risk free asset by 6.2% at 20% volatility and 10-year U.S. government bonds have outperformed the risk-free asset by 1.5%, for Sharpe ratios of 0.3 and 0.2, respectively. For cash, we have decided to use its current near-zero return, rather than its 3.3% average return during that period.”

The results, “there is effectively no unlevered portfolio of stocks and bonds that can reliably deliver many investors’ 7.25% target return over time. Because of the nature of the problem, the solution will likely force pension investors to consider taking on leverage.”

This reflects the low interest rate environment, returns on equities will be lower on an absolute return basis.  Although equities are still expected to earn a “premium” above cash, the absolute return will be lower given the cash rate is so low (0%). The 6% equity premium is earnt on 0%, not the average 3.3% cash rate since 1928. 

The article estimates, for the Balance Portfolio to achieve the 7.25% return objective it would need to be levered by 47%.  This would increase the Portfolio’s volatility to 17.75% from 12%.

As they note, this is not a sustainable solution.  Nevertheless, it provides an indication of how much more risk needs to be taken to achieve the 7.25% return target in the current low interest rate environment.

Therefore, the article highlights the return challenge all investors face.  The leveraging of portfolios is not going to be a viable option for most investors.

The Potential Role of Alternatives

The article looks at two “hypothetical alternative allocations as potential solutions for U.S. pension funds to hit their 7.25% return, one illiquid and the other liquid.”

  1. Private Equity (illiquid).
  2. Hedge Funds or Diversified Assets (liquid)

Their analysis seeks to achieve the return outcome of 7.25% with less volatility than the levered Balance Portfolio above of 17.75% with an allocation to Private Equity and Liquid Alternatives separately.

Based on their analysis, and assumptions, they conclude the inclusion of Private Equity and Liquid Alterative strategies could help in reaching the 7.25% return assumption.

They note that Private Equity and Liquid Alternatives are “two examples provide different solutions for the same problem”.

The article also notes that there are many strategies that do not make sense e.g. anything that takes them further from their return target for the sake of diversification or anything illiquid with an expected return below their target portfolio return.

Key insights

The article wraps up with some key insights, including “buying bonds isn’t going to cut it from a return target perspective today,”…..

They also demonstrated that to meet return targets US pension plans are going to have consider something different.  “And while each pension fund is different, risk tolerance and liquidity needs will need to be managed.”

“We think that the current, low yield environment could potentially open institutions up to the idea of using low-risk liquid absolute return strategies as substitutes for fixed income investments. We believe they will increasingly look for investments that provide portfolio stability values and some diversification during risk-off environments, similar to that of traditional fixed income, but potentially provide the return of fixed income two decades ago.”

Reading this article made me think of the following John Maynard Keynes quotes:

“The difficulty lies not so much in developing new ideas as in escaping from old ones.”

“When my information changes, I alter my conclusions. What do you do, sir?”

“It is better to be roughly right than precisely wrong.”

Please see my Disclosure Statement

Global Investment Ideas from New Zealand. Building more Robust Investment Portfolios.

Endowments, Foundations, and Charities – learning from the best

The achievements of the Yale Endowment are significant and well documented. 

Their achievements can largely be attributed to the successful and bold management of their Endowment Funds.

They have been pioneers in Investment Management.  Many US Universities and global institutions have followed suit or implemented a variation of the Yale’s “Endowment Model”.

Without a shadow of a doubt, those involved with Endowments, Foundations, Charities, and saving for retirement can learn some valuable investment lessons by reviewing the investment approach undertaken by Yale.

I think these learnings are particularly relevant given where we are currently in the economic cycle and the outlook for returns from the traditional asset classes of cash, fixed income, and selected equity markets.

A growing Endowment

In fiscal 2019 the Yale Endowment provided $1.4 billion, or 32%, of the University’s $4.2 billion operating income.

To put this into context, the Yale Endowment 2019 Annual Report notes that the other major sources of revenues for the University were medical services of $1.1 billion (26%); grants and contracts of $824 million (20%); net tuition, room and board of $392 million (9%); gifts of $162 million (4%); and other income and transfers of $368 million (9%).

Spending from the Endowment has grown during the last decade from $1.2 billion to $1.4 billion, an annual growth rate of 1.5%.

The Endowment Fund’s payments have gone far and wide, including scholarships, Professorships, maintenance, and books.

Yale’s spending and investment policies provide substantial levels of cash flow to the operating budget for current scholars, while preserving Endowment purchasing power for future generations.

What a wonderful contribution to society, just think of the social good the Yale Endowment has delivered.

Yale’s Investment Policy

As highlighted in their 2019 Annual Report:

  • Over the past ten years the Endowment grew from $16.3 billion to $30.3 billion;
  • The Fund has generated annual returns of 11.1% during the ten-year period; and
  • The Endowment’s performance exceeded its benchmark and outpaced institutional fund indices.

In relation to Investment Objectives the Endowment Funds seek to provide resources for current operations and preserving purchasing power (generating returns greater than the rate of inflation).

This dictates the Endowment has a bias toward equity like investments.  Yale note: 

“The University’s vulnerability to inflation further directs the Endowment away from fixed income and toward equity instruments. Hence, more than 90% of the Endowment is targeted for investment in assets expected to produce equity-like returns, through holdings of domestic and international equities, absolute return strategies, real estate, natural resources, leveraged buyouts and venture capital.”

Accordingly, Yale seeks to allocate over the longer term approximately one-half of the portfolio to illiquid asset classes of leverage buyouts, venture capital, real estate, and natural resources.

This is very evident in the Table below, which presents Yale’s asset allocation as at 30 June 2019 and the US Educational Institutional Mean allocation.

This Table appeared in the 2019 Yale Annual Report, I added the last column Yale vs the Educational Institutional Mean.

 Yale UniversityEducational Institution MeanYale vs Mean
Absolute Return23.2%20.6%2.6%
Domestic Equity2.7%20.8%-18.1%
Foreign Equity13.7%21.9%-8.2%
Leverage Buyouts15.9%7.1%8.8%
Natural Resources4.9%7.7%-2.8%
Real Estate10.1%3.4%6.7%
Venture Capital21.1%6.6%14.5%
Cash and Fixed Income8.4%11.9%-3.5%
 100%100% 
    
Non-Traditional Assets75.2%45.4%29.8%
Traditional Assets24.8%54.6% 

The Annual Report provides a comment on each asset class and their expected risk and return profile, an overview of how Yale manage the asset classes, historical performance, and future longer-term risk and return outlook.

High Allocation to Non-Traditional Assets

As can be seen in the Table above Yale has a very low allocation to traditional asset classes (domestic equities, foreign equities, cash and fixed income), and a very high allocation to non-traditional assets classes, absolute returns, leverage buyouts, venture capital, real estate, and natural resources.

This is true not only in an absolute sense, but also relative to other US Educational Institutions.  Who in their own right have a high allocation to non-traditional asset classes, 45.4%, but almost 30% lower than Yale.

“Over the last 30 years Yale has reduced their dependence on domestic markable securities by relocating assets to non-traditional assets classes.  In 1989 65% of investments were in US equities and fixed income, this compares to 9.8% today.”

By way of comparison, NZ Kiwi Saver Funds on average have less than 5% of their assets invested in non-traditional asset classes.

A cursory view of NZ university’s endowments also highlights a very low allocations to non-traditional asset classes.

There can be good reasons why other investment portfolios may not have such high allocations to non-traditional asset classes, including liquidity requirements (which are less of an issue for an Endowment, Charity, or Foundation) and investment objectives.

Rationale for High Allocation to Non-Traditional Assets

Although it is well known that Yale has high allocations to non-traditional assets, the rationale for this approach is less well known.

The 2019 Yale Annual Report provides insights as to the rationale of the investment approach.

Three specific comments capture Yale’s rationale:

“The higher allocation to non-traditional asset classes stems from their return potential and diversifying power”

Yale is active in the management of their portfolios and they allocate to those asset classes they believe offer the best long-term value.  Yale determine the mix to asset class based on their expected return outcomes and diversification benefits to the Endowment Funds.

“Alternative assets, by their very nature, tend to be less efficiently priced than traditional marketable securities, providing an opportunity to exploit market inefficiencies through active management.”

Yale invest in asset classes they see offering greater opportunities to add value. For example, they see greater opportunity to add value in the alternative asset classes rather than in Cash and Fixed Income.

“The Endowment’s long time horizon is well suited to exploit illiquid and the less efficient markets such as real estate, natural resources, leveraged buyouts, and venture capital.”

This is often cited as the reason for their higher allocation to non-traditional assets.  As an endowment, with a longer-term investment horizon, they can undertake greater allocations to less liquid asset classes. 

Sovereign wealth Funds, such as the New Zealand Super Fund, often highlight the benefit of their endowment characteristics and how this is critical in shaping their investment policy. 

Given their longer-term nature Endowments are able to invest in less liquid investment opportunities. They will likely benefit from these allocations over the longer-term.

Nevertheless, other investment funds, such as the Australian Superannuation Funds, have material allocations to less liquid asset classes.

Therefore, an endowment is not a necessary condition to invest in non-traditional and less liquid asset classes, the acknowledgement of the return potential and diversification benefits are sufficient reasons to allocate to alternatives and less liquid asset classes.

In relation to the return outlook, the Yale 2019 Annual report commented the “Today’s actual and target portfolios have significantly higher expected returns than the 1989 portfolio with similar volatility.”

Smaller Endowments and Foundations are following Yale

In the US smaller Endowments and Foundations are adopting the investment strategies of the Yale Endowment model.

They have adopted an investment strategy that is more align with an endowment more than twice their size.

Portfolio size should not be an impediment to investing in more advanced and diversified investment strategies.

There is the opportunity to capture the key benefits of the Endowment model, including less risk being taken, by implementing a more diversified investment strategy. Thus, delivering a more stable return profile.

This is attractive to donors.

The adoption of a more diversified portfolio not only makes sense on a longer-term basis, but also given where we are in the economic and market cycle.

The value is in implementation and sourcing appropriate investment strategies.

In this Post, I outline how The Orange County Community Foundation (OCCF) runs its $400m investments portfolio like a multi-billion-dollar Endowment.

Diversification and Its Long-Term Benefits

For those interested, the annual report has an in-depth section on portfolio diversification.

This section makes the following key following points while discussing the benefits of diversification in a historical context:

  • “Portfolio diversification can be painful in the midst of a bull market. When investing in a single asset class produces great returns, market observers wonder about the benefits of creating a well-structured portfolio.”
  • “The fact that diversification among a variety of equity-oriented alternative investments sometimes fails to protect portfolios in the short run does not negate the value of diversification in the long run.”
  • “The University’s discipline of sticking with a diversified portfolio has contributed to the Endowment’s market leading long-term record. For the thirty years ending June 30, 2019, Yale’s portfolio generated an annualized return of 12.6% with a standard deviation of 6.8%. Over the same period, the undiversified institutional standard of 60% stocks and 40% bonds produced an annualized return of 8.7% with a standard deviation of 9.0%. “
  • “Yale’s diversified portfolio produced significantly higher returns with lower risk.”

There are also sections on Spending Policy and Investment Performance.

Lastly, I have previously discussed the “Endowment Model” in relation to the fee debate, for those interested please see this Post: Investment Fees and Investing like an Endowment – Part 2

Happy investing.

Please see my Disclosure Statement

Global Investment Ideas from New Zealand. Building more Robust Investment Portfolios.

The Cost of timing markets and moving to a more conservative investment option

Missing the sharemarket’s five best days in 2020 would have led to a 30% loss compared to doing nothing.

The 2020 covid-19 sharemarket crash provides a timely example of the difficulty and cost of trying to time markets.

The volatility from global sharemarkets has been extreme this year, nevertheless, the best thing would had been to sit back and enjoy the ride, as is often the case.

By way of example, the US S&P 500 sharemarket index reached a historical high on 19th February 2020.  The market then fell into bear market territory (a decline of 20% or more) in record time, taking just 16 trading days, beating the previous record of 44 days set in 1929. 

After falling 33% from the 19th February high global equity markets bounced back strongly over the following weeks, recording their best 50-day advance.

The benchmark dropped more than 5% on five days, four of which occurred in March. The same month also accounted for four of the five biggest gains.

Within the sharp bounce from the 23rd March lows, the US sharemarkets had two 9% single-day increases.  Putting this into perspective, this is about equal to an average expected yearly return within one day!

For all the volatility, the US markets are nearly flat for the period since early February.

A recent Bloomberg article provides a good account of the cost of trying to time markets.

The Bloomberg article provides “One stark statistic highlighting the risk focuses on the penalty an investor incurs by sitting out the biggest single-day gains. Without the best five, for instance, a tepid 2020 becomes a horrendous one: a loss of 30%.”

As highlighted in the Bloomberg article, we all want to be active, we may even panic and sit on the side line, the key point is often the decision to get out can be made easily, however, the decision to get back in is a lot harder.

The cost of being wrong can be high.

Furthermore, there are better ways to manage market volatility, even as extreme as we have encountered this year.

For those interested, the following Kiwi Investor Blog Posts are relevant:

Navigating through a bear market – what should I do?

One of the best discussions I have seen on why to remain invested is provided by FutureSafe in a letter to their client’s 15th March 2020.

FutureSafe provide one reason why it might be the right thing for someone to reduce their sharemarket exposure and three reasons why they might not.

As they emphasis, consult your advisor or an investment professional before making any investment decisions.

I have summarised the main points of the FutureSafe letter to clients in this Post.

The key points to consider are:

  • Risk Appetite should primarily drive your allocation to sharemarkets, not the current market environment;
  • We can’t time markets, not even the professionals;
  • Be disciplined and maintain a well-diversified investment portfolio, this is the best way to limit market declines, rather than trying to time market
  • Take a longer-term view; and
  • Seek out professional investment advice before making any investment decisions

Protecting your portfolio from different market environments

Avoiding large market losses is vital to accumulating wealth and reaching your investment objectives, whether that is attaining a desired standard of living in retirement or a lasting endowment.

The complexity and different approaches to providing portfolio protection has been highlighted by a recent twitter spat between Nassim Nicholas Taleb and Cliff Asness.

The differences in perspectives and approaches is very well captured by Bloomberg’s Aaron Brown article, Taleb-Asness Black Swan Spat Is a Teaching Moment.

I provide a summary of this debate in Table format in this Post.  

Also covered in this Post is an article by PIMCO on Hedging for Different Market Scenarios. This provides another perspective and a summary of different strategies and their trade-offs in different market environments.

Not every type of risk-mitigating strategy can be expected to work in every type of market environment.

Therefore, maintaining an array of diversification strategies is preferred “investors should diversify their diversifiers”.

Sharemarket crashes, what works best in minimising loses, market timing or diversification?

The best way to manage periods of severe sharemarket declines is to have a diversified portfolio, it is impossible to time these episodes.

AQR has evaluated the effectiveness of diversifying investments during market drawdowns, which I cover in this Post.

They recommend adding investments that make money on average and have a low correlation to equities.

Although “hedges”, e.g. Gold, may make money at times of sharemarket crashes, there is a cost, they tend to do worse on average over the longer term.

Alternative investments are more compelling relative to the traditional asset classes in diversifying a portfolio, they provide the benefits of diversification and have higher returns.

Portfolio diversification involves adding new “risks” to a portfolio, this can be hard to comprehend.

Happy investing.

Please see my Disclosure Statement

Global Investment Ideas from New Zealand. Building more Robust Investment Portfolios.


When Alternatives to Passive Index Investing are Appropriate

There are a wide range of reasons for choosing an alternative to passive investing over and above the traditional industry debate that focuses on whether active management can outperform an index.

Reasons for considering alternatives include no readily replicable market index exists, available indices are unsuitable in meeting an investor’s objectives, and/or there are some imbedded inefficiency within the Index.

Under these circumstances a passive approach no longer becomes optimal nor appropriate.

Or quite simply, an active manager with skill can be identified, this alone is sufficient to consider an alternative to passive indexing.

Importantly, the decision to choose an alternative to passive investing is likely to vary across asset classes, investors, and time.

Also, the active versus passive debate needs to be broadened, which to date seems too narrowly focused on comparing passive investments with the average returns from active equity managers.

Framework for choosing an Alternative to Passive Investing

This article by Warren and Ezra, When Should Investors Consider an Alternative to Passive Investing?, seeks to reconfigure and broaden the active versus passive debate.

They do this by presenting a framework for a more comprehensive consideration of alternatives to passively replicating a standard capitalisation-weighted index in any particular asset class.  

In doing so they provide examples of circumstances under which a particular alternative to passive management might be preferred.

They offer no conclusions as to whether any specific approach is intrinsically superior. “Indeed, the overarching message is that best choices can vary across asset classes, investor circumstances, and perhaps even time.”

Warren and Ezra provide the following Framework for choosing an Alternative to Passive Investing:

Their framework appreciably widens the range of reasons for choosing an alternative to passive investing.

As can be seen in the Table above, they have identify five potential reasons investors should seek an alternative to passive index.

The first three reflect situations where a passive index is either unavailable or unsuitable, and two relate to investor expectations that active management can outperform passive benchmarks.

Below I have provided a description of the five reasons investors should seek an alternative to passive index.

Back ground Comments

Warren and Ezra provide some general comments on the state of the industry debate:

  • They think it is unreasonable to base broad conclusions about the relative efficacy of passive indexing on active managers’ average results in a single asset class or subclass, such as U.S. equities. They note, “What holds true in one market segment may not hold in another.”
  • They also object to the “implicit assumption that in the absence of demonstrable stock-selection skills among managers, passive index replication provides optimal exposure for investors.” This assumption does not take into account differences in investor objectives and circumstances. This is one of the core points of their article.

They maintain, what is missing in the industry debate is “recognition that appropriate structuring and management of investments may well depend on investors’ relative situations.”

Some Context

The default position for passive investing is a capitalisation-weighted (cap-weighting) index, such as the New Zealand NZSX 50 Index and US S&P 500.

Although somewhat technical, the application of a cap-weighting index rests on the three assumptions outlined below.

A breach in any of the following assumptions could justify giving consideration to an alternative approach to passive indexing.

Market efficiency.

Cap-weighting should be chosen under an assumption of perfectly efficient markets, where prices are always correct. Investors may consider alternatives if they believe markets are not fully efficient and that the repercussions of any inefficiencies can be either avoided or exploited.

Cap-weighting is aligned with investor objectives.

It is assumed that cap-weighting indices are aligned with investor objectives. However, this is not always the case. As we see below, a Defined Benefit plan most likely has different objectives relative to a cap-weighted fixed income index.

The same is true for an endowment, insurance company, or foundation.

Index efficacy.

The view of passive indexing as the default assumes that an index is available for the intended purpose. The theoretical view calls for indexes that effectively embody the market portfolio. The industry view requires indexes that deliver the desired type of asset class exposure. In practice, it is possible that for a given asset class no market index exists, or that available indexes have shortcomings in their construction.

The five reasons below for when investors might prefer an alternative to a passive approach are in situations where these three critical assumptions for passive indexing are broken. In such situations passive index is likely to be inappropriate.

The reasons below, also highlight the point that the active versus passive debate often fails to take into account differences in investor objectives and circumstances. The debate needs to be broadened.

Reason #1: No Readily Replicable Index is Available

Passive investing assumes an effective index exists that can be easily and readily replicated.

In some instances, an appropriate index to replicate is simply not available, for example:

  • Unlisted assets such as Private Equity, unlisted infrastructure and direct property
  • Within listed markets were a lack of liquidity exists it becomes difficult to replicate the index, such as small caps, emerging market equities, and high-yield debt.

In these incidences, although a passive product may be available, they “might not deliver a faithful replication of the asset class at low cost.” Accordingly passive investing is not appropriate.

Reason #2: The Passive Index Is at Odds with the Investor’s Objectives

Often a passive index is badly aligned with an investor’s objectives. In such cases an alternative approach may better meet these objectives, often requiring active management to deliver a more tailored investment solution.

By way of example:

Defined Benefit Pension Plan and tailored fixed-income mandates.

Best practice for a Defined Benefit (DB) plan is to implement a tailored fixed income mandate that closely matches expected liabilities.

In such a case a passive index approach is not appropriate given the duration and cashflows of the DB plan are unique and highly unlikely to be replicated by an investment into a passive index based on market capitalisation weights.

DB plan managers may also likely prefer more control over other exposures, such as credit quality relative to a passive index.

Such situations also exits for insurance companies, endowments, and foundations.

Notably, an individual investor has a unique set of future liabilities, represented by their own cashflows and duration. Accordingly, investing into a passive market index product may not be appropriate relative to their investment objectives. A more active decision should be made to meet cashflow, interest rate risk, and credit exposure objectives.

Listed infrastructure provides another example where the passive index may be at odds with the investor’s goals. Some investors may want to target certain sectors of the universe that provides greater inflation protection, thus requiring a different portfolio relative to that provided by a passive market index exposure.

The article also provides example in relation to Sustainable and ethical investing and Tax effectiveness.

Reason #3: The Standard Passive Index is Inefficiently Constructed

Where alternatives are available, it makes no sense to invest in an inefficient index. This represents a suboptimal approach, particularly if an alternative can deliver a better outcome.

The article presents two potential reasons an index might be inefficient and proves three examples.

They comment that an index might be inefficient for the following reasons:

  • the index is built on a narrow or unrepresentative universe; and
  • the index is constructed in a way that builds in some inefficiency.

As they highlight, these issues are best outlined through the discussion of examples. I briefly cover two.

Equities

Alternative indexing/passive approaches such as factor investing and fundamental investing are “active” decision relative to a market-capitalised index.

The basis for these alternative approaches is that equity capital market indices are flawed (Fundamental Investing) and inefficient (e.g. factor investing such as value and small caps outperform the broader market over time).

Fixed income

There are many shortcomings of fixed-income indices, the article focuses on two:

  • Fixed income indices do not fully represent the asset class. Therefore, more efficient portfolios may be built by including off-benchmark securities.
  • The largest issuers dominate fixed income indices and it can be argued these are the less attractive governments/companies to invest in, because they are most in need of funding (and hence of lower quality), or are issuing debt to take advantage of low interest rates, which are unattractive to the investor.

Reasons #4 and #5 The final two reasons are more aligned with the traditional question of whether investors can access managers that can be expected to outperform the index.

Reason #4 features that could lead to active investment managers outperforming the passive alternative in aggregate.

Active management is often defined as a zero-sum game before transaction costs, and a negative-sum game after transaction costs. Therefore, active management as a whole cannot outperform.

However, this dynamic need not apply to all investors and it is quite likely that there is a subsector of investors that can consistently outperform the index.

Therefore, a review of the environment in which managers operate might establish if they are able to maintain a competitive advantage.

The following features are outlined in the article to support such a situation:

Market inefficiency situations

Market inefficiencies offer the potential for active managers to outperform the index, nevertheless managers need to be appropriately placed to capture any excess rewards of these inefficiencies.

The following situations may provide a manager with a competitive advantage:

  • Information advantage: An active manager could have an advantage where the market is “widely populated by less-informed investors” e.g. emerging markets and small caps.
  • Preferential access to desirable assets: e.g. where active managers have better access to initial public offerings and sourcing lines of stock. In unlisted markets private equity manager has well established relationships and ability to provide capital and/or appropriate skills.
  • Economic value-add: e.g. in unlisted assets active management can add value to the underlying asset.

Opportunities arising from differing investor objectives

Opportunities for active management to benefit may exist when:

  • Some investors are comfortable with earning below-market returns e.g. investors who place greater weight on liquidity or are not willing to accept certain risk exposures
  • Investors have differing time horizons e.g. value investors exploit short-term focus of markets

Index fails to cover the opportunity set

The article makes the following points under this heading:

  • There is the potential to outperform by investing outside the index whenever the index does not provide a comprehensive coverage of the available market
  • The intensity of competition is also a factor in success or otherwise of an active manager. For example, the results on manager skill of the highly institutionalise US market may not translate into other markets and asset class where competition is less fierce.
  • Cyclicality of markets needs to be considered, with managers likely to perform in different market environments i.e. they tend to underperform when cross-sectional volatility is low, or markets are driven more by thematic forces. As they note, this has limited relevance in the long run, but may add a “timing element to any evaluation of active versus passive investment.”

Reason #5: Skilled Managers Can Be Identified

Where a skilled manager can be identified, this is a sufficient condition to adopt an alternative to passive management alone.

Nevertheless, the ability and capacity to identify a skilled manager is necessary where an alternative to passive management is to be contemplated.

The discussion makes the following points:

  • At the very least bad managers should be avoided
  • Markets can never be perfectly efficient, therefore some room exists for outperformance through skill
  • Not all fund managers are created equal, some are good and some are bad
  • The research capability and skill to identify and select a manager is an important consideration.

Implementation and Costs

It is important to note, the framework aims first to work out whether there is a case for rejecting a passive index default. The next step is then to ask how much an investor is willing to pay and how the alternative can be accessed.

“In most cases this alternative will be what is traditionally known as “actively managed investing.” In other circumstances this need not be the case, or the skills-based component may be minor.”

The cost versus the benefit and accessing the preferred alternative approach to passive index are key implementation issues.

Concluding Comments

Warren and Ezra make the point that too much of the debate on active versus Passive relies on the analysis of US equities, they think it is unreasonable to base broad conclusions about the efficiency of passive indexing on a single asset class or subclass.

They are not alone on this, as outlined on this previous Kiwi Investor Blog Post, there are many studies that challenge the conventional wisdom of active management.

For the record, please see this Post, Kiwi Wealth caught in an active storm, on my thoughts on the active vs passive debate, we really need to move on and broaden the discussion. The debate is not black vs White, as highlighted in this article, there are large grey areas.

Happy investing.

Please see my Disclosure Statement


Global Investment Ideas from New Zealand. Building more Robust Investment Portfolios.

Preparing your Portfolio for a period of higher inflation

Although inflation is not a threat currently the case for a period of higher than average inflation can be easily made.

From an investment perspective:

  1. A period of high inflation is the most challenging period for traditional assets e.g. equities and Fixed Income;
  2. Before the inflation period, as we move from the current period of deflation there is a period of reflation, during which things will feel okay for a while; and
  3. During the higher inflation period the leadership of investment returns are likely to change.

These are some of the key insights from a recent Man article, Inflation Regime Roadmap.

Following an extensive review of previous inflation/deflationary episodes Man clearly articulate the case for a period of higher inflation is ahead.

As Man note the timing of moving to a higher inflation environment is uncertain.

As outlined below, they provide a check list of factors to monitor in anticipation of higher inflation.

Nevertheless, although the timing of a higher inflation environment is uncertain, Man argue the need for preparation is not and should commence now.

Investors need to be assessing the robust of their portfolios for a higher than average inflation environment now.

Man identify several strategies they expect will outperform during a period of higher inflation.

Investment Implications

The level and direction of inflation is important.

This is evident in the diagram below, which Man refer to as the Fire and Ice Framework.

The performance of investment strategies differs depending on the inflation environment.

As can be seen in the diagram, the traditional assets of equities and bonds (fixed income securities) have on average performed poorly in the inflation periods (Fire).

Also, of note is that the benefits of Bonds in providing portfolio diversification benefits are diminished during these periods, as signified by the positive stock-bond correlation relationship.

As Man note, and evident in the diagram above, the path to inflation is via reflation, so things will feel good for a while.

Importantly, there will be a regime change, those investment strategies that have flourished over the last 10 years are likely to struggle in the decade ahead.

The expected new winners in a higher inflation environment are succinctly captured in the following diagram.

As can been seen in the Table above, Man argue new investment strategies are needed within portfolios.

These include:

  • Alternative risk premia and long-short (L/S) type strategies, rather than traditional market exposures (long only, L/O) of equities and fixed income which are likely to generate real negative returns (See Fire and Ice Framework).
  • Real Assets, such inflation-linked bonds, precious metals, commodities, and real estate.

Man also expect leadership within equity markets to change toward value and away from growth and quality. Those companies with Pricing Power are also expected to benefit.

Several pitfalls to introducing the new strategies to a portfolio are outlined in the article.

Time for Preparation is now

As mentioned the timing of a transition to a higher inflation environment is uncertain. Certainly markets are not pricing one in now.

Nevertheless, the preparation for such an environment is now. Man highlight:

  • the likelihood of an inflationary regime is much higher than it has been in recent times;
  • the investment implications of this new regime would be so large that all the things that have worked are at risk of stopping to work; and
  • given that markets are not priced for higher inflation at all, the market inflationary regime may well start well before inflation actually kicks in, given the starting point.

Man believe investors have some time to prepare for the regime shift. Nevertheless, those preparations should start now.

In addition, Man provide a check list to monitor to determine progress toward a higher than average inflation environment.

Inflation Check List to Monitor

The paper undertakes a thorough review of different inflation regimes and the drivers of them. The review and analysis on inflation makes up a large share of the report and is well worth reviewing.

Man identify five significant regime changes to support their analysis:

  1. Hoover’s Depression and Roosevelt’s New Deal (Deflation to Reflation)
  2. WW2-1951 Debt Work-down (Inflation to Disinflation).
  3. The Twin Oil Shocks of the 1970s (Inflation).
  4. Paul Volcker (Disinflation).
  5. The Global Financial Crisis (Deflation to Reflation and back again).

As noted in the list above, we are currently in a deflationary environment (again) – Thanks to the Coronavirus Pandemic.

Man expect the deflationary forces over the last decade are likely to fade in the years ahead. As a result inflation is likely to pick up. Central banks are also likely to allow an overshoot relative to inflation targets. Their independence could also be at risk.

They argue the current deflationary status quo is unsustainable, high debt levels leading to underinvestment in product assets resulting in lower levels of spare capacity and rising levels of inequality around the world will lead to policy responses by both governments and central banks that will result in a period of higher than average inflation.

They provide a checklist of factors to monitor, which includes:

  1. Inflation Momentum, which is broadly neutral currently
  2. Measures of inflation in the pipeline, which are currently deflationary
  3. Economic slack, which is large and heavily deflationary at present
  4. Labour market tightness, which is loose and heavily deflationary presently
  5. Wage inflation, currently neutral to inflationary
  6. Inflation Expectations, sending mixed signals at this time

Man conclude their dashboard is more deflationary than inflationary. They also believe this could change quite rapidly if demand picks up faster than expected.

Concluding Remarks

Man’s view on the outlook for inflation are not alone, a number of other organisations hold similar views.

Although inflation is not a problem now, it is highly likely to become of a greater concern to investors than recent history.

This will likely lead to a change in investment return leadership. Those investment strategies that have worked well over the last 10 years are unlikely to work so well in the decade ahead. Man propose some they think will perform better in such an environment, there are likely others.

A review of current portfolio holdings should be undertaken to determine the robustness to a different inflation regime. This is a key point.

The performance of real assets in different economic environments was covered in a previous Post, Real Assets offer real diversification benefits, this Post covered analysis undertaken by PGIM.

Happy investing.

Please see my Disclosure Statement

Global Investment Ideas from New Zealand. Building more Robust Investment Portfolios.

An Alternative Future for Kiwisaver Funds

I have blog previously on the benefits of Alternative investments for a robust portfolio.

They would benefit Target Date Funds (Life Cycle Funds) and they have benefited Endowments and foundations for many years.

As the Funds Under Management (FUM) grows within Kiwisaver there will be an increasing allocation to Alternative investments. This will include the likes of unlisted assets (Private equity, direct property, and direct infrastructure), hedged funds, and liquid alternative strategies such as Alternative Risk Premia strategies.


A recent paper by Preqin, Preqin-Future-of-Alternatives-Report-October-2018, assesses the likely size, shape and make-up of the global alternative assets industry in 2023, the emphasis being on private capital and hedge funds.

Preqin are specialist global researchers of the Alternative investment universe and provide a reliable source of data and insights into alternative assets professionals around the world.


Needless to say, Alternatives are going to make up a large share of investment assets in the future.

Preqin’s estimates are staggering:

  • By 2023 Preqin estimate that global assets under management of the Alternatives industry will be $14tn (+59% vs. 2017);
  • There will be 34,000 fund management firms active globally (+21% vs. 2018).


This is an issue from the perspective of capacity and ability to deliver superior returns.  Therefore, manager selection will be critical.


Preqin outlined the drivers of future growth as the following:

  • Alternatives’ track record and enduring ability to deliver superior risk-adjusted returns to its investors, Investors need to access alternative sources of return, and risk, such as private capital.
  • They note the steady decline in the number of listed stocks, as private capital is increasingly able to fund businesses through more of their lifecycle;
  • A similar theme is playing out in the debt markets, there are increasing opportunities in private debt as traditional lenders have exited the market; and
  • The emerging markets are seen as a high growth area.


According to Preqin the following factors are also likely to drive growth:

  • Technology (especially blockchain) will facilitate private networks and help investors and fund managers transact and monitor their portfolios, and reduce costs vs public markets.
  • Control and ESG: investors increasingly want more control and influence over their investments, and the ability to add value; private capital provides this.
  • Emerging markets: the Chinese venture capital industry already matches that of the US in size; further emerging markets growth will be a ‘double whammy’ of GDP growth + higher penetration of alternative assets.
  • Private individuals: the ‘elephant in the room’, as the mass affluent around the world would like to increase their investment in private capital if only the structures and vehicles (and regulation) permitted; technology will help.


The Preqin report covers many other topics and interviews in relation to the Alternative sector.


Happy investing.


Global Investment Ideas from New Zealand. Building more Robust Investment Portfolios.


Please see my Disclosure Statement

US Recession Warning Indicators

As you will know the US economy is into its second longest period of economic expansion which commenced in June 2009.

Should the US economy continue to perform until July 2019, which appears likely, the US will enter its longest period of economic expansion. The longest expansion was 10 years, occurring during the tech expansion of the 1990s, the current expansion is nine years.

Similarly, the US sharemarket is into its longest bull market run, having not experienced a drop-in value of greater than 20% (bear market) since March 2009.

As a rule, sharemarkets generally enter bear markets in the event of a recession.


Nevertheless, while a recession is necessary, it is not sufficient for a sharemarket to enter a bear market.

Since 1957, the S&P 500, a measure of the US sharemarket:

  • three bear markets where “not” associated with a recession; and
  • three recessions happened without a bear market.


Statistically:

  • The average Bull Market period has lasted 8.8 years with an average cumulated total return of 461%.
  • The average Bear Market period lasted 1.3 years with an average loss of -41
  • Historically, and on average, equity markets tend not to peak until six – twelve months before the start of a recession.


Therefore, let’s look at some of the Recession indicators.

In a recent article by Brandywine, they ran through some of the key indicators for a US recession.

Federal Reserve Bank of Atlanta’s GDP Nowcast.

This measure is forecasting annualised economic growth of 4.4% in the third quarter of 2018. This follows actual annualised growth of 4.2% in the second quarter of 2018.

Actual US economic data is strong currently. Based on the following list:

  • US unemployment is 3.7%, its lowest since 1969
  • Consumer Confidence is at an 18 year high
  • US wages are growing at around 3%, the savings rate is close to 6%, leaving plenty of room for consumers to increase spending
  • Small business confidence is at all-time highs
  • Manufacturing and non-manufacturing surveys are at their best levels for some time (cycle highs)


Leading Indicators

The Conference Board’s Index of Leading Indicators, an index of 10 components that includes the likes of the ISM New Order Index, building permits, stock prices, and the Treasury yield curve.

The Conference Board’s Index is supportive of ongoing economic activity in the US.


Yield Curve

The shape of the yield curve, which is normally upward sloping, meaning longer term interest rates are higher than short term interest rates, has come in for close attention over the last six months. I wrote a about the prospect of a negative yield curve earlier in the year.

An inverted yield curve, where shorter term interest rates (e.g. 2 years) are higher than longer term interest rates (e.g. 10 years) has a pretty good record in predicting a recession, in 18 months’ time on average.

With the recent rise of longer dated interest rates the prospect of an inverted yield curve now looks less likely.

Albeit, with the US Federal Reserve is likely to raise short term interest rates again this year and another 3-4 times next year the shape of the yield curve requires on going monitoring.

Having said that, an inverted yield curve alone is not sufficient as a predictor of economic recession and needs to be considered in conjunction with a number of other factors.


Brandywine conclude, “what does a review of some well-known recession indicators tell us about the current—and future—state of the U.S. expansion? The information provided by the indicators is mixed, but favors the continuation of the current expansion. The leading indicators are telling us the economy should continue to expand well into next year—at least.”

In favour of ongoing economic expansion is low unemployment, rising wages, simulative financial conditions (e.g. low interest rates are supportive of ongoing growth, as are high equity prices), high savings rate of consumer and their low levels of debt. Lastly government spending and solid corporate profitability is supportive of economic activity over the medium term.

As a word of caution, ongoing US – China trade dispute could derail global growth. Other factors to consider are higher interest rates in combination with a higher oil price.

Noting, Equity markets generally don’t contract until interest rates have gone into restrictive territory. This also appears some time away but is a key factor to monitor.

Lastly, a combination of higher oil prices and higher interest rates is negative for economic growth.


I have used on average a lot in this Post, just remember: “A stream may have an average depth of five feet, but a traveler wading through it will not make it to the other side if its mid-point is 10 feet deep. Similarly, an overly volatile investing strategy may sink an investor before she gets to reap its anticipated rewards.”

 Happy investing.


Global Investment Ideas from New Zealand. Building more Robust Investment Portfolios.


Please see my Disclosure Statement