Generating stable and sustainable investment income

I would like to share this blog post by AMP Capital New Zealand, Four pillars for generating income | AMP Capital, which looks at the four main pillars of an investment framework to deliver a stable and sustainable level of income over time.

The Post challenges some of the conventional wisdoms underpinning the management of traditional portfolios.

The basis of the framework is a goal orientated investment approach.

For those wishing to understand more around Goal Based Investing, this Wikipedia page, which I have contributed to, Goal-based investing may be of interest. The Wikipedia page includes:

  • A description of Goal Based Investing (GBI)
  • A comparison of GBI to traditional portfolio theory
  • History and development of GBI
  • GBI in principle
  • GBI for the retirement problem

Pease read my Disclosure Statement


Global Investment Ideas from New Zealand. Building more Robust Investment Portfolios.

Five Myths of About Investment Management Fees – Broadening the Fee Debate

We need to change the conversation on investment management fees.  The debate on fees needs to be based on facts rather than myths. Despite often being framed in this way, the debate on investment management fees is not black versus white.

What matters is not the fee level, but the manager’s ability to deliver a satisfactory outcome to investors after fees. Either way, it is no good paying high fees or the lowest possible fees if your investment objectives have not been achieved. Therefore, amongst the key questions to ask are, are you satisfied with the investment outcomes after the fees you have paid? – have your investment objectives or retirement goals been achieved?

After fee returns are important.  Therefore, higher fee investment strategies should not necessarily be avoided if they can assist in meeting your investment objectives. In the current investment environment, the use of higher fee investment strategies may be necessary to achieve your investment objectives.

Therefore, Investors should focus on given the investment outcomes have I minimised the fees paid. 

In my mind, this would be consistent with the FMA’s value for money focus. (FMA is New Zealand’s Regulatory)

At the same time, fees should not be the overriding concern and investors must analyse fees in the overall context of managing their portfolios appropriately.

Investment management fee Myths

The 5 most common myths about investment management fees are:

  1. Fees should be as low as possible
  2. Incentive fees are always better than fixed fees
  3. High water marks always help investors
  4. Hedge Funds are where the alpha is.  They deserve their high fees
  5. You can always separate alpha from beta, and pay appropriate fees for each

This paper, Five Myths About Fees, address the above myths in detail.

Although all the myths are important, the myth that fees should be as low as possible probably resonates most with investors.

Investment management fees for active management are higher than index management and involve a wealth transfer from the investor to the investment manager.  This is a fact.

However, the paper is clear, investors should look to maximise excess returns (they term alpha) after fees.  Another way of looking at this, for a given level of excess returns, fees should be minimised.  This is an important concept when considering the discussion below around broadening the discussion on fees.

The paper also notes, investors should pay higher fees to those managers that are more consistent.  For example, if two managers provide the same level of excess return, but one does so by taking less risk, investors should pay higher fees to this manager (the manager who achieves the same excess return but with lower risk – technically speaking, this is the manager with the higher information ratio).

In summary, the take-outs on the myth fees should be as low as possible:

  • Fees must remain below expected excess returns e.g., a manager that charges active fees but only delivers enhanced index returns should be avoided.
  • Managers who consistently add value warrant higher fees.

In relation to do managers add value, see this Post, Challenging the Conventional Wisdom of Active Management.

The paper on the five fee myths is wide ranging.  It also provides insights into the key elements of the fee negotiation game and determining the conditions under which higher fees should be paid.

Key conclusions from the article, particularly after addressing Myth 4 & 5:

  • most investment strategies offer a combination of cheaply accessible market index returns (beta) and active management excess returns (alpha).  While many institutional investors look to separate beta and alpha for most investors this is too limiting and difficult.  Many talented investment managers appear in investment strategies which include both beta and excess returns (alpha).
  • Investors should consider fees before deciding on an investment strategy, not look at an investment strategy and then consider fees.
  • At the same time, fees should not be the overriding concern.
  • High fee investment strategies are worthwhile if they deliver sufficient return and lower risk.
  • Investors must analyse fees in the overall context of managing their portfolios appropriately.

A framework for Changing the discussion on fees

Despite it often framed this way, the debate on fees is not black versus white.

From this respective, understanding the disaggregation of investment returns can help in broaden the debate on fees and also help determine the appropriateness of fees being paid. 

From a broad view, investment returns can be disaggregated in to the following three parts:

  1. Market beta. Think equity market exposures to the NZX50 or S&P 500 indices (New Zealand and America equity market exposures respectively).  Market Index funds provide market beta returns i.e. they track the returns of the market e.g. S&P 500 and NZX50. Beta is cheap, as low as 0.01% for large institutional investors.
  • Factor betas and Alternative hedge fund beta exposures.  Of the sources of investment returns these are a little more ambiguous and contentious than the others.  This mainly arises from use of terminology and the number of investable factors that are rewarding.  My take is as follows, Factor betas and Alternative hedge fund beta fit between market betas (above) and alpha (explained below).
    • Factor Beta exposures.  These are the factor exposures for which I think there are a limited number.  The common factors include value, momentum, low volatility, size, quality/profitability, carry.  They are often referred to as Smart beta.
    • Alternative hedge fund betas.  Many hedge fund returns are sourced from well understood investment strategies.  Therefore, a large proportion of hedge fund returns can be explained by common hedge fund risk exposures, also known as hedge fund beta or alternative risk premia or risk premia.  Systematic, or rule based, investment strategies can be developed to capture a large portion of hedge fund returns that can be attributed to a hedge fund strategy (risk premia) e.g. long/short equity, managed futures, global macro, and arbitrage hedge fund strategies.  The alternative hedge fund betas do not capture the full hedge fund returns as a portion can be attributed to manager skill, which is not beta and more easily accessible, it is alpha.
  • Alpha is what is left after all the betas.  It is manager skill.  Alpha is a risk adjusted measure. In this regard, a manager outperforming an index is not necessarily generating alpha.  The manager may have taken more risk than the index to generate the excess returns and/or they may have an exposure to one of the factor betas or hedge fund betas which could have been captured more cheaply to generate the excess return.  In short, what is often claimed as alpha is often explained by a factor or alternative hedge fund beta outlined above.  Albeit, there are some managers than can deliver true alpha.  Nevertheless, it is rare.

These broad sources of return are captured in the diagram below, provided in a hedge fund industry study produced by the AIMA (Alternative Investment Management Association).

The disaggregation of return framework is useful for a couple of important investment considerations.  We can use this framework to determine:

  1. Appropriateness of the fees paid. Obviously for market beta low fees are paid e.g. index fund fees.  Fees increase for the factor betas and then again for the alternative hedge fund betas.  Lastly, higher fees are paid to obtain alpha, which is the hardest to produce.
  2. If a manager is adding value – this was touched on above. Can a manager’s outperformance, “alpha”, be explained by “beta” exposures, or is it truly unique and can be put down to manager skill.

The consideration of this framework is consistent with the observations from the article above covering the 5 myths of Investment Management Fees.

Lastly, personally I think a well-diversified portfolio would include an exposure to all of the return sources outlined above, at the very least.

Many institutional investors understand that true portfolio diversification does not come from investing in many different asset classes but comes from investing in different risk factors. See More Asset Classes Does not Equal More Diversification.

From this perspective, the objective is to implement a portfolio with exposures to a broad set of different return and risk outcomes.

Please read my Disclosure Statement

For Outsourced Chief Investment Officer (OCIO) and investment consulting services please see here.


Global Investment Ideas from New Zealand. Building more Robust Investment Portfolios.

KiwiSaver Balance Fund’s Strategic Asset Allocation (SAA) Analysis

A review of KiwiSaver Balanced Funds, which are soon to become the Default Option, highlights:

  • A heavy reliance on equities to drive return outcomes – there are few return engines outside of equities.
  • Limited portfolio diversification – likely resulting in higher levels of portfolio volatility across a full market cycle (which could be dampened down for the benefit of investors).
  • A high allocation to Fixed Income – which is a concern in the current market environment.

By comparison, Australian Super Funds with similar return objectives to a KiwiSaver Balance Fund have lower allocations to equities despite having higher “growth” asset allocations.  They achieve this by having higher weightings to alternative investment strategies such as Private Equity, Direct Property, Unlisted Infrastructure, Commodities, and Diversified Multi-asset Funds.

Consequently, the Australian Super Funds have lower weights to fixed income relative to their Kiwi peers. There are some nuances amongst asset class allocations of the KiwiSaver Balance Funds, these are similar to those identified from the KiwiSaver Conservative Fund analysis

I think it is fair to say that New Zealand KiwiSaver Funds need greater levels of diversification. 

Often liquidity is sighted as a reason for not investing into alternative investment strategies, to this point:

  • Portfolios often overestimate the level of liquidity they require (see here); and 
  • There are ways of increasing portfolio diversification with more liquid investment options.

Fees may also be playing a part.  Let us hope not, particularly in considering the best outcomes for customers.

The high allocation to fixed income is also a concern, particularly at this juncture in the economic and market cycles. 

Fixed Income was recently described as a “slow moving train wreck” at a recent industry event in New Zealand, Heathcote Investment Partners’ Meet the Manager series, see Toot, toot: what to do when bonds go off the rails | Investment News NZ

The traditional roles of Fixed Income are likely to be challenged in the years ahead:

  • Returns are highly likely to be lower than those delivered from fixed income over the last 10-20 years; and
  • The risk mitigation characteristics of fixed income are also likely to be lower in the years ahead.

Purely from a risk management perspective, Kiwi investors should be looking to increase the genuine level of diversification within their portfolios – by lessening the role of equities and exploring investment options to substitute/complement fixed income allocations.

Personally, I am not convinced of moving the KiwiSaver Default Fund to a Balanced Fund option is the right solution.  My views can be found here.  It is clearly ridiculous to have a 20- and 55-year-old Default KiwiSaver investor in the same investment strategy. 

My preference would be for Target Date / Life Cycle / Life Stage type funds as the Default Options – these align more with the financial planning theory.  The criticism of these type of Funds is often incorrectly positioned, I provide a defense of Target Date Funds here.

Analysis of KiwiSaver Balanced Funds

The Table below provides average, min, and max allocations of the Strategic Asset Allocations (SSA) for 12 KiwiSaver providers, sourced from their latest Statements of Investment Policy and Objectives (SIPO). 

Most of these managers are currently Default KiwiSaver Providers.

Income Allocations
 CashNZ
Fixed Income
International
Bonds
Income
Allocations
Averages5.2%12.8%23.7%41.6%
Min1.0%6.0%18.0%39.0%
Max10.0%16.5%28.0%50.0%
Median4.5%14.0%25.3%40.0%
Growth Allocations
 NZ EquitiesInternational
Equities
Other
Equities
  AlternativesGrowth
Allocations
Averages19.1%32.8%5.0%3.2%58.4%
Min11.5%26.0%0.0%0.0%50.0%
Max29.0%40.0%8.0%6.0%61.0%
Median20.0%32.0%5.5%4.0%60.0%

Income Assets

From a top level, the managers are tightly grouped around 40% allocation to Income assets (Cash, NZ Fixed Income and International Bonds). 

A KiwiSaver Balanced Fund is very much the traditional 60/40 portfolio (60% Equities / 40% Fixed Income).

There is one Manager that is an outliner, a truly “Balanced” Fund of 50% Equities and 50% Fixed Income.  There is significant peer risk here and with no published return objective it is not possible to assess the appropriateness of its SAA.  Albeit they will likely be the best performing manager when global sharemarkets fall sharply.  However, over the longer term they are likely to struggle in keeping up with peers.

Within Income Assets

The variation within the Income Assets is consistent with analysis undertaken on the KiwiSaver Conservative Funds, see analysis here, which also includes a review of the risk drivers within Fixed Income, particularly likely variation in duration exposure. 

Growth assets

As would be expected, the Growth Allocation is reasonably tight around 40%, the flip side of the Income Allocation.

Listed equities, including New Zealand equities, international equities, and listed property and infrastructure dominate the growth allocations i.e. there are very little investments into Alternatives. See Tables below.

Of interest, on average Domestic Equities (New Zealand and Australia) make up around 36% of the core equities allocations within the KiwiSaver Funds e.g. domestic and international listed equities ex listed property and infrastructure combined.

Overall, core equities make up 52% of a Fund on average.  This is by far the dominant risk within these portfolios.  On a risk basis, the equities allocations contribute to over 90% of the risks within a “Balanced” portfolio.

Ratio of
Domestic Equities
Core
Listed Equities
Averages36.4%51.9%
Min26.0%42.0%
Max52.7%60.0%
Median35.4%51.8%

The remaining growth allocations are predominately made up of listed Property and listed Infrastructure, with smaller allocations to alternatives.  Direct Property dominates the alternative allocations, with smaller allocations to private equity and more liquid hedge fund type strategies.

Total Listed Equities
Allocation
Alternatives AllocationAlternatives share of
Growth Assets
Averages56.8%3.2%2.7%
Min50.0%0.0%0.0%
Max61.0%6.0%10.0%
Median56.0%4.0%0.0%

Below is the same Data for a broad selection of Australian “Balanced” Funds.

Ratio of
Domestic Equities
Core
Listed Equities
Averages39.8%48.5%
Min0.0%30.0%
Max51.0%62.0%
Median42.6%50.0%
Total Listed Equities
Allocation
Alternatives AllocationAlternatives share of
Growth Assets
Averages52.3%27.2%33.4%
Min30.0%8.0%9.5%
Max76.0%53.0%63.9%
Median50.0%25.0%33.3%

Australian “Balanced” Funds have an 80% allocation to Growth assets but a lower allocation to Core Equities (Australian and International Equities) than their New Zealand counterparts, 48.5% versus 51.9% on average for the Kiwi Funds.

This reflects that the Australian Funds have a higher allocation to Alternatives, which includes investment into Private Equity, Direct Property, Infrastructure, Commodities, and Diversified Multi-asset Funds.

Diversified Multi-Asset Funds

It should be noted that Diversified Multi-Asset Funds can have high allocations to listed equities, therefore some funds have a higher allocation to equities than appears based on sector allocations alone.

Diversified Multi-Asset funds offer “genuine diversification” relative to a traditional balanced fund and are more actively managed.  In addition to investing in the traditional asset classes of equities and fixed income, they also invest into an array of alternative assets, often in more specialised areas and situations.  These Funds seek breadth and depth across asset classes seeking to allocate to different return engines e.g. specialist areas of the health care industry, housing within property, renewable energy, and specialised credit opportunities.

Diversified Multi-Asset Funds offer an authentic option to increase diversification within a traditional portfolio, particularly for those investors who have constraints in relation to fees and liquidity. 

There are several well-resourced managers in Australia with long histories of adding value with these types of funds.

Is it Apples vs Apples?

There is a wide variation in the Growth/Income split between New Zealand and Australian “Balanced” Funds.

Across both risk categories of Conservative and Balanced Funds, although the Australian Funds have higher Growth allocations than the Kiwi Funds, they have a slightly lower allocation to equities.

The difference is a lower allocation to fixed income and a higher alternative allocation in Australia.  The portfolios are more diversified in Australia, this allows them to have a “higher” growth allocation.  They are also most likely better positioned for the years ahead given the current stage in the economic and fixed income market cycles.

Although there is a degree of uniformity amongst the Kiwi Funds, you cannot choose a Fund by its name alone.

A review of the return objectives for both the New Zealand and Australian reveals:

  • The Australian Funds have return objective of CPI + 3% on average, they range from 2.5% to 4%.
  • The New Zealand Funds by and large fail to publish return objectives, those that do range from 2.5% – 3%.

This indicates that the universe of Funds is not too dissimilar from a return objective perspective, and the analysis above provides some real insights for consideration and to ask why the difference?

Personally, I think all managers should publish their return objectives in a CPI+ format.  This is a valuable piece of information for the informed investor along with a Fund’s proposed risk category. 

Please read my Disclosure Statement


Global Investment Ideas from New Zealand. Building more Robust Investment Portfolios.

Interest rate strategies for a low and rising interest rate environment

There are several options available for investors who are relying on fixed income investments to generate income in the current extremely challenging environment – characterised by low short-term rates and rising longer-term interest rates.

Short-term fixed income funds and private debt funds are two examples.  Both seek to deliver a healthy return above cash and term deposits.  They achieve this in a variety of ways, chiefly by gaining exposure to different investment risks.

In addition, active management is an important source of return from short-tern fixed income funds.  And exposure to the illiquidity premium is a source of “excess” returns in relation to private debt funds.

Crucial to success in the current environment is an investor’s perception and measurement of risk.

In measuring risk, investor focus should be on avoiding permanent loss of capital, rather than volatility of capital and investment returns.

So long as permanent loss of capital is appropriately managed, investors should be prepared to accept a higher volatility of capital from their fixed income investments, along with less liquidity. 

Such an approach will likely result in higher and more consistent levels of income in retirement.

Short-term fixed income funds

Short-term fixed income funds are actively managed fixed income funds that seek to take advantages of opportunities in short-term fixed income and credit markets to generate returns above cash and term deposits.

Although short-term fixed income funds target a lower average portfolio duration, they are often able to invest in securities that have up to 5 years until they mature. (Duration is a measure of a security and portfolio’s sensitivity to movements in interest rates.  The higher a portfolio’s duration the more volatile it will be.  A portfolio rises in value when interest rates fall and decreases in value when interest rates rise.  Duration is measured in years.)

The target duration on “short-term fixed income funds” can vary materially, from less than 1 year and up to a maximum of three years.

Likewise, credit quality can vary significantly between different funds, ranging from high quality investment grade exposures to sub-investment grade (High Yield).  On a more technical note, and often not considered, the credit duration of these funds can also vary, particularly in relation to the maximum term of credit security invested in.  Like interest rate duration, credit duration is measured in years and the higher the credit duration the more volatile will be the security or portfolio.

Some of the short-term fixed income funds can also invest into inflation-linked securities, an additional diversifying source of return and risk exposure for a portfolio. And maybe a valuable addition to portfolios in the years ahead.

Funds also differ in the countries they invest into, from domestic markets (e.g. New Zealand and Australia) to internationally, including the emerging markets.

Therefore, there is a very broad spectrum of Funds in this category and fund selection should be undertaken relative to risk tolerances and any investment mandate constraints where applicable e.g. limits on credit quality.

In my mind, a broad investment mandate is better.  This provides more opportunity for a manager to add value and manage portfolio risks – should they have the skill, resources, and capabilities to do so.

Lastly, short-term fixed income funds are generally highly liquid, and more liquid than term deposits.

My approach would be to implement as broad an investment strategy as possible given the constraints of fees, risk tolerance, and access to appropriate vehicles.

There are a number of these funds in the marketplace. For a Kiwi Investor, a strategy denominated in New Zealand dollar terms should be preferred.

Private Debt Funds

For those investors with a longer-term investment horizon and can maintain within their portfolio illiquid investments, Private Debt Funds offer the potential to boost returns, not only in the current investment environment, in the future as well.

Typically, the term “private debt” is applied to debt investments which are not financed by banks (non-bank lending) and are not issued or traded in an open market.

Private debt falls into a broader category termed ‘alternative debt’ or ‘alternative credit’, and is used interchangeably with ‘direct lending’, ‘private lending’ and ‘private credit’.

Within the private debt market, investors lend to investee entities – be they corporate groups, subsidiaries, or special purpose vehicles established to finance specific projects or assets – in the same way that banks lend to such entities.

Private debt investments are often used to finance business growth and provide working capital.

Private Debt Funds invest in loans to a wide range of borrowers such as public and private companies, infrastructure providers, property developers, and project finance groups.

Private Debt has been one of the fastest-growing asset classes.  Part of this growth reflects a change in debt markets since the Global Financial Crisis (GFC) and a corresponding demand from investors, attracted by the return potential and a broader set of credit investment opportunities to invest in.

Illiquidity Risk Premium

To generate returns over cash and term deposits investors need to take on more risk. 

Arguably the most efficient way to take on more risk is to invest into a diversified range of risk premiums.  The best known risk premiums are value, growth, momentum, and to a lesser extent low volatility.  Equity markets, interest rates, and credit are also risk premiums. Good active managers will add value over and above, or independently, of all these premiums.

There is also an illiquidity risk premium, which is often underrepresented in portfolios.

The illiquidity premium is the additional compensation to investors for not being able to access their capital for a specific period.

As a result, illiquid investments, such as Private Debt, should offer a “premium” in the form of higher yield expectations.

These higher relative yields could be a helpful in boosting income in the current environment and in the future.

Measuring Risk

“Risk means, more things can happen than will happen”, Elroy Dimson. 

An investor’s perception and measurement of risk are important in managing an investment portfolio.

Perception toward risk is critical. For example, often, adding new “risks” to a portfolio leads to a less risky portfolio. 

Most importantly, in managing investment risks, the ability to think in terms of probabilities is important.  This involves understanding and appreciating the likelihood/chance of an event occurring and then the expected impacts of that event occurring to all parts of the portfolio.

In relation to measurement of risk, investor focus should be on avoiding permanent loss of capital, rather than measuring risk as fluctuations in capital and returns.

Warren Buffett understands this concept of risk very well.  And, it has not done him any harm implementing this approach to risk!

Accordingly, investors would do better thinking along these lines in relation to risk.

So long as permanent loss of capital is appropriately managed, investors should prepare to accept a higher volatility of capital from their fixed income investments and less liquidity. 

Such an approach will likely result in higher and more consistent levels of income in retirement.

Please read my Disclosure Statement

Global Investment Ideas from New Zealand. Building more Robust Investment Portfolios.

source: Forbes.com

Investment Framework for a Rising Interest Rates Environment

Amongst the strategies to employ for the current interest rate environment is a Liability Driven Investment (LDI) approach. 

LDI provides a framework for managing retirement income outcomes in what is likely to be a rising interest rate environment over the years ahead. 

LDI places retirement planning goals at the centre of the investment approach leading to several key benefits:

  1. More stable level of income in retirement;
  2. More efficient use of capital – potentially need less retirement savings; and
  3. Better framework to make trade-off between allocation to equities and the retirement income portfolio in improving the likelihood of reaching desired standard of living in retirement.

Under LDI a more customised investment solution can be developed.

Conversely, if an investor runs with a Cash strategy, where the goal is primarily capital preservation, they will likely need additional precautionary savings to meet their income requirements over retirement.

Therefore, while an LDI strategy increases the likelihood of reaching the retirement income objectives, it also achieves this with a more efficient allocation of investment capital.

The additional capital could be used for current consumption or invested in growth assets to potentially fund a higher standard of living in retirement, or used for other investment goals e.g. endowments and legacies.

Accordingly, LDI potentially provides a better framework in which to evaluate the risk of meeting your retirement income goals in a rising interest rate environment.

Retirement Planning (mis) focus

Arguably the primary goal of retirement planning is to provide a stable and secure stream of income in retirement – income to support a desired standard of living in retirement.

However, retirement planning investment approaches often focus too heavily on accumulated wealth e.g. how much do I need to save to retire on?

This could potentially result in the wrong focus.  For example, if a New Zealander retired in 2008 with a million dollars, their annual income would have been around $80k by investing in retail term deposits.  Their income would have dramatically dropped in 2009 to approximately $35k.  That is a big drop in income!  But interest rates have fallen further, currently (Feb 2021) a million dollars invested in New Zealand Term deposits will generate around $10k.

As a result, the focus should not necessarily be on the size of the account value e.g. KiwiSaver account balance.

This reflects that volatility of capital and investment returns are not a true measure of a retiree’s investment risk.

Investment strategies that focus on capital preservation, such as holding high levels of cash and short-term fixed income strategies, are riskier and more volatile relative to the investment goal of generating a stable and secure stream of income in retirement.

Redefining the Retirement Goal

Those planning for retirement seek to secure essential (sufficient income) and aspirational goals (additional wealth accumulation) with a high probability of achieving them.

Accordingly, the goal for retirement can be split between retirement income (essential goals) and wealth accumulation (aspirational goals). 

Those saving for retirement should be focusing on more than accumulated wealth alone. Other key considerations may include a desired level of retirement spending, meeting children’s education costs, healthcare costs, and a legacy.  These can be considered as future liabilities that need to be met.

Consequently, a better measure of a retiree’s investment risk becomes uncertainty around how much spending can be sustained in retirement.

Liability Driven Investing

Liability-driven investment (LDI) strategies, otherwise known as asset-liability management (ALM), take a complete and holistic approach.

LDI explicitly includes an investor’s current and future liabilities e.g., essential and aspirational goals.

The traditional way of building portfolios focusses more on risk tolerance, return expectations, and accumulated wealth rather than achieving the investment goals outlined above.

LDI creates better portfolios, particularly when it comes to retirement needs.  A more robust portfolio is generated, and the focus is on the key investment risk; failure to meet your investment objectives.

Obviously most financial planning processes take into consideration investment and retirement goals. Nevertheless, LDI makes retirement goals the central piece of constructing a portfolio. With LDI, portfolio allocations and management of risks are relative to meeting retirement objectives.

A more customised investment solution is developed.

See here for more on LDI.

The Benefits of LDI

Dimensional Funds Advisors (DFA) undertook analysis comparing two investment strategies relative to the goal of generating a stable and secure level of income in retirement:

  1. Goals based strategy that looks to generate sufficient income in retirement to match expected spending (consumption). This is the LDI strategy.
  2. Capital preservation strategy that is invested in Cash to manage the volatility of the account balance.

The following conclusions can be drawn from the DFA analysis:

  • The LDI strategy provides a more stable stream of income in retirement;
  • The LDI strategy provides greater clarity and confidence to plan for retirement; and
  • The Cash strategy results in a high level of volatility relative to the goal of generating a stable level of income in retirement.

See here for a detailed review of the DFA Research. 

In simple terms, the LDI strategy is a long-term bond portfolio that matches the expected retirement spending/consumption goal. Effectively, the LDI strategy generates cashflows to match future expected spending.

This reduces volatility relative to retirement spending goals.

Insurance Company’s implement a similar approach in meeting (paying out) future expected liabilities (insurance claims).

DFA conclude that “any strategy that attempts to reduce volatility using short- to intermediate-term fixed income, when the goal is a long-term liability like retirement consumption, will not be as effective as the LDI strategy.”

Although cash is perceived as low risk, it is not low risk when it comes to generating a steady and secure stream of income in retirement. Likewise, short term fixed income securities, while appropriate for capital preservation, are risky if the goal is to meet future spending/consumption in retirement.

In summary a LDI strategy provides the following benefits:

  1. More stable level of income in retirement;
  2. More efficient use of capital – potentially need less retirement savings; and
  3. Better framework to make trade-off between allocation to equities and retirement income portfolio in improving the likelihood of reaching desired standard of living in retirement.

If an investor runs with a Cash strategy, where the goal is primarily capital preservation, they will likely need additional precautionary savings to meet their retirement income requirements.

Therefore, while an LDI strategy increases the likelihood of reaching the retirement income objectives, it also achieves this with a more efficient allocation of capital.

This additional capital could be used for current consumption or invested in growth assets to potentially fund a higher standard of living in retirement, or used for other investment goals e.g. endowments and legacies.

Accordingly, LDI potentially provides a better framework in which to assess the risk of meeting your retirement income goals in a rising interest rate environment.

LDI Investment Framework for Individuals

Under the LDI model there are two portfolios: the liability portfolio and a return seeking portfolio. Most investment products offered today are return seeking portfolios with some dampening down of risk (measured by volatility of returns).

LDI is used by pension funds and insurance companies where their investment objectives and portfolios are primarily reflected in the terms of their future liabilities.

“Institutional” investment approaches such as LDI, Two-portfolio separation, and being more dynamic, are finding their way into wealth management solutions.

Goals-Based Investing is the wealth management counterpart to LDI. By way of example is EDHEC Risk Institute Goal-Based Investing Approach.

EDHEC suggest investors should maintain two portfolios:

  1. Goal-hedging portfolio – this replicates future replacement income goals; and
  2. Performance-seeking portfolio – this portfolio seeks returns and is efficiently diversified across the different risk premia – disaggregation of investment returns.

And, over time the manager dynamically allocates to the hedging portfolio and performance seeking portfolio to ensure there is a high probability of meeting retirement income levels.

Nevertheless, and most importantly, the Goal Based Investment framework outlined by EDHEC focuses on the goal of generating income in retirement.

Instead of worrying about fluctuations in capital, investors investing for retirement should worry about fluctuations of income in retirement.

With regards to capital specifically, the focus should be on avoiding permanent loss of capital, rather than fluctuations in capital.

See here for more on the EDHEC Goals Based Investment approach.

Please read my Disclosure Statement


Global Investment Ideas from New Zealand. Building more Robust Investment Portfolios.

Competitor Analysis KiwiSaver Conservative Funds – the value of a good investment strategy

An analysis of KiwiSaver Conservative Funds identifies a variation in underlying asset allocations, despite there being a generic look at a higher level (Income / Growth split).

The area of most pronounced difference is within the Income asset class allocations: Cash, New Zealand Fixed Income, and International Bonds.  There are also nuances within each of these asset classes, particularly level of benchmark duration risk.

These differences will drive performance outcomes, having nothing to do with active management skill and very little in relation to fees paid.

Portfolio performance is primarily driven by portfolio construction and implementation decisions.  The value of a good investment strategy.

Within the Income asset classes, the decision on duration and credit quality will drive performance (absolute returns and relative to peers).  These decisions impact return outcomes over both the short and longer term.

A comparison to Australian Super Funds with similar objectives provides useful insights into asset allocation decisions being made in New Zealand.

Analysis of Balance and Growth KiwiSaver Funds has also been undertaken and will be provided at a later date.

Analysis of KiwiSaver Conservative Funds

The Table below provides average, min, and max allocations of the Strategic Asset Allocations of 12 KiwiSaver Providers’ Conservative Funds, sourced from their latest Statements of Investment Policy and Objectives (SIPO).

  Cash Fixed Income
NZ
Fixed Income
International
Income
Allocation
Average 15.6%22.7%39.1%77.4%
Min1.0%14.0%28.0%70.0%
Max30.0%36.0%50.0%82.0%
Median17.3%23.0%40.5%79.0%
 Listed Equities
New Zealand
Listed Equities
International
Listed
Property
AlternativesGrowth
Allocation
Average6.6%12.4%4.0%2.1%22.7%
Min4.0%9.0%0.0%0.0%18.0%
Max9.5%16.0%7.5%5.0%30.0%
Median6.3%12.5%4.0%1.6%21.0%

Income Assets

From a top level, by and large the managers are tightly grouped around 77% allocation to Income assets (Cash, NZ Fixed Income and International Bonds). 

There are a small group of four managers which are outliners, with income allocations closer to 70%.  

This group is materially different from the bulk of the managers.  They tend to have lower cash allocations and much higher equity allocations. Only one of these managers has a material weighting outside of the listed equity markets e.g. Alternatives.

Within Income Assets

The variation within Income asset class occurs at both the asset allocation and performance benchmark level.  Both of which drive performance outcomes.

As can be seen from the Table above the variation in the allocation to Cash is extreme. Ranging from 1.0% to 30.0%.

Maintaining high levels of cash does not make a portfolio less risky. High levels of cash can raise risks relative to certain investment objectives, particularly if the investor is seeking a stable and more predictable income stream in retirement.

High levels of cash increase the variation of income in retirement and is less effective in providing portfolio protection at the time of sharp sharemarket declines.  On both counts, longer maturing fixed income provides a better solution.  See here for why holding high levels of cash at retirement can be scandalous.

Given the current environment of very low interest rates and higher equity market valuations in the US and NZ, a higher weighting to cash could be warranted.

The key benefits of cash are that it is highly liquid, provides emergency funds without impacting longer-term investments, and can arguably be “dry powder” funds when sharemarkets decline sharply.  The key to the dry powder factor is having the investment discipline to act accordingly.

The allocations to Fixed Income (NZ Fixed Income and Global Bonds) are tighter, ranging from 50% – 76%, and averaging around 62%.

The allocation International Bonds is higher relative to domestic Bonds, on average making up 64% of the Fixed Income Allocations. International Bonds are the largest asset allocation weight within the portfolios of just under 40%.

Risk and Investment Management

From a risk management, and investment management perspective, a portfolio’s capital allocations to cash, NZ Fixed Income, and International Bonds are less relevant relative to the Portfolio’s duration and credit exposures.

A more accurate way of looking at risk, and managing a portfolio, is a Portfolio’s level of duration and credit exposure.

Duration is a key risk measure, and in general reflects a portfolios capital value sensitivity to changes in interest rates. Duration is measured in years.  For example, assuming your Portfolio’s duration is 6 years, if interest rates rise by 1% the portfolio will decline by 6%, all else being equal.

See here for an explanation of Duration and here for credit risk.

Generally, those with a higher allocation to International Bonds have a higher level of interest rate risk.  These portfolios would have benefited more from the significant decline in interest rates over the last 20 years.

From a high level, the range in total Portfolio duration is estimated to be:

Total Portfolio Duration
Average 4.06
Min 3.27
Max 5.01
Median 3.99

These are estimates, based on current index duration and portfolio asset allocations.  The key points are, this is a more accurate view of portfolio risk and there is a reasonable spread in duration risk amongst the managers.

From this perspective, investors must be careful in assessing the relative risk of a Conservative Fund based on asset allocations alone.

By way of example, some Managers manage to a lower duration international bond index.  Thus, despite having a higher international bond allocation these Portfolios may have lower interest rate risk (duration) than a portfolio with a lower international bond allocation but managing to a higher duration index. They may also have the same level of interest rate risk!

Therefore, what is important is how much duration risk a portfolio should have in meeting its investment objectives.

From an investment governance perspective, Investment Committees should not be debating the level of allocation to cash, international, or NZ fixed interest without first considering what is the most appropriate level of portfolio duration risk to target in meeting investment objectives.  This is a different conversation and focus.

There is evidence that at least one of managers takes such an approach, maintaining a very low allocation to cash and a high allocation to Fixed Income.  This portfolio is not necessarily riskier than the other Funds just because it has a low cash holding.

Lastly, it should be noted that the duration on the International Bond Index has almost doubled over the last 10 years.  Therefore, if portfolio allocations to international bonds have remained static over the last 10 years, the risk of this allocation has increased along with the total portfolio’s risk profile.  Unfortunately, with interest rates so low, the return prospects are less, yet the risks have increased.

For more on the unintended risks within fixed income see here

Growth asset

As would be expected, the Growth Allocation is reasonably tight around 23%, the flip side of the Income Allocation.

Listed equities, including New Zealand equities, international equities, and listed property and infrastructure dominate the growth allocations i.e. there is very little investment in Alternatives.

Direct Property dominates the Alternative allocations.

Of interest, on average Domestic equities (New Zealand and Australia) make up around 35% of the core equities allocations e.g. domestic and international listed equities ex listed property and infrastructure.

Overall, core equities make up 19% of portfolios, domestic equities are around 6.5% of a Conservative Portfolio.

Ratio of Domestic Equities
in Core Equities Allocation
Core Listed Equities
Portfolio Allocation
Average 34.5%19.0%
Min25.0%13.0%
Max47.4%22.5%
Median31.5%19.5%

The Growth allocations will be discussed in more depth when presenting the results of the Balance and Growth Fund’s allocations.

Australian Fund Comparison

The Table below presents the average, min, max, and medium asset allocations of the largest Super Funds in Australia.  This list is dominated by Industry Funds.

The list includes funds with Conservative in their name and/or have similar return objectives to the KiwiSaver Funds.  The return objectives are express as inflation plus a margin e.g. CPI + 1.0%.

The following quick observations can be made:

  1. The Australian Funds have lower allocations to Income Assets than the New Zealand Funds, this is consistent with the Australian Funds having higher CPI + return objectives.  A return objective is necessary to undertake portfolio modelling. Also, don’t always choose a Fund my its name!
  2. At the same time, the Aussie Funds have much higher Cash allocations relative to the NZ Funds.
  3. The above means the Australian Funds have much lower Fixed Income allocations.  They also only show Fixed Income, not domestic and international bonds breakdown, which is consistent with the discussion above.
  4. Interestingly, the listed equity allocation is in line with the Kiwi Funds, around 20%.  However, the weighting in Australia to domestic equities in the total core equities allocation is closer to 50%, compared to 35% in NZ.  Domestic equities make up around 9% of a Conservative Fund in Australia, compared to 6.5% in New Zealand. Albeit, the Australian Funds do have a higher risk profile.
  5. The Australian Funds have significantly higher allocations to Alternatives than the NZ Funds.  When you consider a similar core equities allocations and higher cash allocations in Australia, the higher Alternatives allocation comes at the expense of Fixed Income.
Australian
Super Funds
CashFixed IncomeIncome
Allocation
Average27.5%36.7%59.6%
Min23.0%28.5%53.0%
Max37.0%67.0%67.0%
Median25.0%30.3%58.3%
Listed Equities
Domestic
Listed Equities
International
AlternativesGrowth
Average9.1%11.1%21.8%40.4%
Min7.0%7.0%6.0%33.0%
Max11.5%17.5%29.5%47.0%
Median9.5%10.5%24.0%41.8%

The Alternatives allocation will be discussed in more depth when presenting the results of the Balance and Growth Fund’s allocations.

Please read my Disclosure Statement

 Global Investment Ideas from New Zealand. Building more Robust Investment Portfolios.
Investment strategies for the year(s) ahead – how to add value to a portfolio

At this time of the year there are a plethora of economic and market forecasts for next year.  This Post is not one of them.

Outlined below are several investment strategies investors should consider in building more robust portfolios for the years ahead and to increase the odds of meeting their investment objectives.

These strategies directly address the current investment environment and the developing theme over 2020 that the traditional Balanced portfolio, of 60% equities and 40% fixed income, is facing several head winds, and likely to disappoint from a return perspective in the decade ahead.

A recent FT article captures this mood, titled: Investors wonder if the 60/40 portfolio has a future | Financial Times

In the article they make the following comment “The traditional 60/40 portfolio — the mix of equities and bonds that has been a mainstay of investment strategy for decades — is at risk of becoming obsolete as some investors predict years of underperformance by both its component parts.”

I first Posted about the potential demise of the Balanced Portfolio in 2019, see here, and again in early 2020, see here.   These Posts provide background as too why many investment professionals are questioning the likely robustness of the Balance Portfolio in the years ahead given the current investment environment.

In essence, there are two themes presented for the bleak outlook for the Balanced Portfolio.

The first is that fixed income and equities (mainly US equities) are expensive, so now may not be a great time to invest in these markets.

The second theme is that with interest rates at very low levels, there is doubt that fixed income can still effectively protect equity portfolios in a severe market decline in ways they have done historically.

For more on the low expected return environment, first Theme, see these Posts here and here.  This Post also outlines that although markets fell sharply in March 2020, forecast future returns remain disappointing.

The strategies discussed below address the second theme, the expected reduced effectiveness of fixed income to protect the Balance Portfolio at the time of severe sharemarket declines.

The Balance Portfolio has served investors well.  Although equities and fixed income still have a role to play in the future, there is more that can be done.

The strategies outlined below are “the more that can be done“, they aim to improve the risk and return outcomes for the Balance Portfolio in the years ahead.

For the record, I anticipate the global economy to continue to repair next year, experiencing above average growth fuelled by the roll out of the Covid-19 vaccines and underpinned by extraordinary low interest rates and generous government spending programs.  Global equities will continue to perform well in this environment, the US dollar will weaken further, commodity prices will move higher, value and emerging markets to outperform.

The Case for holding Government Bonds

Before looking at some of the strategies to improve on the Balance Portfolio, it goes without saying there is a role for equities in most portfolios.  The case for and against US equities are found here and here respectively.

There is also a role for holding Fixed Income securities, primarily government bonds.

This Post reviews some of the reasons why owning government bonds makes good sense in today’s investment and economic climate. It also brings some balance to present discussions around fixed income and the points within should be considered when determining portfolio allocations in the current market environment.

The central argument for holding government bonds within a portfolio: Government bonds are the only asset where you know with absolute certainty the amount of income you will get over its life and how much it will be worth on maturity. For most other assets, you will only ever know the true return in arrears.

In a recent Financial Times article PIMCO argues the case for the 60/40 portfolio in equities and fixed income.   

In relation to fixed income they argue, that although “returns over the horizon may be harder to achieve, but bonds will still play a very important role in portfolios”.  The benefits being diversification and moderation of portfolio volatility.

However, they argue in relation to fixed income investors must target specific regions and parts of the yield curve (different maturity dates) to maximise return and diversification potential.

PIMCO see opportunities in high-quality assets such as mortgage-backed securities from US government agencies, areas of AA and AAA rated investment-grade corporate bonds, and emerging market debt that is currency hedged.

They conclude: “One answer for 60/40 portfolio investors is to divide fixed-income investments into two subcomponents — hedging and yield assets.”

Rethinking the “40” in the 60/40 Portfolio

This Post outlines a thinkadvisor.com article which provides a framework to consider potential investment ideas in the current extremely low interest rate environment, by examining the 40% fixed income allocation within the 60/40 Portfolio (Balanced Portfolio).

The basis of the article is that investors seeking to generate higher returns are going to have to look for new sources of income, allocate to new asset classes, and potentially take on more risk. This likely involves investing into a broader array of fixed income securities, dividend-paying equities, and alternatives, such as real assets and private credit.

The Role of Liquid Alternatives and Hedge Funds

I have no doubt investors are going to have to look for alternative sources of returns and new asset classes outside equities and fixed income over the next decade.

Not only will this help in increasing the odds of meeting investment objectives, but it will also help protect portfolios in periods of severe sharemarket declines, thus reducing portfolio volatility, a role traditionally played by fixed income within a multi-asset portfolio.

The best way to manage periods of severe sharemarket declines, as experienced in the first quarter of 2020, is to have a diversified portfolio.  It is impossible to time these episodes.

AQR has evaluated the effectiveness of diversifying investments during market drawdowns.

They recommend adding investments that make money on average and have a low correlation to equities i.e. liquid alternatives and hedge fund type strategies. 

AQR argue diversification should be true in both normal times and when most needed: during tough periods for equities.  Although “hedges”, e.g. Gold, may make money at times of sharemarket crashes, there is a cost, they tend to do worse on average over the longer term.

Alternative investments are more compelling relative to the traditional asset classes in diversifying a portfolio, they provide the benefits of diversification and have higher returns.

Lastly, Portfolio diversification involves adding new “risks” to a portfolio, this can be hard to comprehend.  Diversification can be harder to achieve in practice than in theory.

This Post provides a full summary and access to the AQR article.

The case for Trend (momentum) Strategies

A sub-set of Alternatives and hedge funds is Trend/Momentum.

In this recent article MAN present the benefits of introducing Trend following strategies to the traditional Balanced Portfolio. Man note, “Another element that we believe can be of great help to bond-equity portfolios in the future is time-series momentum, or trend-following.”

Their analysis highlights that adding trend-following results in a significant improvement relation to the Balanced Portfolio, by improving returns, decreases volatility, and reducing the degree of losses when experienced (lower downside risk – drawdowns).

The case for Tail Risk Hedging

The expected reduced diversification benefits of fixed income in a Portfolio is a growing view among many investment professionals.

This presents a very important portfolio construction challenge to address, particularly for those portfolios with high allocations to fixed income.

There are many ways to approach this challenge,

This Post focuses on the case for Tail Risk Hedging.  It also outlines other approaches.

In my mind, investment strategies to address the current portfolio challenge need to be considered. The path taken is likely to be determined by individual circumstances.

Comparing a diversified approach versus Tail Risk Hedging

On this note, the complexity, and different approaches to providing portfolio protection, was highlighted by a twitter spat between Nassim Nicholas Taleb (Tail Risk Hedging) and Cliff Asness (broad Portfolio Diversification) from earlier in the year.

I provide a summary of this debate in Table format accessed in this Post, based on a Bloomberg article. 

Several learnings can be gained from their “discussion”.

Also covered the Post was an article by PIMCO on Hedging for Different Market Scenarios. This provides another perspective and a summary of different strategies and their trade-offs in different market environments.

Not every type of risk-mitigating strategy can be expected to work in every type of market environment.

Therefore, maintaining an array of diversification strategies is preferred “investors should diversify their diversifiers”.

Hedge Funds vs Liquid Alternatives – both bring diversification benefits to a traditional portfolio say Vanguard

Vanguard recently concluded that investors should carefully consider liquid alternatives and hedge funds.

This is a very good article presenting the benefits Alternatives would bring to a Balanced Portfolio.

Their research highlighted that Hedge Funds and Liquid Alternatives both bring portfolio diversification benefits to a traditional portfolio of equities and fixed income.

They suggest that liquid alternatives are often viable options for investors compared to hedge funds.

Although hedge funds and liquid alternatives deliver valuable portfolio diversification benefits, “it is crucial that investors assess funds on a standalone basis, as the benefits from any alternative investment allocation will be dictated by the specific strategy of the manager(s).”

The most important feature in gaining the benefits of hedge funds and liquid alternatives is manager selection.  Implementation is key.

Access to this research can be found here.

Private Equity Characteristics and benefits to a Portfolio

For those investors that can invest into illiquid investments, Private Equity (PE) is an option.

Portfolio analysis, also undertaken by Vanguard, demonstrates that PE can play a significant role in strategic, long-term, diversified portfolios.

PE is illiquid and so must be actively managed, introducing both illiquidity and manager specific risk to a multi-asset portfolio. Conventional asset allocation approaches often omit illiquidity and active risk dimensions from the risk-return trade-off. Therefore, these models do not reflect the unique aspects of PE and tend to over allocate to PE.

Vanguard addresses these issues: outlining four key reasons why the economic returns of private equity are different to those of public equities; highlighting the key risks that need to be accounted for when undertaking portfolio modelling including illiquid assets such as PE; and presenting the adjustments they make to portfolio modelling to address the illiquid features of PE and smoothed nature of historical returns.

This results in more realistic characteristics for PE that can be used for portfolio modelling purposes, reflected in the portfolio allocations generated in the article and the conclusion that PE can play a significant role in strategic, long-term, diversified portfolios.

A review of Vanguard’s analysis and their results can be found in this Post.

Real Assets Offer Real diversification benefits

Real assets such as Farmland, Timberland, Infrastructure, Natural Resources, Real Estate, Inflation-linked Bonds, Commodities, and Foreign Currencies offer real diversification benefits to a portfolio of just equities and fixed income.

The benefits of Real Assets are noticeable in different economic environments, like stagflation and stagnation, and particularly for those investment portfolios where objectives are linked to inflation.

These are the conclusions of a recent study by PGIM.

PGIM provide a brief outline of the investment characteristics for several real assets. They then look at the sensitivity of the real assets to economic growth, inflation, equity markets, and fixed income.

They note there is wide diversity in real assets’ sensitivities to inflation and growth, and stocks and bonds. These sensitivities vary over time and are best mitigated by holding a portfolio of real assets.

Therefore, PGIM construct and analyse three real asset strategy portfolios – Diversification, Inflation-Protection and Stagnation-Protection to reach their conclusions.

I provide a detailed summary of the PGIM Report in this Post.

Portfolio Tilts

Adding Emerging Markets and Value tilts to a Portfolio are potential areas to boost future investment returns in what is likely to be a low return environment over the next decade.

Value of Emerging Markets

Emerging markets bring the benefits of diversification into different geographies and asset classes for investors, including both public and private markets.

The case for investing into emerging markets is well documented: a growing share of global economic activity in the years ahead and current attractive valuations underpin the case for considering a higher weighting to emerging markets within portfolios. Particularly considering the low interest rate environment and stretched valuation of the US sharemarket. This is evident in market return forecasts.

Is a Value bias part of the answer in navigating today’s low interest rate environment

Value offers the potential for additional returns relative to the broader sharemarket in the years ahead.

Value is exceptionally cheap, probably the cheapest it has ever been in history, based on several valuation measures and after making adjustments to market indices to try and prove otherwise, such as excluding all Technology, Media, and Telecom Stocks, excluding the largest stocks, and the most expensive stocks.

There is also little evidence to support the common criticisms of value, such as increased share repurchase activity, low interest rates, and rise of intangible assets.

This is not a popular view, and quite likely minority view, given the underperformance of value over the last ten years.

However, the longer-term odds are in favour of maintaining a value tilt and thereby providing a boost to future investment returns in what is likely to be a low return environment over the next decade.

Please see my Disclosure Statement

Global Investment Ideas from New Zealand. Building more Robust Investment Portfolios.
Private Equity characteristics – considerations for Portfolio inclusion

Portfolio analysis undertaken by Vanguard demonstrates that private equity (PE) can play a significant role in strategic, long-term, diversified portfolios.

Vanguard highlight:

  • Although private equity and public equity share some risk and return characteristics, there are key structural differences. (Both have a role to play in a well-diversified and robust portfolio.)
  • Private equity investments are illiquid and so must be actively managed, introducing both illiquidity and manager specific risk to the multi-asset portfolio.
  • Conventional asset allocation approaches such as mean-variance efficient frontiers omit illiquidity and active risk dimensions from the risk-return trade-off.
  • Asset allocation models that do not reflect the unique aspects of PE tend to over allocate to PE and therefore introduce unintended risks into a multi-asset portfolio.

In this Research Paper Vanguard introduce a new portfolio construction framework that accounts for private equity’s risk and return characteristics, Vanguard Asset Allocation Model (VAAM). 

They conclude that there is no single recommended allocation for all investors.  “Private equity allocations depend on each investor’s specific set of circumstances, such as the degree of risk tolerance, including active risk tolerance, and the ability to find and access high-quality managers.”

In allocating to PE investors must carefully consider their willingness and ability to handle a long-term lack of liquidity, constraints on rebalancing, and uncertainty around the timing and size of cash inflows and outflows.

Below is a summary of the Vanguard Research Paper, which also draws on this All About Alpha article by Vanguard.

The Vanguard paper addresses the following three main issues:

  • Complexity in the structure and mechanics of PE that lead to unique sources of risk and return versus public equity investments.
  • Data limitations due to lack of standardized publicly available marked-to-market performance reporting.
  • Lack of portfolio construction frameworks that can appropriately account for PE’s unique characteristics.

Why returns from Private Equity are different to those from Public Equities

For those new to PE the Vanguard paper provides an excellent introduction, including topics such as what is a PE investment, the growth in PE over the last two decades, and how to access PE.

Their discussions on identifying the drivers of PE returns is very good.

Vanguard outline four key reasons why the economic returns of private equity should be different than those of public equity benchmarks:

Liquidity premium.

“Investors in private equity have less ability to trade their investment and do not control the timing or size of cash flows if invested in funds; therefore, they should require compensation in the form of a liquidity premium.”  Returns from the “Liquidity Premium” vary over time.

An important point in relation to liquidity, is that most long-term investors do not need a 100% liquid portfolio.  Most investors over-estimate their liquidity needs (this is not to minimise the importance of portfolio liquidity).

Vanguard note there are two different but related forms of liquidity risk:

  • Market liquidity risk – the ease with which an investment can be traded.
  • Funding liquidity risk – investors must be flexible enough to make contributions quickly and to deal with potential material delays in distributions from the PE funds

Other risk factors

“The average characteristics of private equity companies may be different than those of public companies (for example, industry, size, financial leverage, geography, and valuation).”

There is a large body of research that attempts to estimate the common risk factors of PE, such as size and value.

Vanguard provides results from a sample of academic studies which suggests PE Funds tend to have above market risk (high betas) and a small size tilt.  The research also suggests that buyout funds have a value bias, whereas venture capital funds display a negative value bias.

These are important considerations to contemplate when evaluating the inclusion of PE into a diversified and robust portfolio to minimise unintended risk exposures.

Manager-specific alpha

“Investors accept idiosyncratic manager-specific risk in exchange for the opportunity to generate alpha.”

Vanguard outlined that PE managers look to add value in the following ways:

  • Company selection. In addition to their company selection skills, some managers may have access to certain deals or parts of the market that others may not because of their reputation or skill set.
  • Thematic bets. Managers can choose to focus on secular or structural changes (such as technological, regulatory, and consumer preference) that may not be fully reflected in company valuations today.
  • Governance. PE firms can provide the oversight to help portfolio companies with the likes of strategic planning, conflicts of interest, and remaining focused on competitive advantages.
  • Finance. PE firms provide guidance in optimising capital structures of portfolio companies.
  • Operations. PE firms may have specific sector or industry expertise that can help portfolio companies make key decisions, reduce costs, and identify growth opportunities.

Manager due diligence is always important, in relation to PE investors should understand how a manager seeks to add value, why the manager believes they will be successful, and what success will look like.

Always have a set of expectations as to a manager’s expected performance, these can be both quantitative and qualitative.  Undertake ongoing monitoring and review of the manager relative to these expectations.

As the Vanguard article highlights “David Swensen, the long-time chief investment officer of the Yale University endowment who may be the most well-known evaluator of private equity managers in the world, stresses that qualitative factors (such as people and process) play a central role in manager evaluations.”

All-in costs

Vanguard make the very significant point “Investors care most about performance net of all costs.”

The size and structure of PE fees/costs are materially different to investing into Public markets.  Investors will need to understand these and most importantly assess the likely performance outcome after all fees and charges.

Private Equity Portfolio modelling challenges

Most asset allocation models are built with liquid public assets in mind (e.g. public equities, fixed income, and cash) and assume the portfolio can be rebalanced periodically and with minimum cost.

However, with the introduction of illiquid asset classes, such as PE, there are some fundamental differences that need to be accounted for when undertaking portfolio modelling.

As outlined by Vanguard, these include:

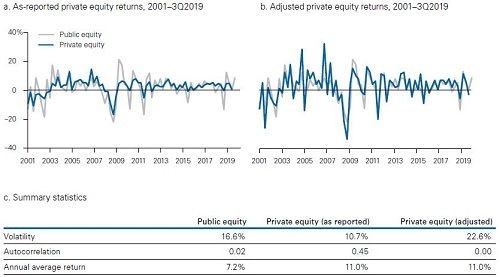
  1. Smoothed (appraisal-based) private equity return estimates: Private equity historical return data have limited holdings transparency and are based on subjective appraisal-based valuations rather than observable, transaction-based prices on a public exchange. Relying solely on appraisal-based values to calculate returns can lead to significant underestimation of the volatility of returns.
  2. Illiquidity and frictionless rebalancing: Investors in private equity have less ability to trade their investment and rebalance their portfolio back to the intended target allocation. For this reason, they should require compensation in the form of a liquidity premium.
  3. Uncertainty in timing and magnitude of cash flows: Because private equity investors cannot control the timing or size of private equity fund cash flows, they incur an additional type of risk.
  4. Illiquidity and valuation adjustment: Private equity fund investments cannot easily be accessed and liquidated unless at a discount to NAV in most cases. This implies that liquid asset prices and private equity fund NAVs are not directly comparable.

Therefore, there are three distinct sources of risk when investing into PE:

  1. Market Risk (Systematic risk) which Public Equities also have, and is best measured via decomposition of risk factors (e.g. value and small cap) that are present in the public markets.  This risk is more accurately estimated after unsmoothing the returns from PE.
  2. Illiquidity factor risk that is unique to private equity and not observed in public markets.
  3. Manager (Idiosyncratic to the manager and unsystematic risk of individual companies) risk for the specific manager(s) selected. This is effectively active risk, with the potential to generate excess returns for the risk taken (which is alpha, a great portfolio diversifier).

Portfolio modelling with the inclusion of Private Equity

One of the key issues to consider when incorporating unlisted assets, such as PE, into a portfolio is the smoothed nature of the historical return data, which reflects appraisal-based valuations.

The use of smoothed historical returns results in an underestimation of return volatility.  The underestimation of volatility could lead to an overallocation to PE when undertaking portfolio modelling.

For portfolio modelling purposes, the true underlying risk profile of PE needs to be understood to make a better assessment when comparing and combining with public market assets.

As Vanguard highlight, several “statistical methods have been proposed in the academic literature over the last few decades to try to better understand historical performance. None of them are without shortcomings, which is why there remains no universally agreed-upon approach among academics or practitioners.”

Vanguard follow a time-series technique to “unsmooth” historically reported PE returns.  For a more in-depth discussion please see the Research Paper.

The adjustment to PE returns is presented in the Table below.  Note how Private Equity (adjusted) volatility is 22.6%, up from 10.7% calculated using reported historical PE returns.

The adjusted PE returns results in a more realistic return profile for PE which can be used for portfolio modelling purposes, resulting in more sensible volatility and covariance estimations.  Note historical PE returns have been preserved, only volatility measures have been adjusted.

In addition to estimating unbiased PE return estimates, as above, Vanguard also undertake the following adjustments to the standard portfolio modelling approach to address the issues identified above:

Account for the illiquidity of PE

Vanguard’s portfolio model, VAAM, drops the assumption of low cost and regular rebalancing assumed in standard portfolio modelling frameworks.  Therefore, they assume that PE can not be fully rebalanced.  As they note, “This illiquidity-constrained rebalance feature provides a more accurate representation of the risk-return trade-offs between liquidity premium and risks associated with private equity assessed within the portfolio optimization.”

Explicitly modelling private equity cash flows

Accounting for the uncertainty in timing and magnitude of PE cashflows Vanguard explicitly model cashflows in a multi-asset portfolio.  As noted above, cash needs to put aside for future committed investments (contributions) and timing of distributions (capital returned) also needs to be accounted for.

It is important to note, this nature of PE leads to additional decision making in the management of a multi-asset portfolio that includes PE i.e. where cash tagged for future PE investment should be invested in the interim and decisions around portfolio rebalancing.

Optional valuation adjustment of the illiquid wealth of the portfolio

Vanguard also make an adjustment for the disparity in market value of liquid and illiquid assets.  This reflects that illiquid assets, such as PE, can at times be sold in a secondary market, which more often than not trades at a discount (i.e. lower price) to asset values.

The discount function they implement “effectively converts illiquid wealth into its liquid equivalent.”

The Results

Compared to a multi-asset portfolio of 70% Equities and 30% Fixed Income (70/30) the key results include:

  • Portfolio modelling that ignores private equity’s illiquid characteristics as covered above leads to a higher allocation in PE compared with Vanguard’s enhanced framework (VAAM)
  • VAAM results in the PE allocation within “Equities” to fall from 50% to 30%
  • The sensitivity to key risk parameters include: expectations the manager will generate lower excess returns results in a lower allocation (12% vs 23%); a “lower risk” manager results in a higher PE allocation (36% vs. 23%)
  • For more conservative portfolios, such as a 30/70, although the total equity allocation decreases, the target PE share of total equity does not change materially relative to that of the 70/30 investor.

Please read my Disclosure Statement

Global Investment Ideas from New Zealand. Building more Robust Investment Portfolios.

Drivers of Unexpected Portfolio Return Outcomes – that should be controlled for.

Six reasons could largely explain manager underperformance or the delivery of investment return outcomes different from what is expected.

Conversely, controlling for these “risks” might be the reason why a Manager is consistently adding value.

How a manager controls for the following risks should be considered as part of the due diligence process and in the construction of a multi-manager portfolio:

  1. Levels of uncompensated vs compensated risk
  2. Incidence of underlying portfolio holdings cancelling each other out
  3. Hidden portfolio risks resulting in unintended outcomes
  4. Conventional style-box investing, which leads to index-like performance with higher fees
  5. Over-diversification
  6. Possible attempts to “time” manager changes may prove costly.

The above six risks where identified by Northern Trust following the analysis of $200 billion of assets on more than 200 equity portfolios from 64 institutional investors around the world.  The results surprised many of the institutions involved. 

Northern Trust expressed the above risks as “six common drivers of unexpected Portfolio Results.”

These risks largely explained manager underperformance in single manager portfolios and also multi-manager portfolios.

The analysis highlights, in my opinion, that implementation and portfolio construction are fundamental to capturing value and in delivering excess returns. Although the investment theory and development of investment strategy are important, implementation and portfolio construction are fundamental.  This is an important area to focus on in undertaking manager/strategy due diligence.

To the point, implementation is vital in capturing the desired investment outcomes of any proposed investment strategy.  This is where a lot of value is added, primarily by not detracted value in implementing the desired strategy!

As Northern Trust emphasis, finding a manager that consistently delivers on their investment objectives is certainly important, but it should not be the only area of focus.  Knowing how a manager, or strategy, interacts with the rest of your portfolio can have much more impact over time.

Institutions had nearly 2x more uncompensated vs compensated risk

Northern Trust found that portfolios which became “overcrowded” with uncompensated risks tended to underperform.

Risk needs to be taken to outperform.  Nevertheless, some risks are compensated for over the longer term and others are not.  Norther Trust outlines that some styles are not compensated for over the longer term, e.g. low quality.  They also include currency, and some countries and sectors have also not historically compensated for the risk taken.

From my own experience, managers who control for some of these risks, tend to outperform, primarily because intended risks, such as company specific risks or compensated styles, end up driving investment outcomes.

Norther Trust found a high level of uncompensated risk across all institutional investment segments, including Super Funds, Endowments, Insurance, Corporate Pensions, and Family Offices.

They conclude: “The result of uncompensated risks comprising nearly 50% of total portfolio active risk was generally benchmark-like returns or underperformance.  While sometimes these risks were taken intentionally, we found that many institutions were surprised when they saw the actual numbers.”

Underlying portfolio holdings cancelled each other out – and hurt performance

This risk particularly impacts multi-manager portfolios.

The cancellation effect occurs when managers within a portfolio take opposing positions that offsets each other e.g. one manager goes overweight a stock another manager is underweight, a manager might have a growth bias which offsets a manager with a value bias.

As Northern Trust note, on a standalone basis many managers individually offer high active risk, once combined with other managers a lot of this active risk is cancelled out.

This needs to be considered in the construction of a multi-manager portfolio. 

Northern Trust conclude: “Our analysis uncovered a shocking amount of this cancellation effect.  Nearly 50% of manager active risk was lost.  Capturing just 50% of targeted active risk, while paying 100% of the manager fees, effectively translates into paying 2x more for each realized basis point of active risk than originally thought.”

Hidden Portfolio risks cause unintended outcomes

Northern Trust found that style tilts contributed 29% of active risk on average.  However, other bets where often introduced into a portfolio unintentionally and led to “unpredictable portfolio outcomes.”

Although some styles are a consistent source of excess returns over time, it was unintended style risks that negatively impacted portfolio performance.

Often, these unintended style risks are included when trying to capture a known rewarded risk e.g. value comes with common unintended style risk exposures of low quality and low momentum.

This means meaningful style exposure is lost.

They conclude: “Our research uncovered that 55% of the portfolios had material style conflicts – caused by the cancellation effect – that introduced exposures different from the managers stated objective.  This introduction of conflicting and unintended style exposures left many portfolios with no material exposure to their intended style tilts.”

Conventional style investing led to index like performance with higher fees

This is probably self-evident to many, particularly given the above research conclusions.

Northern Trust found that those portfolios based on conventional style analysis, and those of a core-satellite approach, tended to suffer more from the cancellation effect.

The “style box” approach portfolio was more likely to have managers who took opposing views or two managers where hired to generate an exposure one manager alone could achieve.

As a result, “conventional style investing, whether intentional or not, created a mix of managers that closely mimicked the benchmark and left little chance to outperform.”

Over-diversification diluted performance

The Northern Trust research highlights than “hiring too many managers or building equity portfolios with thousand of securities took a significant toll on performance.”

Obviously, adding managers and combination of strategies can reduce overall portfolio risk, Northern Trust research showed that often the risks reduced where different to what was intended.

Norther Trust conclude: “While there are many approaches to generating excess returns, our research suggests that a greater focus on eliminating uncompensated risks is a critical first step toward potentially increasing a portfolio’s ability to outperform.”

Possible attempts to “time” manager changes may prove costly

Do not chase manager performance.  The Northern Trust research highlighted that historically poor active management performance had resulted in lower allocations to active managers in the following year.  When performance was better, a higher allocation to active managers resulted.

As they conclude: “Finding a manager that consistently delivers on their investment objectives is certainly important, but it should not be the only area of focus.  As evidenced through the preceding discoveries of this report, knowing how a manager will interact with the rest of your portfolio can ultimately be much more impactful over time.”

Access to the Northern Trust Risk Report can be found here.

Please read my Disclosure Statement

Global Investment Ideas from New Zealand. Building more Robust Investment Portfolios.

Coronavirus – Financial Planning Challenges

For those near retirement this year’s global pandemic has thrown up new challenges for them and their Financial Advisor.

Early retirement due to losing a job, the running down of emergency funds, and a low interest rate environment are new challenges facing those about to retire.

Events this year are likely to have significant repercussions for how individuals conduct their financial planning.  Specifically, how they approach spending and saving goals.

The pandemic will likely have lasting implications for how people think about creating their financial and investment plans, and therefore raises new challenges for the Advisors who assist them.

These are the key issues and conclusions outlined by Christine Benz, director of personal finance for Morningstar, in her article, What the Coronavirus Means for the Future of Financial Planning.

In relation to the key issues identified above, Benz writes “All of these trends have implications for the way households—and the advisors who assist them—manage their finances. While the COVID-19 crisis has brought these topics to the forefront, their importance is likely to persist post-pandemic as well.”

Although the article is US centric, there are some key learnings, which are covered below.

How the Pandemic Has Impacted Financial Planning for Emergencies

The Pandemic has highlighted the importance of emergency funds as part of a sound financial plan and the difficulties that many individuals and households face in amassing these “rainy-day funds.”

Lower income families are more at-risk during times of financial emergencies.  Research in the US found that only 23% of lower-income households had emergency funds sufficient to see them through three months of unemployment.  This rises to 52% for middle income households.

It is advisable to have emergency funds outside of super.

The Morningstar article highlights “Withdrawing from retirement accounts is suboptimal because those withdrawn funds can’t benefit from market appreciation—imagine, for example, the worker who liquidated stocks from a retirement account in late March 2020, only to miss the subsequent recovery.”

An emergency fund helps boost peace of mind and provides a buffer and the confidence to maintain longer-term retirement goals.

Financial Advisors can assist clients in setting saving goals to amass an emergency fund, which is specific to their employment situation, and how best to invest these funds so they are there for a rainy day.

From an industry and Policymaker perspective, and reflecting many households struggle to accumulate emergency reserves, Morningstar raised the prospect of “sidecar” funds as potentially part of the solution.

Sidecars “would be for employees to contribute aftertax dollars automatically to an emergency fund. Once cash builds up to the employee’s own target, he could direct future pretax contributions to long-term retirement savings. Automating these contributions through payroll deductions may make it easier for individuals to save than when they’re saving on a purely discretionary basis.”

The concept of sidecar funds has recently been discussed in New Zealand.

Financial Planning for Early Retirement

The prospect of premature retirement will pose an urgent challenge for some clients. 

Although those newly unemployed will consider looking for a new job some may also consider whether early retirement is an option.

The US experience, to date, has been that those workers 55 and older have been one of groups most impacted by job losses.

Morningstar highlight that early retirement is not always in an individual’s best interest, actually, working a few years longer than age 65 can be “hugely beneficial to the health of a retirement plan,”….

They note the following challenges in early retirement:

  • Lost opportunity of additional retirement fund contributions and potential for further compound returns; and
  • Earlier withdrawals could result in a lower withdrawal rate or reduce the probability the funds lasting through the retirement period. 

Financial Advisors can help clients understand the trade-offs associated with early retirement and the impacts on their financial plans.  Often the decision to retire is about more than money.

Individual circumstances in relation to access to benefits, pensions, health insurance, and tax need to be taken into consideration.  Given this, a tailored financial plan, including the modelling of retirement cashflows on a year-to-year basis would be of considerable value.

Accommodating Low Yields in a Financial Plan

The low interest rate (yield) environment is a challenge for all investors. 

Nevertheless, for those in retirement or nearing retirement is it a more immediate challenge.

Return expectations from fixed income securities (longer dated (maturity) securities) are very low.  Amongst the best predictor of future returns from longer dated fixed income securities, such as a 10-year Government Bonds, is the current yield.

In the US, the current yield on the US Government 10-year Treasury Bond is not much over 1%, in New Zealand the 10-Year Government Bond yields less than 1%.  Expected returns on higher quality corporate bonds are not that much more enticing.

As Morningstar note, “These low yields constrain the return potential of portfolios that have an allocation to bonds and cash, at least for the next decade.“

The low yield and return environment have implications as to the sustainability of investment portfolios to support clients throughout their retirement.

The impact of low interest rates on “withdrawal rates” is highlighted in the graph below, which was provided by Morningstar in a separate article, The Math for Retirement Income Keeps Getting Worse, Revisiting the 4% withdrawal rule

The 4% withdrawal rate equals the amount of capital that can be safely and sustainably withdrawn from a portfolio over time to provide as much retirement income as possible without exhausting savings.

For illustrative purposes, the Morningstar article compares a 100% fixed income portfolio from 2013 and 2020 to reflect the impact of changes in interest rates on the sustainability of investment portfolios assuming a 4% withdrawal rate. 

As Morningstar note, since 2013 investment conditions have changed dramatically. When they published a study in 2013 the 30-year Treasury yield was 3.61% and expected inflation was 2.32%. Investors therefore received a real expected payout of 1.29%.

When they refreshed the study in 2020, those figures are 1.42% and 1.76%, respectively.  This implies a negative expected return after inflation.

The graph below tracks the projected value of $1 million dollars invested in 2013 and 2020.  The prevailing 30-year Treasury yields for July 2013 and October 2020, as outlined above, are used to estimate income for each portfolio, respectively, over time.  A “real” 4% withdrawal rate is assumed i.e. the first years $40k withdrawal grows with the inflation rates outlined above.

As can be seen, the 2013 Portfolio lasts up to 30 years, the 2020 Portfolio only 24 years, highlighting the impact of lower interest rates on the sustainability of an investment portfolio.

Financial Advisors can help in determining the appropriate withdrawal rates from an investment portfolio and the trade-offs involved.  They may also be able to suggest different investment strategies to maintain a higher withdrawal rate and the risks associated with this.

This may also include the purchase of annuities, to manage longevity risk (the risk of running out of money in retirement) rather than from the perspective of boosting current portfolio income.

Morningstar suggests that new retirees “should be conservative on the withdrawal rate front, especially because the much-cited “4% guideline” for portfolio withdrawal rates is based on market history that has never featured the current combination of low yields and not-inexpensive equity valuations.”

The 4% withdrawal rate is an industry “rule of thumb”.  Further discussion on the sustainability of the 4% withdrawal rate can be found here.

I have posted extensively about the low expected return environment and the challenges this creates for the Traditional Portfolio of 60% Equities and 40% Fixed Income.

The following Post on what investors should consider doing in the current market environment may be of interest. This Post outlines some investment strategies which may help in maintaining a higher withdrawal rate from an investment portfolio.

Likewise, this Post on how greater customisation of the client’s invest solution is required and who would benefit most from targeted investment advice may also be of interest.

Lastly, Wealth Management.com covers Benz’ article in Retirement Planning in a Pandemic.

Please read my Disclosure Statement

Global Investment Ideas from New Zealand. Building more Robust Investment Portfolios.