I would like to share this blog post by AMP Capital New Zealand, Four pillars for generating income | AMP Capital, which looks at the four main pillars of an investment framework to deliver a stable and sustainable level of income over time.
The Post challenges some of the conventional wisdoms underpinning the management of traditional portfolios.
The basis of the framework is a goal orientated investment approach.
For those wishing to understand more around Goal Based Investing, this Wikipedia page, which I have contributed to, Goal-based investing may be of interest. The Wikipedia page includes:
A description of Goal Based Investing (GBI)
A comparison of GBI to traditional portfolio theory
We need to change the conversation on investment management fees. The debate on fees needs to be based on facts rather than myths. Despite often being framed in this way, the debate on investment management fees is not black versus white.
What matters is not the fee level, but the manager’s ability to deliver a satisfactory outcome to investors after fees. Either way, it is no good paying high fees or the lowest possible fees if your investment objectives have not been achieved. Therefore, amongst the key questions to ask are, are you satisfied with the investment outcomes after the fees you have paid? – have your investment objectives or retirement goals been achieved?
After fee returns are important. Therefore, higher fee investment strategies should not necessarily be avoided if they can assist in meeting your investment objectives. In the current investment environment, the use of higher fee investment strategies may be necessary to achieve your investment objectives.
Therefore, Investors should focus on given the investment outcomes have I minimised the fees paid.
In my mind, this would be consistent with the FMA’s value for money focus. (FMA is New Zealand’s Regulatory)
At the same time, fees should not be the overriding concern and investors must analyse fees in the overall context of managing their portfolios appropriately.
Investment management fee Myths
The 5 most common myths about investment management fees are:
Fees should be as low as possible
Incentive fees are always better than fixed fees
High water marks always help investors
Hedge Funds are where the alpha is. They deserve their high fees
You can always separate alpha from beta, and pay appropriate fees for each
Although all the myths are important, the myth that fees should be as low as possible probably resonates most with investors.
Investment management fees for active management are higher than index management and involve a wealth transfer from the investor to the investment manager. This is a fact.
However, the paper is clear, investors should look to maximise excess returns (they term alpha) after fees. Another way of looking at this, for a given level of excess returns, fees should be minimised. This is an important concept when considering the discussion below around broadening the discussion on fees.
The paper also notes, investors should pay higher fees to those managers that are more consistent. For example, if two managers provide the same level of excess return, but one does so by taking less risk, investors should pay higher fees to this manager (the manager who achieves the same excess return but with lower risk – technically speaking, this is the manager with the higher information ratio).
In summary, the take-outs on the myth fees should be as low as possible:
Fees must remain below expected excess returns e.g., a manager that charges active fees but only delivers enhanced index returns should be avoided.
Managers who consistently add value warrant higher fees.
The paper on the five fee myths is wide ranging. It also provides insights into the key elements of the fee negotiation game and determining the conditions under which higher fees should be paid.
Key conclusions from the article, particularly after addressing Myth 4 & 5:
most investment strategies offer a combination of cheaply accessible market index returns (beta) and active management excess returns (alpha). While many institutional investors look to separate beta and alpha for most investors this is too limiting and difficult. Many talented investment managers appear in investment strategies which include both beta and excess returns (alpha).
Investors should consider fees before deciding on an investment strategy, not look at an investment strategy and then consider fees.
At the same time, fees should not be the overriding concern.
High fee investment strategies are worthwhile if they deliver sufficient return and lower risk.
Investors must analyse fees in the overall context of managing their portfolios appropriately.
A framework for Changing the discussion on fees
Despite it often framed this way, the debate on fees is not black versus white.
From this respective, understanding the disaggregation of investment returns can help in broaden the debate on fees and also help determine the appropriateness of fees being paid.
From a broad view, investment returns can be disaggregated in to the following three parts:
Market beta. Think equity market exposures to the NZX50 or S&P 500 indices (New Zealand and America equity market exposures respectively). Market Index funds provide market beta returns i.e. they track the returns of the market e.g. S&P 500 and NZX50. Beta is cheap, as low as 0.01% for large institutional investors.
Factor betas and Alternative hedge fund beta exposures. Of the sources of investment returns these are a little more ambiguous and contentious than the others. This mainly arises from use of terminology and the number of investable factors that are rewarding. My take is as follows, Factor betas and Alternative hedge fund beta fit between market betas (above) and alpha (explained below).
Factor Beta exposures. These are the factor exposures for which I think there are a limited number. The common factors include value, momentum, low volatility, size, quality/profitability, carry. They are often referred to as Smart beta.
Alternative hedge fund betas. Many hedge fund returns are sourced from well understood investment strategies. Therefore, a large proportion of hedge fund returns can be explained by common hedge fund risk exposures, also known as hedge fund beta or alternative risk premia or risk premia. Systematic, or rule based, investment strategies can be developed to capture a large portion of hedge fund returns that can be attributed to a hedge fund strategy (risk premia) e.g. long/short equity, managed futures, global macro, and arbitrage hedge fund strategies. The alternative hedge fund betas do not capture the full hedge fund returns as a portion can be attributed to manager skill, which is not beta and more easily accessible, it is alpha.
Alpha is what is left after all the betas. It is manager skill. Alpha is a risk adjusted measure. In this regard, a manager outperforming an index is not necessarily generating alpha. The manager may have taken more risk than the index to generate the excess returns and/or they may have an exposure to one of the factor betas or hedge fund betas which could have been captured more cheaply to generate the excess return. In short, what is often claimed as alpha is often explained by a factor or alternative hedge fund beta outlined above. Albeit, there are some managers than can deliver true alpha. Nevertheless, it is rare.
These broad sources of return are captured in the diagram below, provided in a hedge fund industry study produced by the AIMA (Alternative Investment Management Association).
The disaggregation of return framework is useful for a couple of important investment considerations. We can use this framework to determine:
Appropriateness of the fees paid. Obviously for market beta low fees are paid e.g. index fund fees. Fees increase for the factor betas and then again for the alternative hedge fund betas. Lastly, higher fees are paid to obtain alpha, which is the hardest to produce.
If a manager is adding value – this was touched on above. Can a manager’s outperformance, “alpha”, be explained by “beta” exposures, or is it truly unique and can be put down to manager skill.
The consideration of this framework is consistent with the observations from the article above covering the 5 myths of Investment Management Fees.
Lastly, personally I think a well-diversified portfolio would include an exposure to all of the return sources outlined above, at the very least.
Many institutional investors understand that true portfolio diversification does not come from investing in many different asset classes but comes from investing in different risk factors. See More Asset Classes Does not Equal More Diversification.
From this perspective, the objective is to implement a portfolio with exposures to a broad set of different return and risk outcomes.
There are several options available for investors who are relying on fixed income investments to generate income in the current extremely challenging environment – characterised by low short-term rates and rising longer-term interest rates.
Short-term fixed income funds and private debt funds are two examples. Both seek to deliver a healthy return above cash and term deposits. They achieve this in a variety of ways, chiefly by gaining exposure to different investment risks.
In addition, active management is an important source of return from short-tern fixed income funds. And exposure to the illiquidity premium is a source of “excess” returns in relation to private debt funds.
Crucial to success in the current environment is an investor’s perception and measurement of risk.
In measuring risk, investor focus should be on avoiding permanent loss of capital, rather than volatility of capital and investment returns.
So long as permanent loss of capital is appropriately managed, investors should be prepared to accept a higher volatility of capital from their fixed income investments, along with less liquidity.
Such an approach will likely result in higher and more consistent levels of income in retirement.
Short-term fixed income funds
Short-term fixed income funds are actively managed fixed income funds that seek to take advantages of opportunities in short-term fixed income and credit markets to generate returns above cash and term deposits.
Although short-term fixed income funds target a lower average portfolio duration, they are often able to invest in securities that have up to 5 years until they mature. (Duration is a measure of a security and portfolio’s sensitivity to movements in interest rates. The higher a portfolio’s duration the more volatile it will be. A portfolio rises in value when interest rates fall and decreases in value when interest rates rise. Duration is measured in years.)
The target duration on “short-term fixed income funds” can vary materially, from less than 1 year and up to a maximum of three years.
Likewise, credit quality can vary significantly between different funds, ranging from high quality investment grade exposures to sub-investment grade (High Yield). On a more technical note, and often not considered, the credit duration of these funds can also vary, particularly in relation to the maximum term of credit security invested in. Like interest rate duration, credit duration is measured in years and the higher the credit duration the more volatile will be the security or portfolio.
Some of the short-term fixed income funds can also invest into inflation-linked securities, an additional diversifying source of return and risk exposure for a portfolio. And maybe a valuable addition to portfolios in the years ahead.
Funds also differ in the countries they invest into, from domestic markets (e.g. New Zealand and Australia) to internationally, including the emerging markets.
Therefore, there is a very broad spectrum of Funds in this category and fund selection should be undertaken relative to risk tolerances and any investment mandate constraints where applicable e.g. limits on credit quality.
In my mind, a broad investment mandate is better. This provides more opportunity for a manager to add value and manage portfolio risks – should they have the skill, resources, and capabilities to do so.
Lastly, short-term fixed income funds are generally highly liquid, and more liquid than term deposits.
My approach would be to implement as broad an investment strategy as possible given the constraints of fees, risk tolerance, and access to appropriate vehicles.
There are a number of these funds in the marketplace. For a Kiwi Investor, a strategy denominated in New Zealand dollar terms should be preferred.
Private Debt Funds
For those investors with a longer-term investment horizon and can maintain within their portfolio illiquid investments, Private Debt Funds offer the potential to boost returns, not only in the current investment environment, in the future as well.
Typically, the term “private debt” is applied to debt investments which are not financed by banks (non-bank lending) and are not issued or traded in an open market.
Private debt falls into a broader category termed ‘alternative debt’ or ‘alternative credit’, and is used interchangeably with ‘direct lending’, ‘private lending’ and ‘private credit’.
Within the private debt market, investors lend to investee entities – be they corporate groups, subsidiaries, or special purpose vehicles established to finance specific projects or assets – in the same way that banks lend to such entities.
Private debt investments are often used to finance business growth and provide working capital.
Private Debt Funds invest in loans to a wide range of borrowers such as public and private companies, infrastructure providers, property developers, and project finance groups.
Private Debt has been one of the fastest-growing asset classes. Part of this growth reflects a change in debt markets since the Global Financial Crisis (GFC) and a corresponding demand from investors, attracted by the return potential and a broader set of credit investment opportunities to invest in.
Illiquidity Risk Premium
To generate returns over cash and term deposits investors need to take on more risk.
Arguably the most efficient way to take on more risk is to invest into a diversified range of risk premiums. The best known risk premiums are value, growth, momentum, and to a lesser extent low volatility. Equity markets, interest rates, and credit are also risk premiums. Good active managers will add value over and above, or independently, of all these premiums.
There is also an illiquidity risk premium, which is often underrepresented in portfolios.
The illiquidity premium is the additional compensation to investors for not being able to access their capital for a specific period.
As a result, illiquid investments, such as Private Debt, should offer a “premium” in the form of higher yield expectations.
These higher relative yields could be a helpful in boosting income in the current environment and in the future.
Measuring Risk
“Risk means, more things can happen than will happen”, Elroy Dimson.
An investor’s perception and measurement of risk are important in managing an investment portfolio.
Perception toward risk is critical. For example, often, adding new “risks” to a portfolio leads to a less risky portfolio.
Most importantly, in managing investment risks, the ability to think in terms of probabilities is important. This involves understanding and appreciating the likelihood/chance of an event occurring and then the expected impacts of that event occurring to all parts of the portfolio.
In relation to measurement of risk, investor focus should be on avoiding permanent loss of capital, rather than measuring risk as fluctuations in capital and returns.
Warren Buffett understands this concept of risk very well. And, it has not done him any harm implementing this approach to risk!
Accordingly, investors would do better thinking along these lines in relation to risk.
So long as permanent loss of capital is appropriately managed, investors should prepare to accept a higher volatility of capital from their fixed income investments and less liquidity.
Such an approach will likely result in higher and more consistent levels of income in retirement.
Six reasons could largely explain manager underperformance or the delivery of investment return outcomes different from what is expected.
Conversely, controlling for these “risks” might be the reason why a Manager is consistently adding value.
How a manager controls for the following risks should be considered as part of the due diligence process and in the construction of a multi-manager portfolio:
Levels of uncompensated vs compensated risk
Incidence of underlying portfolio holdings cancelling each other out
Hidden portfolio risks resulting in unintended outcomes
Conventional style-box investing, which leads to index-like performance with higher fees
Over-diversification
Possible attempts to “time” manager changes may prove costly.
The above six risks where identified by Northern Trust following the analysis of $200 billion of assets on more than 200 equity portfolios from 64 institutional investors around the world. The results surprised many of the institutions involved.
Northern Trust expressed the above risks as “six common drivers of unexpected Portfolio Results.”
These risks largely explained manager underperformance in single manager portfolios and also multi-manager portfolios.
The analysis highlights, in my opinion, that implementation and portfolio construction are fundamental to capturing value and in delivering excess returns. Although the investment theory and development of investment strategy are important, implementation and portfolio construction are fundamental. This is an important area to focus on in undertaking manager/strategy due diligence.
To the point, implementation is vital in capturing the desired investment outcomes of any proposed investment strategy. This is where a lot of value is added, primarily by not detracted value in implementing the desired strategy!
As Northern Trust emphasis, finding a manager that consistently delivers on their investment objectives is certainly important, but it should not be the only area of focus. Knowing how a manager, or strategy, interacts with the rest of your portfolio can have much more impact over time.
Institutions had nearly 2x more uncompensated vs compensated risk
Northern Trust found that portfolios which became “overcrowded” with uncompensated risks tended to underperform.
Risk needs to be taken to outperform. Nevertheless, some risks are compensated for over the longer term and others are not. Norther Trust outlines that some styles are not compensated for over the longer term, e.g. low quality. They also include currency, and some countries and sectors have also not historically compensated for the risk taken.
From my own experience, managers who control for some of these risks, tend to outperform, primarily because intended risks, such as company specific risks or compensated styles, end up driving investment outcomes.
Norther Trust found a high level of uncompensated risk across all institutional investment segments, including Super Funds, Endowments, Insurance, Corporate Pensions, and Family Offices.
They conclude: “The result of uncompensated risks comprising nearly 50% of total portfolio active risk was generally benchmark-like returns or underperformance. While sometimes these risks were taken intentionally, we found that many institutions were surprised when they saw the actual numbers.”
Underlying portfolio holdings cancelled each other out – and hurt performance
This risk particularly impacts multi-manager portfolios.
The cancellation effect occurs when managers within a portfolio take opposing positions that offsets each other e.g. one manager goes overweight a stock another manager is underweight, a manager might have a growth bias which offsets a manager with a value bias.
As Northern Trust note, on a standalone basis many managers individually offer high active risk, once combined with other managers a lot of this active risk is cancelled out.
This needs to be considered in the construction of a multi-manager portfolio.
Northern Trust conclude: “Our analysis uncovered a shocking amount of this cancellation effect. Nearly 50% of manager active risk was lost. Capturing just 50% of targeted active risk, while paying 100% of the manager fees, effectively translates into paying 2x more for each realized basis point of active risk than originally thought.”
Hidden Portfolio risks cause unintended outcomes
Northern Trust found that style tilts contributed 29% of active risk on average. However, other bets where often introduced into a portfolio unintentionally and led to “unpredictable portfolio outcomes.”
Although some styles are a consistent source of excess returns over time, it was unintended style risks that negatively impacted portfolio performance.
Often, these unintended style risks are included when trying to capture a known rewarded risk e.g. value comes with common unintended style risk exposures of low quality and low momentum.
This means meaningful style exposure is lost.
They conclude: “Our research uncovered that 55% of the portfolios had material style conflicts – caused by the cancellation effect – that introduced exposures different from the managers stated objective. This introduction of conflicting and unintended style exposures left many portfolios with no material exposure to their intended style tilts.”
Conventional style investing led to index like performance with higher fees
This is probably self-evident to many, particularly given the above research conclusions.
Northern Trust found that those portfolios based on conventional style analysis, and those of a core-satellite approach, tended to suffer more from the cancellation effect.
The “style box” approach portfolio was more likely to have managers who took opposing views or two managers where hired to generate an exposure one manager alone could achieve.
As a result, “conventional style investing, whether intentional or not, created a mix of managers that closely mimicked the benchmark and left little chance to outperform.”
Over-diversification diluted performance
The Northern Trust research highlights than “hiring too many managers or building equity portfolios with thousand of securities took a significant toll on performance.”
Obviously, adding managers and combination of strategies can reduce overall portfolio risk, Northern Trust research showed that often the risks reduced where different to what was intended.
Norther Trust conclude: “While there are many approaches to generating excess returns, our research suggests that a greater focus on eliminating uncompensated risks is a critical first step toward potentially increasing a portfolio’s ability to outperform.”
Possible attempts to “time” manager changes may prove costly
Do not chase manager performance. The Northern Trust research highlighted that historically poor active management performance had resulted in lower allocations to active managers in the following year. When performance was better, a higher allocation to active managers resulted.
As they conclude: “Finding a manager that consistently delivers on their investment objectives is certainly important, but it should not be the only area of focus. As evidenced through the preceding discoveries of this report, knowing how a manager will interact with the rest of your portfolio can ultimately be much more impactful over time.”
Access to the Northern Trust Risk Report can be found here.
Kiwi Investor Blog has published over 150 Posts, so far!
Thank you to those who have provided support, encouragement, and feedback. It has been greatly appreciated. Kiwi Investor Blog achieved 100 Posts in October 2019.
Consistent with the current investment environment and the outlook for future investment returns, the key themes of the Kiwi Investor Blog Posts over the last twelve months have been:
Future returns are unlikely to be as strong as those experienced over the last decade
Investment strategies for the next decade likely to include real assets, tail risk hedging, and a greater allocation to alternatives e.g. Private Equity
What portfolio diversification is, and looks like
Positioning portfolios for the likelihood of higher levels of inflation in the future
Time to move away from the traditional Diversified Balanced Portfolio
Occasions when active Management is appropriate and where to find the more consistently performing managers – who outperform
Investing for Endowments, Charities, and Foundations
Navigating a Bear market, including the benefits of disciplined portfolio rebalancing
Links to the key Posts to each of these themes is provided below.
Kiwi Investor Blog’s primary objective is to make available insights into Institutional investment strategies, practices, and processes to a wider audience in simple language.
The Posts are written in the spirit of encouraging industry debate, challenging the status quo and “conventional wisdoms”, and striving to improve investment outcomes for clients.
Future returns are unlikely to be as strong as those experienced over the last decade
Theses Post are consistent with the global trend toward the increasing allocations toward alternatives within investment portfolios. This survey by CAIA highlights the attraction of alternatives to investors and likely future trends of this growing investment universe, including greater allocations to Private Equity and Venture Capital.
Reflecting the current investment environment and outlook for investment returns, recent Posts have focused on the topic of Portfolio Diversification. These Posts have complemented the Posts above on particular investment strategies.
A different perspective was provided with a look at the psychology of Portfolio Diversification. Diversification is hard in practice, easy in theory, it often involves the introduction of new risks into a Portfolio and there is always something “underperforming” in a truly diversified portfolio. This was one of the most read Posts over the last six months.
Positioning Portfolios for the likelihood of higher levels of inflation in the future
Investors face the prospects of higher inflation in the future. Although inflation may not be an immediate threat, this article by Man strongly suggests investors should start preparing their Portfolio for a period of higher inflation.
The challenge of the current environment is also covered in this Post, which provides suggestions for Asset Allocations decisions for the conundrum of inflation or deflation.
Time to move away from the traditional Diversified Portfolio
A key theme underpinning some of the Posts above is the move away from the traditional Diversified Portfolio (the 60/40 Portfolio, being 60% Equities and 40% Fixed Income, referred to as the Balance Portfolio).
My most recent Post (#152) highlights that the Traditional Diversified Fund is outdated as it lacks the ability to customise to the client’s individual needs. Modern day investment solutions need to be more customised, particularly for those near and in retirement.
Occasions when active Management is appropriate and where to find the more consistently performing managers
Recent Posts have also covered the role of active management.
This Post highlighted the benefits of remaining disciplined during periods of market volatility, even as extreme as experienced this year, particularly the benefits of Rebalancing Portfolios.
Likely poor performing investment managers are relatively easy to identify. Great fund managers much more difficult to identify.
Good performing managers who can consistently add value over time can be identified. Albeit, a well-developed and disciplined investment research process is required.
Those managers that consistently add value are likely to be found regularly in the second quartile of peer analysis. They are neither the best nor the worst performing manager but over time consistently add value over a market index or passive investment. They are not an average manager.
These are key insights I have developed from just under 30 years of researching and collaborating with high calibre and talented investment professionals.
More importantly, modern day academic research is supportive of this view. The conventional wisdom of active management is being challenged, as highlighted in a previous Post.
The author, John Paterson, of this analysis was interviewed in a i3 article.
The key points of Peterson’s analysis and emphasized in the i3 article:
Many of the studies into the ability of active managers to consistently outperform are inherently flawed.
Most of these studies merely confirm that financial markets are not static, therefore they do not say anything about manager performance.
“The failure to find repeated top quartile performance in these ‘tests of manager consistency’ simply reflects the reality that markets are not Static, and says nothing about the existence, or otherwise, of manager consistency.”
The key flaw is that many of the studies on active management focus on the performance of only the top performing managers: whether top quartile performers are able to repeat their efforts from one period to the next.
A wider view of manager performance should be considered, all quartiles should be assessed to determine whether manager performance is random or not.
Those managers that that consistently achieved above average returns are more likely to be found in the second or third quartiles.
In the i3 interview, Paterson discusses more about the results of their research:
“Someone who consistently outperforms doesn’t necessarily look like a top quartile manager. They are more likely to be found in the second quartile,”.
The following comment is also made:
“Most asset managers intuitively know this, because markets are cyclical and if you do something that shoots the lights out in one period, it is likely to do the complete opposite in another period.”
The Australian Experience
Paterson’s analysis also found “Across the studies analysed, it was found that there is very strong evidence that investment managers available to Australian superannuation funds do perform consistently.”
Lastly Paterson comments “And experience tells us that super funds with more active managers have done better than those with largely passive mandates, and often at a lower level of volatility.”
Concluding Remarks
As I have previously Posted, there are a wide range of reasons for choosing an alternative to passive investing over and above the traditional industry debate that focuses on whether active management can outperform.
Other reasons for considering an alternatives to a passive index include no readily replicable market index exists, imbedded inefficiency within the Index, and available indices are unsuitable in meeting an investor’s objectives (e.g. Defined Pension Plans).
The decision to choose an alternative to passive investing varies across asset classes and investors.
Therefore, the traditional active versus passive debate needs to be broadened.
The article by Warren and Ezra, covered in a previous Post, When Should Investors Consider an Alternative to Passive Investing?, seeks to reconfigure and broaden the active versus passive debate.
They provide five reasons why investors might consider alternatives to passive management.
In doing so they provide examples of circumstances under which an alternative to passive management might be preferred and appreciably widen the debate.
The identification of managers that consistently add value is one reason to consider an alternative to passive management.
One of the key questions facing investors at the moment is whether inflation or deflation represents the bigger risk in the coming years.
Now more than ever, given the likely economic environment in the years ahead, investors need to consider all their options when building a portfolio for their future. This may mean a number of things, including: increasing diversification, investing in new or different markets, being active, and flexible to take advantage of unique opportunities as they arise.
Those portfolios overly reliant on traditional markets, such as equities and fixed income in particular, run the risk of failing to meet to their investment objectives over the next ten years.
Conundrum Facing Investors
A recent article by Alan Dunne, Managing Director, Abbey Capital, The Inflation-Deflation debate and its Implications for Asset Allocation, which recently appeared in AllAboutAlpha.com, clearly outlines the conundrum currently facing investors.
As the article highlights, one of the “key questions facing investors at the moment is whether inflation or deflation represents the bigger risk for the coming years. Economists are split on this….”
Following a detailed analysis of the current and likely future economic environment and potential influences on inflation or deflation (which is well worth reading) the article covers the Implications for Asset Allocations.
Inflation or Deflation: Implications for Asset Allocations
The article makes the following observations as far as asset class performance in different inflation environments, based on historical observations:
Deflation like in the 1930s, is negative for equities but positive for Bonds.
If inflation picks ups, or even stagflation, that would be negative for real returns on financial assets and real assets may be favoured.
They conclude: “the current uncertainty highlights the importance of holding diversified portfolios, with exposure to a range of traditional and alternative assets and strategies with the potential to deliver returns in different market environments.”
Current Environment
Abbey Capital anticipate greater co-ordination of policy between governments (fiscal policy) and central banks (monetary policy).
As they note, “many economists draw a parallel between the current scenario and the substantial increase in government debt during World War II. One of the consequences of higher debt levels is that we may see pressure on central banks to maintain interest rates at low levels and maintain asset purchases to ensure higher bond issuance is not disruptive for bond markets i.e. coordination of monetary and fiscal policies.”
I think this will be the case. The Bank of Japan has maintained a direct yield curve control policy for some time and the Reserve Bank of Australia has implemented a similar policy recently. Direct yield curve control is where the central bank will target an interest rate level for the likes of the 3-year government bond.
In the environment after World War II debt levels were brought back to more manageable levels by keeping interest rates low (a process known as financial repression).
From a government policy perspective, financial repression reduces the real value of debt over time. It is the most palatable of a number of options.
Financial repression is potentially negative for government bonds
With interest rates so low, and likely to remain low for some time given policies of financial repression the real return (after inflation) on many fixed income instruments and cash could be negative.
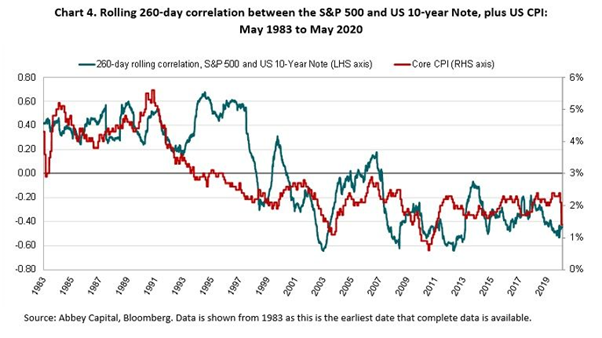
A higher level of inflation not only reduces the real return on bonds but potentially also reduces the diversification benefits of holding bonds in a portfolio with equities.
The diversification benefits of bonds in the traditional 60 / 40 equity-bond portfolio (Balanced Portfolio) has been a strong tail wind over the last 20 years.
The more recent low correlation between bonds and equities is evident in the Chart below, which was presented in the article.
The Chart also highlights that the relation of low correlation between equities and bonds, which benefits a Balanced Portfolio, has not always been present.
As can be seen in the Chart, in the 1980s, when inflation was a greater concern, inflation surprises were negative for both bonds and equities, they became positively correlated.
What should investors do?
“Investors are therefore left with the challenge of finding alternatives for government bonds, ideally with a low or negative correlation to equities and protection against possible inflation.”
The article runs through some possible investment solutions and approaches to meet the likely challenges ahead. I have outlined some of them below.
I think duration (interest rate risk) and credit can still play a role within a broad and truly diversified portfolio. Within credit this would likely involve expanding the universe to include the likes of high yield, securitised loans, private debt, inflation protections securities, and emerging market debt as examples.
The key and most important point is that a robust portfolio will be less reliant on tradition asset classes, traditional asset class betas, to drive investment return outcomes. This is likely to be vitally important in the years ahead.
Accordingly, investors will need to be more active, opportunistic, and maintain very broad and truly diversified portfolios. Not only within asset classes, such as the fixed income example provided above, but across the portfolio to include the likes of real assets and liquid alternatives.
Real assets
Abbey Capital comment that “Real assets such as property and infrastructure should provide protection against higher inflation for long-term investors but may not be attractive for investors valuing liquidity.”
Although the maintenance of portfolio liquidity is important, Real assets can play an important role within a robust portfolio.
For the different types of real assets, their investment characteristics, and likely performance and sensitivity to different economic environments, including economic growth, inflation, inflation protection, stagflation, and stagnation please see the Kiwi Investor Blog Post, Real Assets Offer Real Diversification. The extensive analysis has been undertake by PGIM.
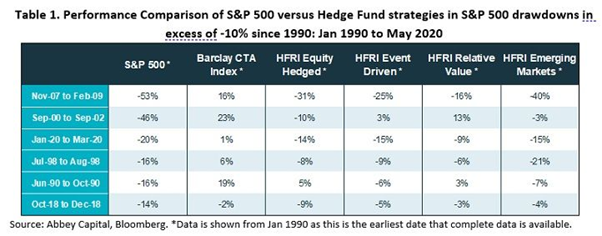
Liquid Alternatives
Abbey Capital provide a brief discussion on liquid alternatives with a focus on managed futures. Not surprisingly given their pedigree.
They provide the following Table which highlights the benefit of liquid alternatives and hedge funds at time of significant sharemarket declines (drawdowns).
Concluding Remarks
Being a managed futures manager, it is natural to be cautious of Abbey Capitals concluding remarks, being reminded of the Warren Buffet quote, “Never ask a barber if you need a haircut.”
Nevertheless, the Abbey Capital’s economic analysis and investment recommendations are consistent with a growing chorus, all singing from a similar song sheet. (Perhaps we could call this a “Barbers Quartet”!)
Without having an axe to grind, and in all seriousness, I have covered similar analysis and comments in previous Posts, the conclusions of which have a high degree of validity and should be considered, if not a purely from portfolio risk management perspective so as to understand any gaps in current portfolios for a number of likely economic environments.
The key and most important point is that robust portfolios will be less reliant on traditional asset classes, traditional asset class betas, to drive investment return outcomes.
Accordingly, investors will need to be more active, opportunistic, and maintain very broad and truly diversified portfolios
Therefore, it is hard to disagree with one of the concluding remarks by Abbey Capital “To account for the competing requirements in a portfolio of returns, low correlation to equities, liquidity and possible inflation protection, investors may need to build robust portfolios with a broader mix of assets and strategies.”
Other Reading
For those interested, previous Kiwi Investor Blog posts of relevance to the Abbey Capital article include:
Preparing your Portfolio for a period of Higher Inflation, this is the Post of most relevance to the current Post, and covers a recent Man article which undertook an analysis of the current economic environment and historical episodes of inflation and deflation.
Man conclude that although inflation is not an immediate threat, the likelihood of a period of higher inflation is likely in the future, and the time to prepare for this is now. Man recommends several investment strategies they think will outperform in a higher inflation environment.
It also includes analysis by PIMCO, where it is suggested to “diversify your diversifiers”.
Lastly, Sharemarket crashes – what works best in minimising losses, market timing or diversification, covers a research article by AQR, which concludes the best way to manage periods of severe sharemarket decline is to have a diversified portfolio, it is impossible to time these episodes. AQR evaluates the effectiveness of diversifying investments during sharemarket drawdowns using nearly 100 years of market data.
There are a wide range of reasons for choosing an alternative to passive investing over and above the traditional industry debate that focuses on whether active management can outperform an index.
Reasons for considering alternatives include no readily replicable market index exists, available indices are unsuitable in meeting an investor’s objectives, and/or there are some imbedded inefficiency within the Index.
Under these circumstances a passive approach no longer becomes optimal nor appropriate.
Or quite simply, an active manager with skill can be identified, this alone is sufficient to consider an alternative to passive indexing.
Importantly, the decision to choose an alternative to passive investing is likely to vary across asset classes, investors, and time.
Also, the active versus passive debate needs to be broadened, which to date seems too narrowly focused on comparing passive investments with the average returns from active equity managers.
Framework for choosing an Alternative to Passive Investing
They do this by presenting a framework for a more comprehensive consideration of alternatives to passively replicating a standard capitalisation-weighted index in any particular asset class.
In doing so they provide examples of circumstances under which a particular alternative to passive management might be preferred.
They offer no conclusions as to whether any specific approach is intrinsically superior. “Indeed, the overarching message is that best choices can vary across asset classes, investor circumstances, and perhaps even time.”
Warren and Ezra provide the following Framework for choosing an Alternative to Passive Investing:
Their framework appreciably widens the range of reasons for choosing an alternative to passive investing.
As can be seen in the Table above, they have identify five potential reasons investors should seek an alternative to passive index.
The first three reflect situations where a passive index is either unavailable or unsuitable, and two relate to investor expectations that active management can outperform passive benchmarks.
Below I have provided a description of the five reasons investors should seek an alternative to passive index.
Back ground Comments
Warren and Ezra provide some general comments on the state of the industry debate:
They think it is unreasonable to base broad conclusions about the relative efficacy of passive indexing on active managers’ average results in a single asset class or subclass, such as U.S. equities. They note, “What holds true in one market segment may not hold in another.”
They also object to the “implicit assumption that in the absence of demonstrable stock-selection skills among managers, passive index replication provides optimal exposure for investors.” This assumption does not take into account differences in investor objectives and circumstances. This is one of the core points of their article.
They maintain, what is missing in the industry debate is “recognition that appropriate structuring and management of investments may well depend on investors’ relative situations.”
Some Context
The default position for passive investing is a capitalisation-weighted (cap-weighting) index, such as the New Zealand NZSX 50 Index and US S&P 500.
Although somewhat technical, the application of a cap-weighting index rests on the three assumptions outlined below.
A breach in any of the following assumptions could justify giving consideration to an alternative approach to passive indexing.
Market efficiency.
Cap-weighting should be chosen under an assumption of perfectly efficient markets, where prices are always correct. Investors may consider alternatives if they believe markets are not fully efficient and that the repercussions of any inefficiencies can be either avoided or exploited.
Cap-weighting is aligned with investor objectives.
It is assumed that cap-weighting indices are aligned with investor objectives. However, this is not always the case. As we see below, a Defined Benefit plan most likely has different objectives relative to a cap-weighted fixed income index.
The same is true for an endowment, insurance company, or foundation.
Index efficacy.
The view of passive indexing as the default assumes that an index is available for the intended purpose. The theoretical view calls for indexes that effectively embody the market portfolio. The industry view requires indexes that deliver the desired type of asset class exposure. In practice, it is possible that for a given asset class no market index exists, or that available indexes have shortcomings in their construction.
The five reasons below for when investors might prefer an alternative to a passive approach are in situations where these three critical assumptions for passive indexing are broken. In such situations passive index is likely to be inappropriate.
The reasons below, also highlight the point that the active versus passive debate often fails to take into account differences in investor objectives and circumstances. The debate needs to be broadened.
Reason #1: No Readily Replicable Index is Available
Passive investing assumes an effective index exists that can be easily and readily replicated.
In some instances, an appropriate index to replicate is simply not available, for example:
Unlisted assets such as Private Equity, unlisted infrastructure and direct property
Within listed markets were a lack of liquidity exists it becomes difficult to replicate the index, such as small caps, emerging market equities, and high-yield debt.
In these incidences, although a passive product may be available, they “might not deliver a faithful replication of the asset class at low cost.” Accordingly passive investing is not appropriate.
Reason #2: The Passive Index Is at Odds with the Investor’s Objectives
Often a passive index is badly aligned with an investor’s objectives. In such cases an alternative approach may better meet these objectives, often requiring active management to deliver a more tailored investment solution.
By way of example:
Defined Benefit Pension Plan and tailored fixed-income mandates.
Best practice for a Defined Benefit (DB) plan is to implement a tailored fixed income mandate that closely matches expected liabilities.
In such a case a passive index approach is not appropriate given the duration and cashflows of the DB plan are unique and highly unlikely to be replicated by an investment into a passive index based on market capitalisation weights.
DB plan managers may also likely prefer more control over other exposures, such as credit quality relative to a passive index.
Such situations also exits for insurance companies, endowments, and foundations.
Notably, an individual investor has a unique set of future liabilities, represented by their own cashflows and duration. Accordingly, investing into a passive market index product may not be appropriate relative to their investment objectives. A more active decision should be made to meet cashflow, interest rate risk, and credit exposure objectives.
Listed infrastructure provides another example where the passive index may be at odds with the investor’s goals. Some investors may want to target certain sectors of the universe that provides greater inflation protection, thus requiring a different portfolio relative to that provided by a passive market index exposure.
The article also provides example in relation to Sustainable and ethical investing and Tax effectiveness.
Reason #3: The Standard Passive Index is Inefficiently Constructed
Where alternatives are available, it makes no sense to invest in an inefficient index. This represents a suboptimal approach, particularly if an alternative can deliver a better outcome.
The article presents two potential reasons an index might be inefficient and proves three examples.
They comment that an index might be inefficient for the following reasons:
the index is built on a narrow or unrepresentative universe; and
the index is constructed in a way that builds in some inefficiency.
As they highlight, these issues are best outlined through the discussion of examples. I briefly cover two.
Equities
Alternative indexing/passive approaches such as factor investing and fundamental investing are “active” decision relative to a market-capitalised index.
The basis for these alternative approaches is that equity capital market indices are flawed (Fundamental Investing) and inefficient (e.g. factor investing such as value and small caps outperform the broader market over time).
Fixed income
There are many shortcomings of fixed-income indices, the article focuses on two:
Fixed income indices do not fully represent the asset class. Therefore, more efficient portfolios may be built by including off-benchmark securities.
The largest issuers dominate fixed income indices and it can be argued these are the less attractive governments/companies to invest in, because they are most in need of funding (and hence of lower quality), or are issuing debt to take advantage of low interest rates, which are unattractive to the investor.
Reasons #4 and #5 The final two reasons are more aligned with the traditional question of whether investors can access managers that can be expected to outperform the index.
Reason #4 features that could lead to active investment managers outperforming the passive alternative in aggregate.
Active management is often defined as a zero-sum game before transaction costs, and a negative-sum game after transaction costs. Therefore, active management as a whole cannot outperform.
However, this dynamic need not apply to all investors and it is quite likely that there is a subsector of investors that can consistently outperform the index.
Therefore, a review of the environment in which managers operate might establish if they are able to maintain a competitive advantage.
The following features are outlined in the article to support such a situation:
Market inefficiency situations
Market inefficiencies offer the potential for active managers to outperform the index, nevertheless managers need to be appropriately placed to capture any excess rewards of these inefficiencies.
The following situations may provide a manager with a competitive advantage:
Information advantage: An active manager could have an advantage where the market is “widely populated by less-informed investors” e.g. emerging markets and small caps.
Preferential access to desirable assets: e.g. where active managers have better access to initial public offerings and sourcing lines of stock. In unlisted markets private equity manager has well established relationships and ability to provide capital and/or appropriate skills.
Economic value-add: e.g. in unlisted assets active management can add value to the underlying asset.
Opportunities arising from differing investor objectives
Opportunities for active management to benefit may exist when:
Some investors are comfortable with earning below-market returns e.g. investors who place greater weight on liquidity or are not willing to accept certain risk exposures
Investors have differing time horizons e.g. value investors exploit short-term focus of markets
Index fails to cover the opportunity set
The article makes the following points under this heading:
There is the potential to outperform by investing outside the index whenever the index does not provide a comprehensive coverage of the available market
The intensity of competition is also a factor in success or otherwise of an active manager. For example, the results on manager skill of the highly institutionalise US market may not translate into other markets and asset class where competition is less fierce.
Cyclicality of markets needs to be considered, with managers likely to perform in different market environments i.e. they tend to underperform when cross-sectional volatility is low, or markets are driven more by thematic forces. As they note, this has limited relevance in the long run, but may add a “timing element to any evaluation of active versus passive investment.”
Reason #5: Skilled Managers Can Be Identified
Where a skilled manager can be identified, this is a sufficient condition to adopt an alternative to passive management alone.
Nevertheless, the ability and capacity to identify a skilled manager is necessary where an alternative to passive management is to be contemplated.
The discussion makes the following points:
At the very least bad managers should be avoided
Markets can never be perfectly efficient, therefore some room exists for outperformance through skill
Not all fund managers are created equal, some are good and some are bad
The research capability and skill to identify and select a manager is an important consideration.
Implementation and Costs
It is important to note, the framework aims first to work out whether there is a case for rejecting a passive index default. The next step is then to ask how much an investor is willing to pay and how the alternative can be accessed.
“In most cases this alternative will be what is traditionally known as “actively managed investing.” In other circumstances this need not be the case, or the skills-based component may be minor.”
The cost versus the benefit and accessing the preferred alternative approach to passive index are key implementation issues.
Concluding Comments
Warren and Ezra make the point that too much of the debate on active versus Passive relies on the analysis of US equities, they think it is unreasonable to base broad conclusions about the efficiency of passive indexing on a single asset class or subclass.
For the record, please see this Post, Kiwi Wealth caught in an active storm, on my thoughts on the active vs passive debate, we really need to move on and broaden the discussion. The debate is not black vs White, as highlighted in this article, there are large grey areas.
Based on the US Department of Labor (DOL) guidance US retirement plans, Defined Contribution (DC), can include certain private equity strategies into diversified investment options, such as target date or balanced funds, while complying with ERISA (laws that govern US retirement plans).
This is anticipated to result in better outcomes for US investors.
It is also anticipated to provide a further tailwind for the Private Equity sector which is expected to experience significant growth over the decade ahead, as outlined
Private equity investments have long been incorporated in defined benefit (DB) plans, DC plans, 401(k) retirement plans similar to KiwiSaver Funds offered in New Zealand and superannuation funds around the world, have mainly steered away from incorporating Private Equity in their plans due to litigation concerns.
By way of summary, the DOL provides the following guidance. In adding a private equity allocation, the risks and benefits associated with the investment should be considered.
In making this determination, the fiduciary should consider:
whether adding the asset allocation fund with a private equity component would offer plan participants the opportunity to invest their accounts among more diversified investment options within an appropriate range of expected returns net of fees and the diversification of risks over a multi-year period;
whether using third-party investment experts as necessary or managed by investment professionals have the capabilities, experience, and stability to manage an asset allocation fund that includes private equity effectively;
limit the allocation to private equity in a way that is designed to address the unique characteristics associated with such an investment, including cost, complexity, disclosures, and liquidity, and has adopted features related to liquidity and valuation.
It is worth noting that the SEC (U.S. Securities and Exchange Commission) has adopted a 15% limit on investments into illiquid assets by US open-ended Funds such as Mutual Funds (similar to Unit Trusts) and ETFs.
In addition, the DOL suggests consideration should be given to the plan’s features and participant profile e.g. ages, retirement age, anticipated employee turnover, and contribution and withdrawal patterns.
The DOL letter outlines a number of other appropriate considerations, such as Private Equity to be independently valued in accordance with agreed valuation procedures.
It is important to note the guidance is in relation to Private Equity being offered as part of a multi-asset class vehicle structure as a custom target date, target risk, or balanced fund. Private Equity cannot be offered as a standalone investment option.
It is estimated that as much as $400 billion of new assets could be assessed by Private Equity businesses as a result of the DOL guidance, as outlined in this FT article.
Increased innovation is expected, more Private Equity vehicles that offer lower fees and higher levels of liquidity will be developed.
A number of Private Equity firms are expected to benefit.
For example, Partners Group and Pantheon stand to benefit, see below for comments, they launched Private Equity Funds with daily pricing and liquidity in 2013. These Funds were designed for 401(k) plans.
As you would expect, they reference research by the Georgetown Center for Retirement Initiatives which concludes that including a moderate allocation to private equity in a target-date fund could increase the participant’s annual retirement income by at least 6%.
They also comment, private markets provide valuable diversification in an investment portfolio in light of a shrinking public markets sector that has seen the number of US publicly-traded companies decline by around 50% since 1996.
This observation is consistent with one of the key findings from the recently published CAIA Association report, The Next Decade of Alternative Investments: From Adolescence to Responsible Citizenship.
The DOL guidance will provide another tailwind for Private Equity.
For those interested, this paper by the TIAA provides valuable insights into the optimal way of building an allocation to Private Equity within a portfolio.
Potentially significant Industry Impact
The DOL Letter has been well received by industry participants as outlined in this P&I article.
The article stresses that the guidance will help quell some sponsor’s litigation fears and with a good prudent process Private Equity can be added to a portfolio.
The DOL believes the guidance letter “helps level the playing field for ordinary investors and is another step by the department to ensure that ordinary people investing for retirement have the opportunities they need for a secure retirement.”
The DOL Letter is in response to a Groom Law Group request on behalf of its clients Pantheon Ventures and Partners Group, who have developed private equity strategies that can accommodate DC plans. The DOL specifically referenced Partners Groups Funds and commented their Private Equity Funds are “designed to be used as a component of a managed asset allocation fund in an individual account plan.”
Partners Group said in a statement that the DOL has taken “a major step toward modernizing defined contribution plans and providing participants with a more secure retirement. At a time when working families are struggling to save, this guidance gives fiduciaries the certainty they need to finally provide main street Americans access to the same types of high-performing, diversifying investments as wealthy and large institutional investors, all within the safety of their 401(k) plans.”
Further comments by Partner Group can be found here.
After reaching a historical high on 19th February the US sharemarket, as measured by the S&P 500 Index, recorded:
Its fastest correction from a peak, a fall of 10% but less than 19%, taking just 6 days; and
Its quickest period to fall into a Bear market, a fall of greater than 20%, 21 days.
The S&P 500 entered Bear market territory on March 12th, when the market fell 9.5%, the largest daily drop since Black Monday in October 1987.
The 21 day plunge from 19th February’s historical high was half the time of the previous record set in 1929.
Source: ETF.com
This follows the longest Bull market in history, which is a run up in the market without incurring a 20% or more fall in value. The last Bear market occurred in 2008 during the Global Financial Crisis (GFC).
The 11-year bull market grew in tandem with one of the longest economic expansions in US history, this too now looks under threat with a recession in the US now looking likely over the first half of 2020. Certainly, global recession appears most likely.
Global sharemarkets around the world have suffered similar declines, some have suffered greater declines, particularly across Europe.
Markets lost their complacency mid-late February on the spreading of the coronavirus from China to the rest of the world and after Chinese manufacturing data that was not only way below expectations but was also the worst on record.
A crash in the oil price, which slumped more than 30%, added to market anxieties.
Extreme Volatility
The recent period has been one of extreme market volatility, not just in sharemarkets, but currencies, fixed income, and commodity markets.
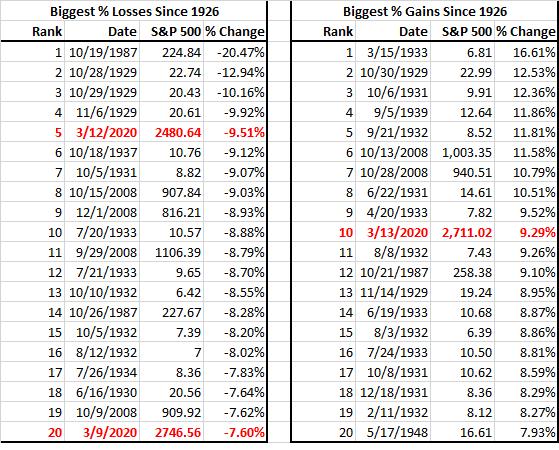
As the Table, courtesy of Bianco Research, below highlights, three of the five days in the week beginning 9th March are amongst the 20 biggest daily gains and losses.
After the 9.5% decline on 12th March, the market rebounded 9.3% the following day. The 7.6% decline on the 9th March was, to date, the 20th largest decline recorded by the S&P 500.
2020 is joining an infamous group of years, which include 1929, 1987, and 2008.
To get a sense as to how much markets are likely to fall, and for how long, they look at the long-term history of the US sharemarket. They also categories Bear markets into three types, reflecting that Bear markets have different triggers and characteristics.
The three types as defined by GS are:
Structural bear market – triggered by structural imbalances and financial bubbles. Very often there is a ‘price’ shock such as deflation that follows.
Cyclical bear markets – typically a function of rising interest rates, impending recessions and falls in profits. They are a function of the economic cycle.
Event-driven bear markets – triggered by a one-off ‘shock’ that does not lead to a domestic recession (such as a war, oil price shock, EM crisis or technical market dislocation).
They then plot US Bear Markets and Recoveries since the 1800s, as outlined in the following Table:
Source: Goldman Sachs
From this they can characterise the historical averages of the three types of Bear markets, as outlined at the bottom of the Table:
GS summarise:
Structural bear markets on average see falls of 57%, last 42 months and take 111 months to get back to starting point in nominal terms (134 months in real terms (after inflation)).
Cyclical bear markets on average see falls of 31%, last 27 months and take 50 months to get back to starting point in nominal terms (73 months in real terms).
Event-driven bear markets on average see falls of 29%, last 9 months and recover within 15 months in nominal terms (71 months in real terms).
In their opinion GS currently think we are in an Event-driven Bear market. Generally these Bear markets are less severe, but the speed of the fall in markets is quicker, as is the recover. However, as they note none of the previous Event-Driven Bear markets were triggered by the outbreak of a Virus, nor were interest rates so low at the start of the market decline.
Therefore, they conclude, a fall of between 20-25% can be expected, and the rebound will be swift.
This makes for an interest couple of quarters, in which the economic data and company profit announcements are sure to get worse, yet equity markets will likely look through this for evidence of a recovery in economic activity over the second half of this year.